

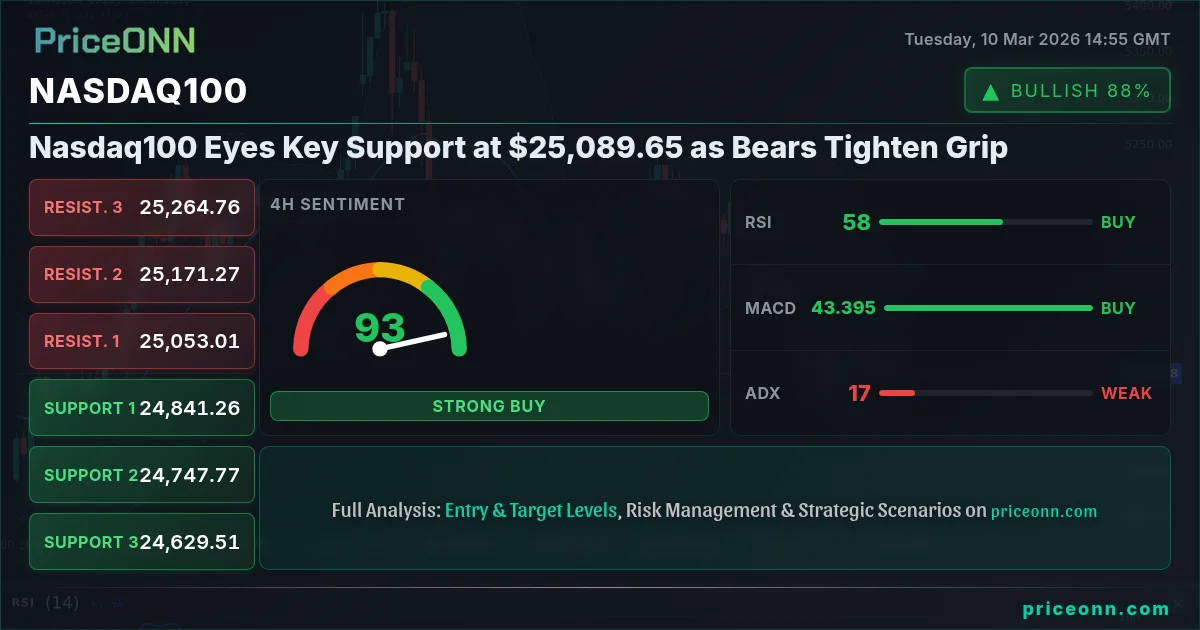
Nasdaq100 today analysis reveals a market at a critical juncture, trading around $25,089.65, as bearish sentiment gains momentum. The index is testing key support levels, and a breakdown could trigger further downside.
- RSI at 65.45 signals potential for a pullback in the short term.
- Critical support for Nasdaq100 sits at 24,881, tested multiple times this week.
- MACD histogram shows weakening momentum: bullish strength is fading.
- Fed rate expectations and geopolitical tensions are driving Nasdaq100 correlation with DXY.
Having tracked Nasdaq100 through various market cycles, it's clear that the current setup demands caution. Escalating geopolitical tensions, particularly in the Middle East, are fueling risk-off sentiment, driving investors towards safe-haven assets and putting pressure on equity markets. The dollar index at 98.37 exerts further pressure on the Nasdaq100.
Why $24,881 is the Line in the Sand
The level of $24,881 represents a crucial support zone that has held firm in recent trading sessions. A decisive break below this level could open the door to further declines, potentially targeting the next support level at 24,820.73. This is not just a technical level- it's a psychological one as well. Many traders are watching this level for confirmation of the bearish thesis.
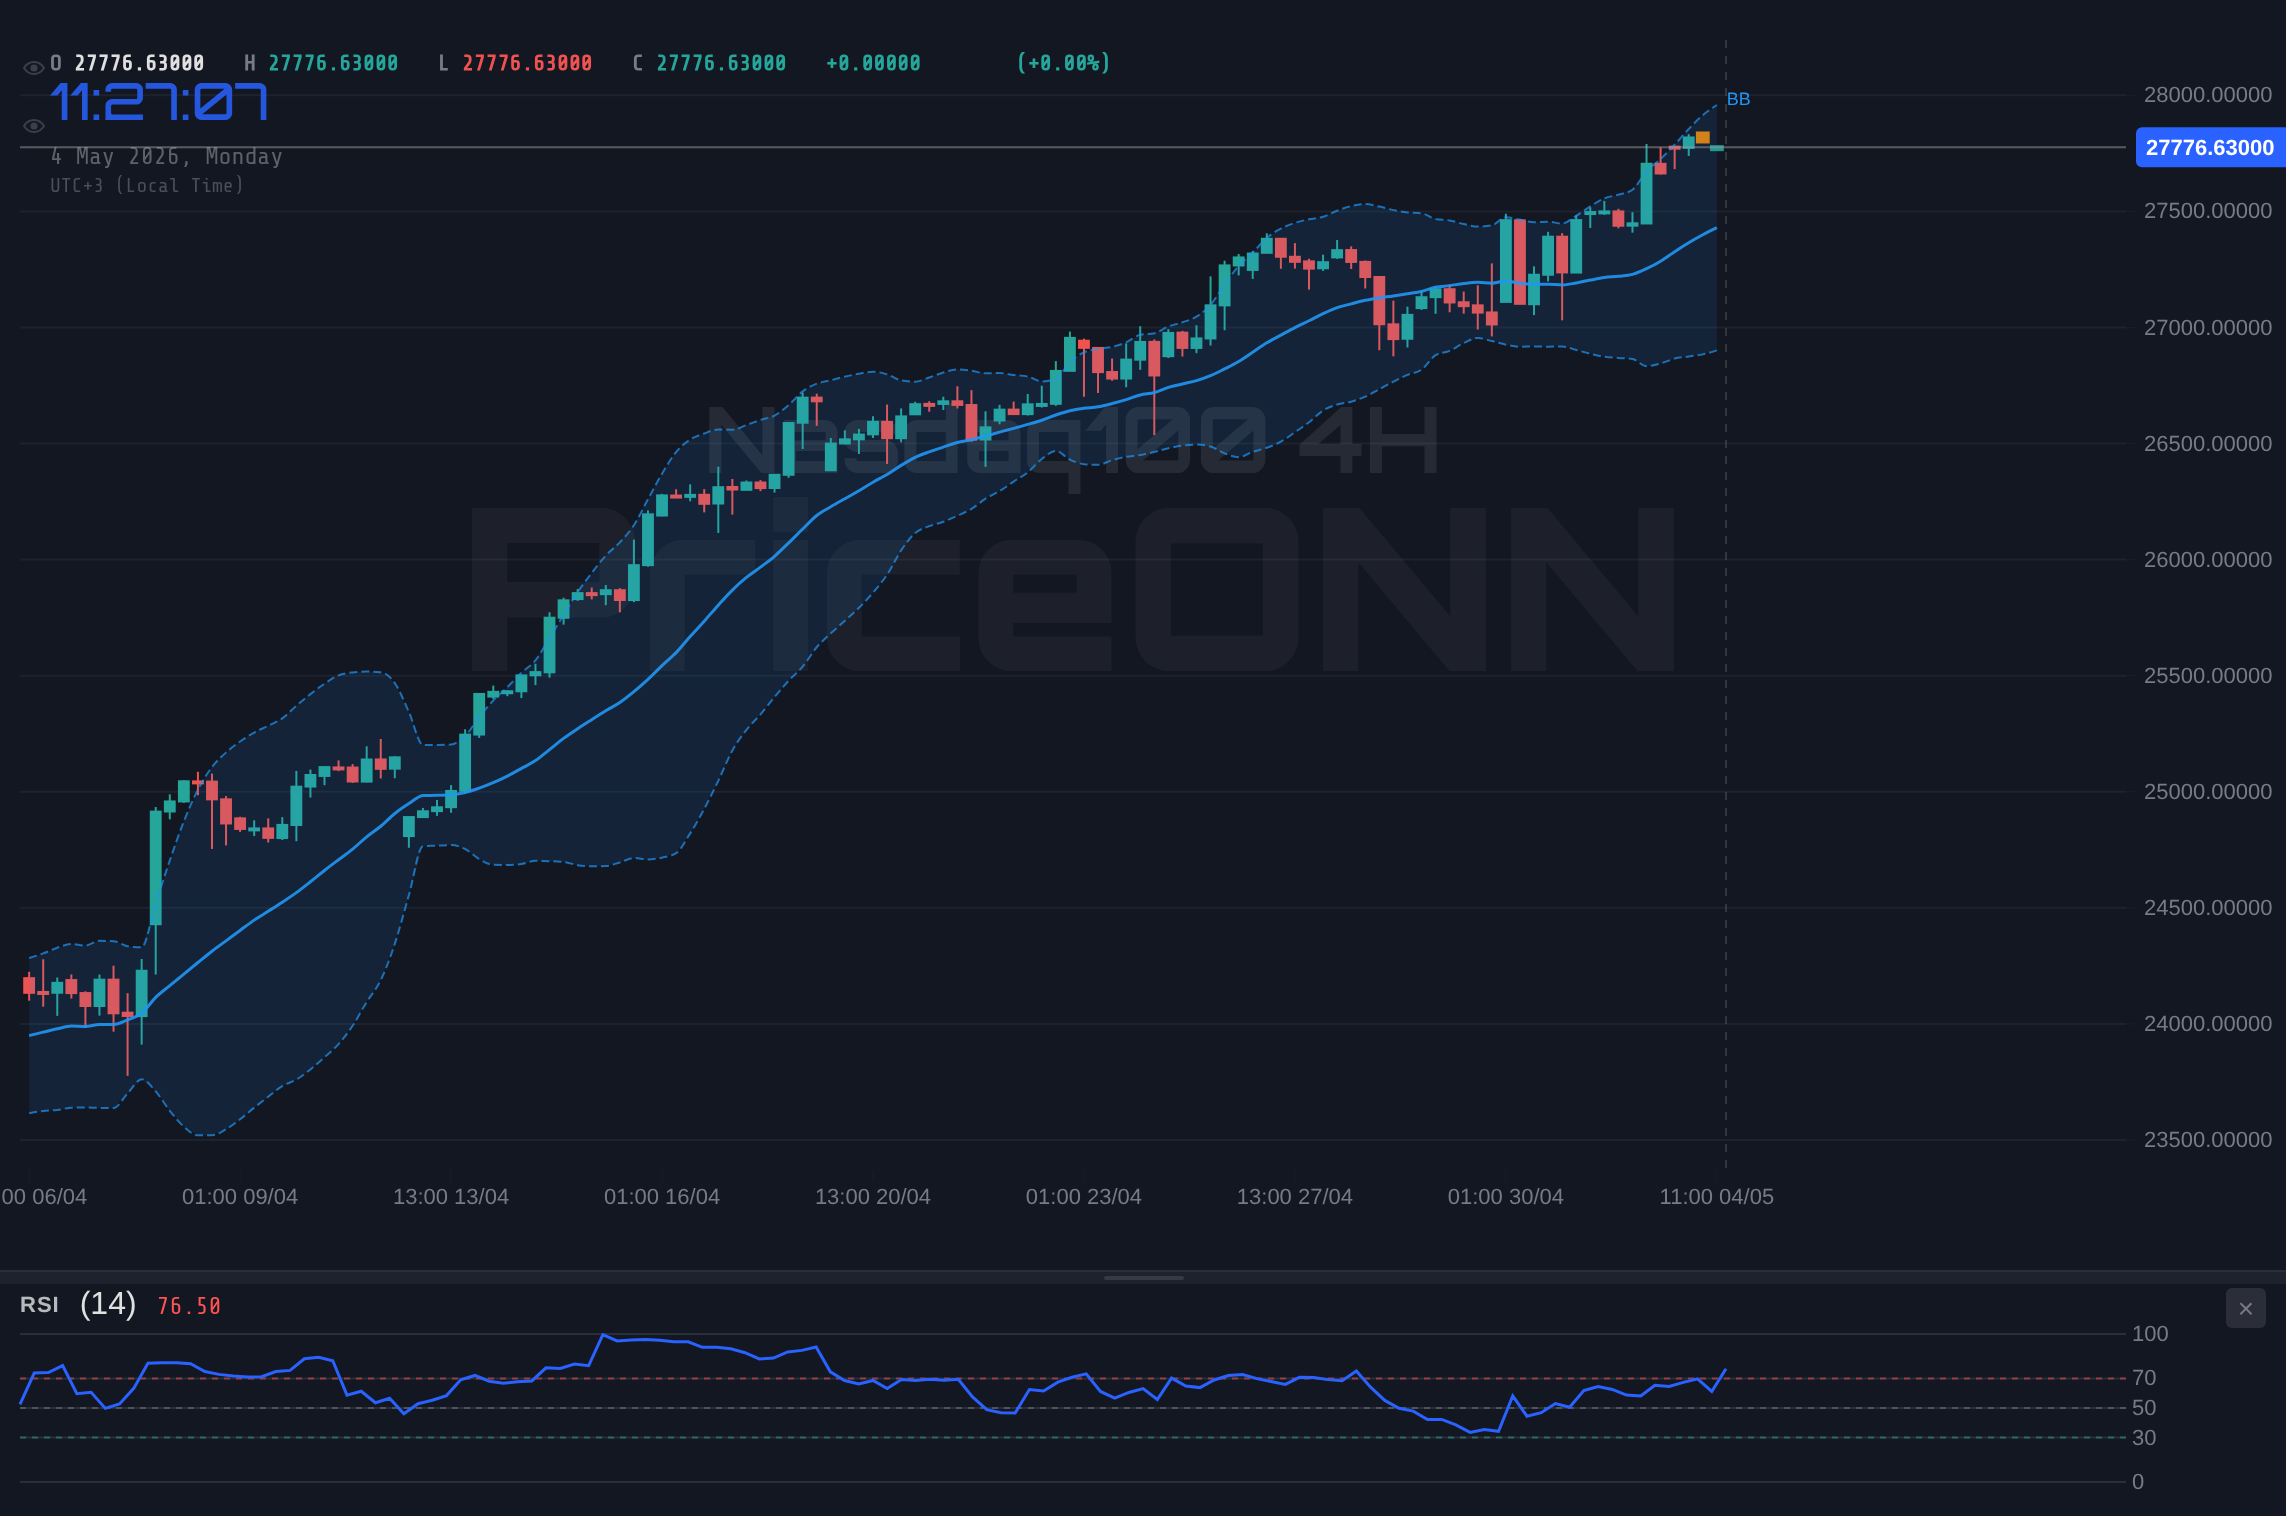
The 1H chart shows a strong upward trend with a strength of 96%, but a deeper dive reveals a potential reversal. The RSI(14) stands at 65.45, hovering near overbought territory, indicating that the recent rally may be losing steam. The Stochastic oscillator (K=55.27, D=69.85) also confirms this, flashing a bearish signal as %K is less than %D. The current ADX reading of 32.73 indicates a strong uptrend, but the aforementioned indicators point to a potential correction.
Fundamental Drivers: Geopolitical Risks and Rate Hike Expectations
The recent surge in oil prices, driven by geopolitical tensions, is adding to inflationary pressures, potentially forcing the Federal Reserve to maintain its hawkish stance. According to Reuters, Fed officials are closely monitoring inflation data, and persistent price pressures could lead to further interest rate hikes. This is weighing on risk appetite and contributing to the bearish sentiment surrounding Nasdaq100.
The economic calendar also plays a crucial role. Markets are anticipating key economic data releases this week, including [USD] on March 10 (Tuesday) and [EUR] on March 11 (Wednesday). These data points will provide further insights into the health of the global economy and could influence central bank policy decisions. Any disappointing data could exacerbate the downward pressure on Nasdaq100.
Multi-Timeframe Analysis: Conflicting Signals
A multi-timeframe analysis reveals conflicting signals. While the 1H chart suggests a strong uptrend, the 1D chart paints a different picture. The 1D chart shows a downtrend with a strength of 94%. The RSI(14) on the daily chart is at 51.15, indicating neutral momentum. The MACD histogram is positive, but the Stochastic oscillator (K=57.96, D=51.8) is flashing a bearish signal. This divergence highlights the uncertainty surrounding Nasdaq100's near-term outlook.
The key is to watch how the market resolves these conflicting signals. A sustained break below 24,881 on the 1H chart, coupled with confirmation from the 1D chart, could signal a deeper correction. Conversely, a rebound from this level could indicate that the bulls are still in control. The 4H chart shows a neutral trend with a strength of 50%. The RSI(14) is at 57.82, and the MACD is positive. However, the Stochastic oscillator (K=94.59, D=76.72) is in overbought territory, suggesting that the upside may be limited.
What the MACD Signal Tells Us About Nasdaq100 Trend Analysis
The MACD is an indicator that can provide valuable insights into the trend direction and momentum. On the 1H chart, the MACD histogram is positive, indicating bullish momentum. However, the histogram is shrinking, suggesting that the momentum may be fading. On the 4H chart, the MACD is also positive, but the signal line is approaching the MACD line, which could signal a potential bearish crossover.
The key is to watch for a sustained bearish crossover on the 4H chart, which could confirm the bearish thesis. This would indicate that the selling pressure is increasing and that the bears are gaining control. The current support level for Nasdaq100 is 24,881. A break below this level could trigger a sell-off, potentially targeting the next support level at 24,820.73.
The dollar is retreating as markets stabilize after the initial oil shock, with investors re-evaluating the likelihood of managed conflict. According to Bloomberg, the Chinese central bank continues to increase gold reserves, contributing to the risk-off sentiment. This is putting pressure on equity markets, including Nasdaq100. The Australian dollar is also under pressure as the Reserve Bank of Australia grapples with rising oil prices and their impact.
Nasdaq100 Key Levels and Potential Trade Scenarios
The Nasdaq100 faces a critical juncture. Here are the key levels to watch and potential trade scenarios:
The bullish scenario involves a rebound from the 24,881 support level, targeting the resistance at 24986.58, then 25031.89. This scenario gains traction if the upcoming economic data surprises to the upside and geopolitical tensions ease.
The bearish scenario involves a breakdown below 24,881, leading to a test of 24820.73 and potentially 24775.42. This scenario is more likely if the economic data disappoints and geopolitical risks escalate.
The ADX at 17.19 on the 4H chart is the real story here. A weak-trend reading like this means the breakout hasn't committed yet- it could go either way. Patience looks like it will be rewarded here. Manage your risk, wait for your setup- the market always gives a second chance.
Frequently Asked Questions: Nasdaq100 Analysis
What happens if Nasdaq100 breaks below 24,881 support?
If Nasdaq100 breaks below 24,881 support, it could trigger a sell-off, potentially targeting the next support level at 24820.73. This would confirm the bearish thesis and suggest further downside potential.
Should I buy Nasdaq100 at current levels of $25,089.65 given the RSI at 65.45?
Given the RSI at 65.45 and the bearish signal from the Stochastic oscillator, it may be prudent to wait for a pullback before considering a long position. A more attractive entry point could be near the 24,881 support level.
Is the bearish signal from the Stochastic oscillator a reliable indicator right now?
While the Stochastic oscillator is flashing a bearish signal, it's important to consider the overall context. The MACD histogram is still positive, and the ADX indicates a strong uptrend. Therefore, the Stochastic signal should be viewed with caution and confirmed by other indicators.
How will the upcoming economic data releases affect Nasdaq100 this week?
The upcoming economic data releases, including [USD] on March 10 (Tuesday) and [EUR] on March 11 (Wednesday), could significantly impact Nasdaq100. Strong data could support the bullish thesis, while weak data could exacerbate the bearish sentiment.
Volatility creates opportunity - those prepared will be rewarded. The key is to manage risk, wait for high-probability setups, and remain patient. The market always gives a second chance.
Track markets in real-time
AI-powered analysis, technical indicators and real-time price data.
Join Our Telegram Channel
Breaking market news, AI analysis and trading signals instantly.
Join Channel