WTI Approaches $88.56: Is the Rally Set to Continue Despite Overbought RSI?
WTI crude oil is surging, currently trading near $88.56. The key question is whether this rally can be sustained given overbought conditions signaled by the RSI.
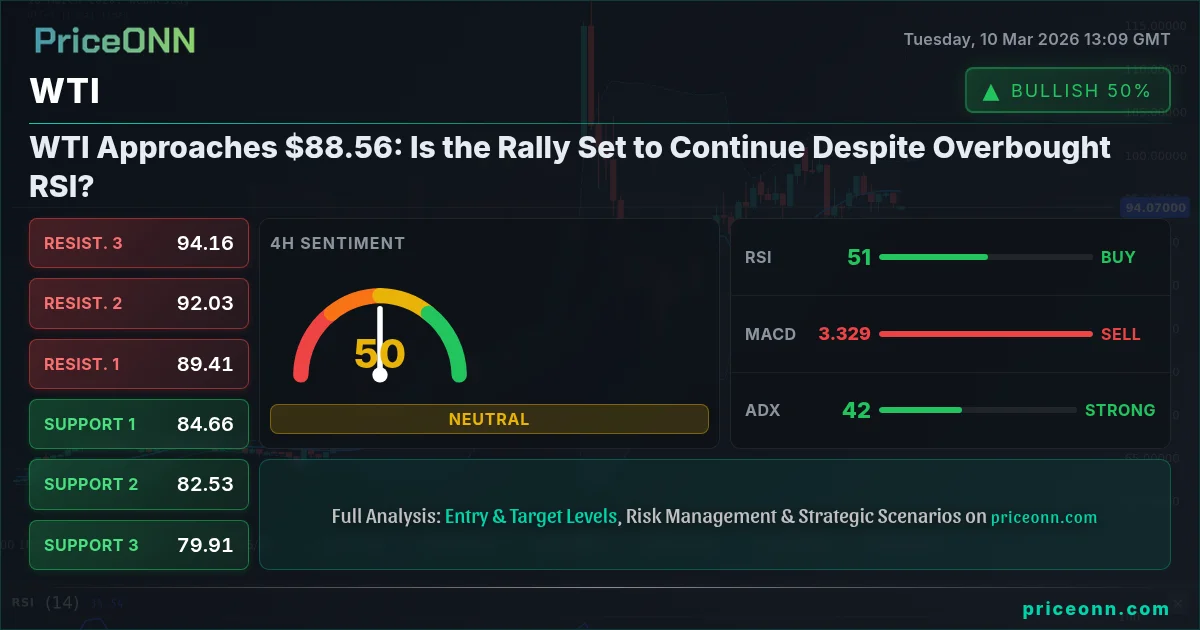
WTI crude oil's recent surge has caught the attention of traders worldwide. The commodity is currently trading around $88.56, a significant jump from its recent lows. The question now is whether this rally has legs, or if it's a short-term spike before a potential correction. The price action is especially intriguing given that the Relative Strength Index (RSI) is signaling overbought conditions, suggesting that the upward momentum may be unsustainable.
- RSI at 76.64 signals overbought conditions, potentially leading to a pullback in WTI.
- Critical resistance lies at $91.97, a break above which could signal further upside.
- The MACD histogram shows positive momentum, but divergence could indicate fading bullish strength.
- Geopolitical tensions continue to drive WTI prices, with upcoming economic data releases adding to the volatility.
Having tracked WTI through various geopolitical events and economic cycles, it's clear that the current environment is particularly complex. The interplay between supply constraints, rising global demand, and inflationary pressures is creating a volatile mix. Let's delve into the factors influencing WTI's price action and what traders should be watching closely.
What's Fueling the WTI Fire? Fundamental Drivers Behind the Surge
Several fundamental factors are contributing to WTI's current rally. The most prominent is the ongoing geopolitical tensions in the Middle East, which are raising concerns about potential supply disruptions. According to Reuters, the market is pricing in a higher risk premium due to these uncertainties. Furthermore, the global economic recovery, particularly in Asia, is boosting demand for crude oil. This increase in demand, coupled with constraints on supply, is creating upward pressure on prices.
The recent rise in WTI also reflects broader inflationary pressures in the global economy. As central banks grapple with rising consumer prices, commodities like oil are often seen as a hedge against inflation. This has led to increased investment in WTI, further driving up its price. The dollar index (DXY) is currently at 98.39, and as the dollar strengthens, it typically puts downward pressure on commodities. However, the geopolitical factors and supply concerns seem to be overriding this inverse correlation in WTI's case.
Upcoming economic data releases, particularly the US CPI data, will be crucial in determining the sustainability of this rally. Higher-than-expected inflation could further fuel the fire, while weaker data might trigger a correction. Keep an eye on the economic calendar, as the market will be highly sensitive to these releases.
Technical Signals: A Multi-Timeframe Analysis of WTI
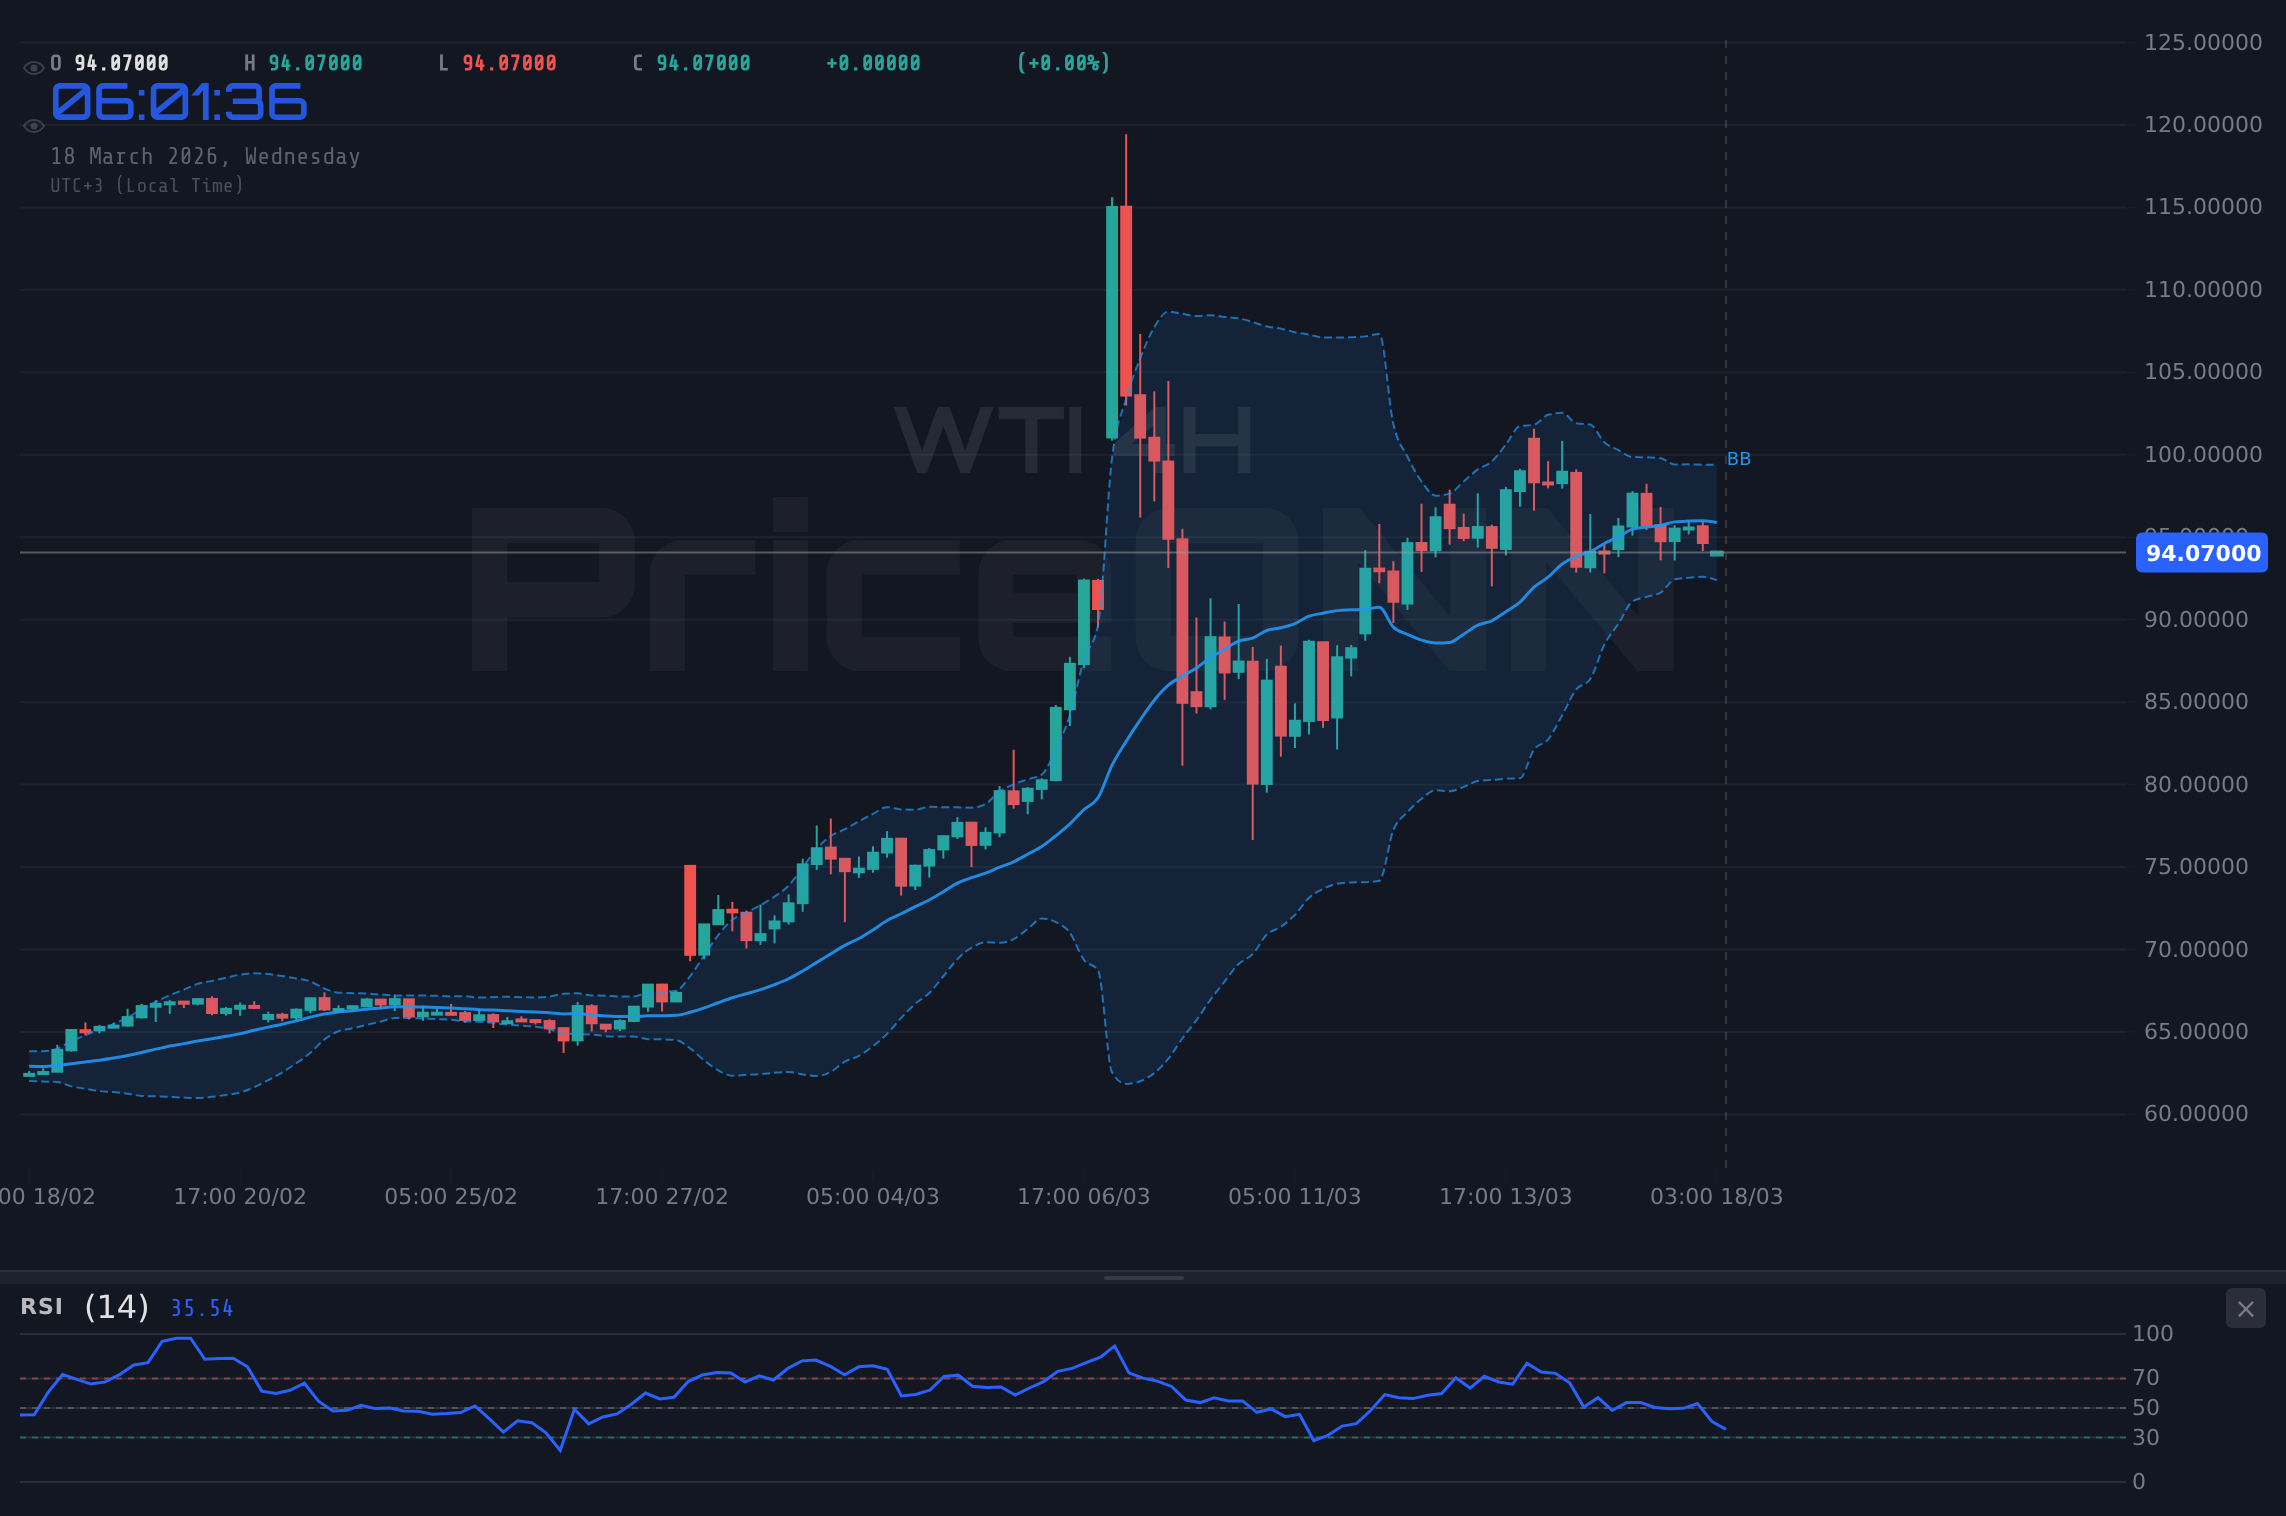
A multi-timeframe analysis of WTI reveals a mixed picture. On the daily chart, the trend is strongly bullish, with the ADX at 44.27 indicating a powerful uptrend. However, the RSI at 76.64 suggests that the market is overbought, which could signal a potential pullback. The Stochastic oscillator also supports this view, with K=58.77 and D=75.94 indicating a potential bearish crossover.
On the 4-hour chart, the trend remains bullish, but the RSI is lower at 52.56, giving a bit more room for the rally to continue. The Stochastic, however, shows a bearish signal with K=16.38 and D=30.88. The ADX at 43.38 still confirms a strong trend. This discrepancy between the daily and 4-hour charts suggests that the rally may be losing some steam, but the overall trend remains upward.
The hourly chart paints a more bearish picture. The trend is bearish, and the RSI is at 45.13. The Stochastic has K=61.16 and D=52.03, signalling a bullish crossover, which could indicate a short-term bounce. However, the ADX at 32.95 shows a strong downtrend, and the price is below the middle band of the Bollinger bands. This suggests that the short-term momentum is to the downside.
What $91.97 Resistance Means for Different Trader Types
The $91.97 resistance level is a crucial point for traders of all time horizons. For scalpers, a break above this level could present short-term buying opportunities, but the overbought conditions suggest caution. Swing traders should watch for a sustained break above $91.97, confirmed by increasing volume, before entering long positions. A failure to break this level could lead to a pullback towards the $85.23 support.
Long-term investors should focus on the bigger picture. While short-term volatility is inevitable, the underlying fundamentals of rising global demand and supply constraints suggest that WTI prices are likely to remain elevated in the long run. A pullback towards key support levels could be seen as a buying opportunity for those with a longer time horizon. The daily support sits at $70.93. This level should be viewed as a long-term floor, representing a significant buying opportunity if tested.
It's also crucial to consider the correlation between WTI and other asset classes. A rising WTI price typically leads to higher inflation expectations, which can put downward pressure on equities. The SP500 is currently at 6783.95 and is exhibiting a strong downtrend, which may be related to rising oil prices. Traders should monitor these correlations closely to manage their overall portfolio risk. A stronger dollar, with the DXY at 98.39, can also create headwinds for WTI.
WTI: Bullish Breakout or Bearish Reversal?
Given the mixed signals from the technical indicators and the complex interplay of fundamental factors, it's challenging to make a definitive call on WTI's future direction. However, a few key levels and events could provide more clarity. A sustained break above the $91.97 resistance would signal a continuation of the bullish trend, while a failure to break this level could lead to a deeper correction towards the $85.23 support. The upcoming US CPI data will also be crucial in determining the market's next move.
The current situation presents both opportunities and risks for traders. Those who are long WTI should consider taking profits at resistance levels, while those who are short should be cautious given the strong underlying uptrend. The key is to manage risk carefully and to wait for confirmation before making any significant moves.
The rise in WTI is also intricately linked to geopolitical developments. As reported by Bloomberg, ongoing tensions in the Middle East are adding a risk premium to oil prices. Any escalation of these tensions could lead to further supply disruptions and drive prices even higher. Therefore, traders should closely monitor geopolitical news and be prepared to adjust their positions accordingly.
The Impact of Economic Events on WTI
The economic calendar is packed with events that could significantly impact WTI prices. On Wednesday, the EUR is scheduled to have an event. Additionally, the USD also has an event scheduled on Wednesday. These figures will provide insights into the strength of the global economy and the potential for increased oil demand. Later in the week, on Friday, the GBP is scheduled to have an event. Any surprises in these figures could trigger sharp moves in WTI prices.
The Federal Reserve's monetary policy decisions also play a crucial role in influencing WTI prices. As the Fed continues to tighten monetary policy to combat inflation, it could lead to a slowdown in economic growth and a decrease in oil demand. This dynamic creates a tug-of-war between inflationary pressures and the potential for a recession. Traders should carefully assess the Fed's stance and its potential impact on WTI prices.
The relationship between WTI and the DXY (Dollar Index) is also worth noting. Typically, a stronger dollar puts downward pressure on oil prices, as it makes oil more expensive for international buyers. However, in the current environment, geopolitical factors and supply concerns seem to be overriding this inverse correlation. Traders should monitor the DXY closely to gauge its potential impact on WTI prices.
WTI's Historical Performance and Future Outlook
WTI's historical performance provides valuable insights into its potential future trajectory. Over the past decade, WTI prices have been highly volatile, influenced by a range of factors including geopolitical events, economic cycles, and technological advancements in oil production. The shale oil boom in the United States, for example, significantly altered the global oil landscape and put downward pressure on prices. However, the recent focus on renewable energy and the potential for peak oil demand could create new dynamics in the years to come.
Looking ahead, WTI prices are likely to remain volatile, influenced by a complex interplay of factors. While the current rally may face headwinds from overbought conditions and potential economic slowdown, the underlying fundamentals of rising global demand and supply constraints suggest that prices are likely to remain elevated in the long run. Traders should carefully monitor these factors and adjust their positions accordingly.
Frequently Asked Questions: WTI Analysis
What happens if WTI breaks above $91.97 resistance?
A sustained break above the $91.97 resistance level would likely trigger further upside momentum, potentially targeting the $95.01 level. This breakout needs confirmation by increasing volume and positive economic data.
Should I buy WTI at current levels of $88.56 given the RSI at 76.64?
Given the overbought RSI signal at 76.64, buying WTI at $88.56 carries significant risk of a pullback. It would be prudent to wait for a correction towards the $85.23 support level before considering a long position.
Is the ADX at 44.27 a reliable signal for a continued WTI uptrend?
An ADX of 44.27 does indicate a strong uptrend on the daily chart. However, it is important to consider this signal in conjunction with other indicators, such as the RSI and Stochastic, which are signaling overbought conditions.
How will the upcoming US CPI data affect WTI this week?
Higher-than-expected US CPI data could further fuel inflationary pressures and drive WTI prices higher. Conversely, weaker data might trigger a correction, as it would suggest a slowdown in economic growth and a decrease in oil demand.
Track markets in real-time
AI-powered analysis, technical indicators and real-time price data.
Join Our Telegram Channel
Breaking market news, AI analysis and trading signals instantly.
Join Channel