AUDUSD is currently trading around $0.71296, exhibiting a bullish bias in the short term. The pair is testing immediate resistance, while the broader market context remains uncertain amid a deluge of economic data and escalating geopolitical tensions. The dollar index (DXY) currently sits at 98.61, showing signs of strength that could weigh on AUDUSD's upward momentum. The question now is whether the bulls can sustain this rally or if the bears will regain control.
- RSI at 57.38 on the 1-hour chart suggests increasing bullish momentum, but not yet overbought.
- Immediate resistance lies at 0.71175, a break above which could trigger further upside.
- ADX at 40.18 on the 1-hour chart indicates a strong uptrend, supporting the bullish scenario.
- Upcoming USD data releases and Middle East tensions are key catalysts impacting AUDUSD correlation with DXY.
The 1-hour chart for AUDUSD shows a neutral trend, but the RSI(14) reads 57.38, indicating rising bullish momentum without being in overbought territory. The ADX on the 1-hour timeframe is at 40.18, signaling a strong uptrend. However, the MACD shows negative momentum, creating a mixed picture for short-term traders. Scalpers should watch for a break above the immediate resistance at 0.71175, which could trigger a quick long trade. Conversely, a failure to break this level could signal a short-term pullback.
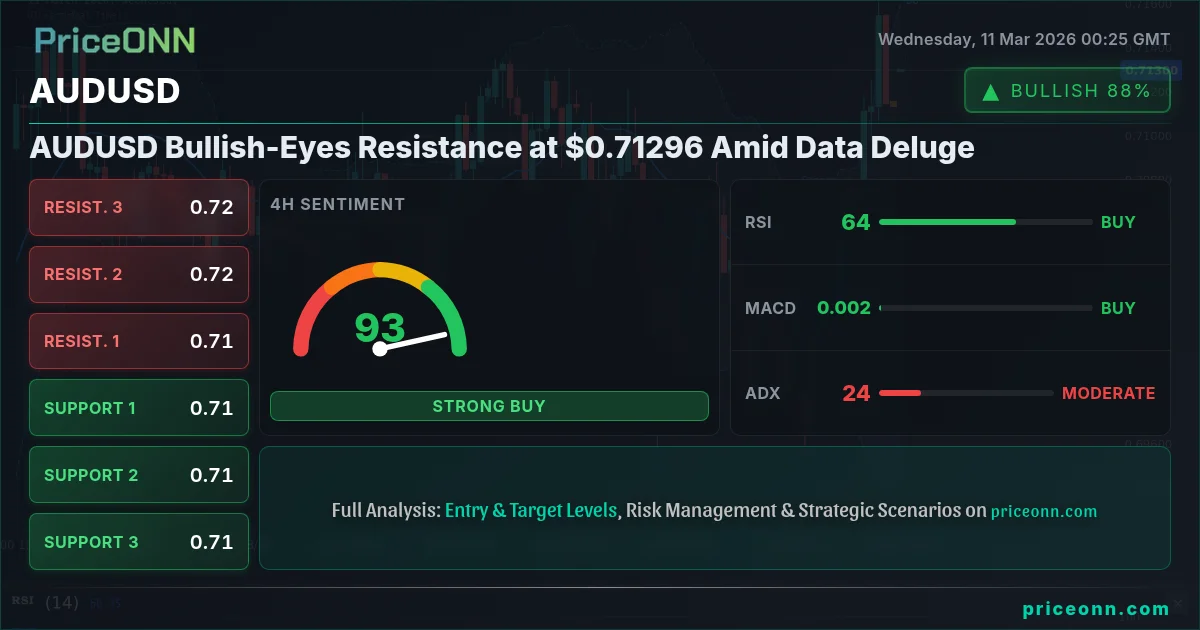
Moving to the 4-hour chart, the trend remains neutral. The RSI(14) sits at 59.42, further confirming the bullish sentiment. The MACD, however, shows positive momentum. The Stochastic oscillator is in overbought territory, with K=84.36 and D=91.91, suggesting a potential pullback. The ADX reads 24.15, indicating a moderate uptrend. Swing traders should monitor the support level at 0.71188. A hold above this level would keep the bullish bias intact, while a break below could trigger a deeper correction toward 0.70829.

Zooming out to the daily timeframe, the trend is bullish, with a strength of 89%. The RSI(14) reads 59.2, suggesting further upside potential. The MACD exhibits negative momentum, while the Stochastic oscillator shows a bullish crossover (K=63.06, D=55.2). The ADX at 28.69 indicates a strong uptrend. Long-term investors should focus on the support level at 0.69955. As long as price holds above this level, the overall bullish trend remains intact. A break below could signal a trend reversal and a potential shift toward bearish territory.
From a fundamental perspective, AUDUSD is heavily influenced by economic data releases from both Australia and the United States. The Reserve Bank of Australia's (RBA) stance on interest rates and inflation is a key driver for the pair. Recent news indicates the RBA is weighing the impact of rising oil prices on inflation, putting pressure on AUDUSD. On the US side, dollar strength is greatly influenced by the Federal Reserve's monetary policy decisions. The dollar index (DXY) is currently at 98.61. The upcoming USD data releases on Wednesday will be crucial in determining the near-term direction of AUDUSD.
The recent surge in oil prices, triggered by escalating tensions in the Middle East, could have a significant impact on inflation and, consequently, on central bank policies. As reported earlier, oil prices retreated after Iran threatened to halt all Middle East oil exports amid tensions. This volatility in the energy market adds another layer of complexity to the AUDUSD analysis. A continued rise in oil prices could force the RBA to adopt a more hawkish stance, potentially supporting the Australian dollar. Conversely, a decline in oil prices could ease inflationary pressures and lead to a more dovish RBA, weighing on AUDUSD.
The geopolitical landscape is also playing a crucial role in shaping market sentiment and influencing currency movements. The tensions in the Middle East are fueling safe-haven demand, which could benefit the US dollar and put pressure on risk-sensitive currencies like the Australian dollar. Traders should closely monitor these developments and their potential impact on AUDUSD.
The correlation between AUDUSD and other asset classes is also worth noting. AUDUSD typically has a positive correlation with commodity prices, particularly gold and copper. Gold is currently trading near $5,200, supported by long-term trends, but faces pressure as Middle East tensions ease. A sustained rise in commodity prices could provide additional support for the Australian dollar. Additionally, AUDUSD often exhibits an inverse correlation with the US dollar index (DXY). The DXY is currently at 98.61, showing signs of strength that could weigh on AUDUSD.
Looking ahead, the economic calendar is packed with key data releases that could significantly impact AUDUSD. Wednesday will see the release of EUR data. Traders will also be closely watching the USD data. Any surprises in these data releases could trigger sharp movements in AUDUSD. Furthermore, Friday brings GBP data. The market is expecting a reading of 0.1, while the previous was also 0.1. Also on Friday, USD data will be released. The market is expecting a reading of 4.3, while the previous was also 4.3. Finally, Friday brings the last USD data release. The market is expecting a reading of 3, while the previous was also 3.
From a historical perspective, AUDUSD has shown a tendency to consolidate within a range during periods of economic uncertainty. For example, during the 2024 rate cycle, AUDUSD traded within a relatively narrow range as traders awaited clarity on the Fed's monetary policy path. A similar pattern could emerge in the coming weeks as markets digest the latest economic data and geopolitical developments. Having tracked AUDUSD through the 2024 rate cycle, it is evident that patience and disciplined risk management are crucial for navigating these periods of uncertainty.
Understanding market sentiment is also crucial for trading AUDUSD successfully. A simple indicator is the analysis of news headlines. When headlines are positive, AUDUSD is likely to rise. When headlines are negative, AUDUSD is likely to fall. When headlines are mixed, traders should maintain a neutral stance. In the current environment, headlines are mixed, with some focusing on positive economic data and others highlighting geopolitical risks. This suggests a period of consolidation may be in store for AUDUSD.
Frequently Asked Questions: AUDUSD Analysis
What happens if AUDUSD breaks above $0.71175 resistance?
A break above the immediate resistance at 0.71175 could trigger a quick long trade, potentially pushing AUDUSD toward the next resistance level at 0.7179 on the 4-hour chart. However, traders should be aware of the overbought conditions indicated by the Stochastic oscillator.
Should I buy AUDUSD at current levels of $0.71296 given RSI at 57.38?
The RSI at 57.38 on the 1-hour chart suggests increasing bullish momentum, but it's not yet overbought. A buy position could be considered with a tight stop-loss below the 0.71188 support level on the 4-hour chart to manage risk.
Is the overbought Stochastic signal on the 4-hour chart a sell signal for AUDUSD?
The Stochastic oscillator being in overbought territory (K=84.36, D=91.91) on the 4-hour chart suggests a potential pullback. However, it is not a standalone sell signal. Traders should look for confirmation from other indicators or price action before initiating a short position.
How will the upcoming USD data releases on Wednesday affect AUDUSD this week?
The upcoming USD data releases on Wednesday will be crucial in determining the near-term direction of AUDUSD. Stronger-than-expected data could boost the US dollar and weigh on AUDUSD, while weaker-than-expected data could have the opposite effect. Traders should monitor these releases closely and adjust their positions accordingly.
Volatility creates opportunity-those prepared will be rewarded. Patient investors always find opportunities-the key is waiting for the right moment.
Technical Outlook Summary
| Indicator | Value | Signal |
|---|---|---|
| RSI (14) | 57.38 | Neutral |
| MACD Histogram | Negative | Bearish |
| Stochastic | K=12.49, D=34.22 | Bearish |
| ADX | 40.18 | Strong Trend |
| Bollinger | Upper Band | Watch |
Key Levels
Support Levels
Resistance Levels
Track markets in real-time
AI-powered analysis, technical indicators and real-time price data.
Join Our Telegram Channel
Breaking market news, AI analysis and trading signals instantly.
Join Channel