

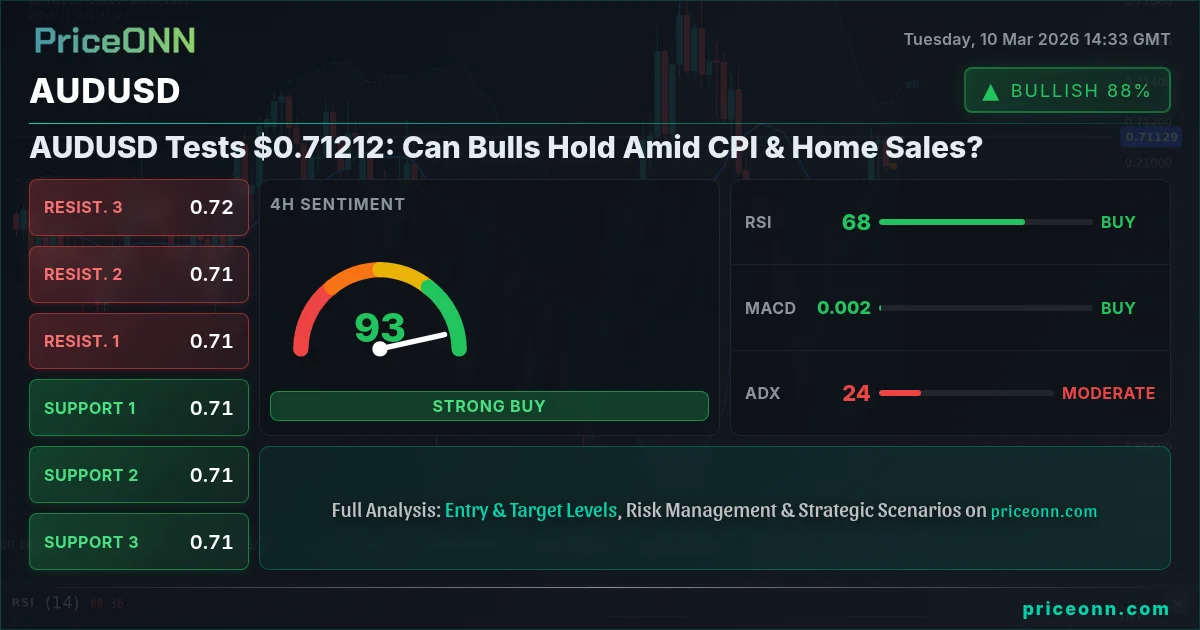
AUDUSD is currently trading near $0.71212, a level that's proving to be a pivotal battleground between bulls and bears. The pair's recent ascent has been impressive, but the sustainability of this rally is now being questioned as traders brace for key economic data releases, including CPI and home sales figures. Will the Aussie dollar continue its upward trajectory, or are we about to witness a reversal?
- RSI at 66.43 on the 1H chart signals increasing bullish momentum, but potential overbought conditions.
- Immediate resistance lies at $0.71215, a break above which could trigger further upside.
- Key support at $0.71052 must hold to maintain the bullish outlook.
- Upcoming USD data releases, especially CPI on Wednesday, could significantly impact AUDUSD correlation with the DXY.
The Bull's Roadmap: Targeting $0.7140
For the bullish scenario to unfold, AUDUSD needs to convincingly clear the immediate resistance at $0.71215. If the pair manages to break and hold above this level, the next target becomes $0.7129, followed by a more ambitious $0.71378. This bullish momentum would likely be fueled by weaker-than-expected US economic data or positive news out of Australia. The 1-hour chart shows a strong uptrend with an ADX of 40.23, suggesting that the current bullish momentum has legs. Scalpers might look for entries on pullbacks to the $0.71052 support, while swing traders would want to see a sustained break above $0.71215 before committing to long positions. Historically, AUDUSD has shown a propensity to rally strongly when commodity prices, particularly iron ore, are on the rise, so keep an eye on that correlation.
The Stochastic oscillator on the 1-hour timeframe, while currently signaling a potential pullback with K=87.07 and D=84.44 in overbought territory, could quickly reverse if the underlying bullish momentum remains strong. Long-term investors should watch for a weekly close above $0.71378 to confirm a more sustained bullish trend. Remember, the strength of the DXY will be a crucial factor. If the dollar index weakens, it will provide further tailwinds for AUDUSD. A key trigger to watch this week is the Australian Home Sales data. A strong reading here could bolster the bullish case, while a weak number might trigger a reversal.
Where Bears Take Control: Below $0.7105
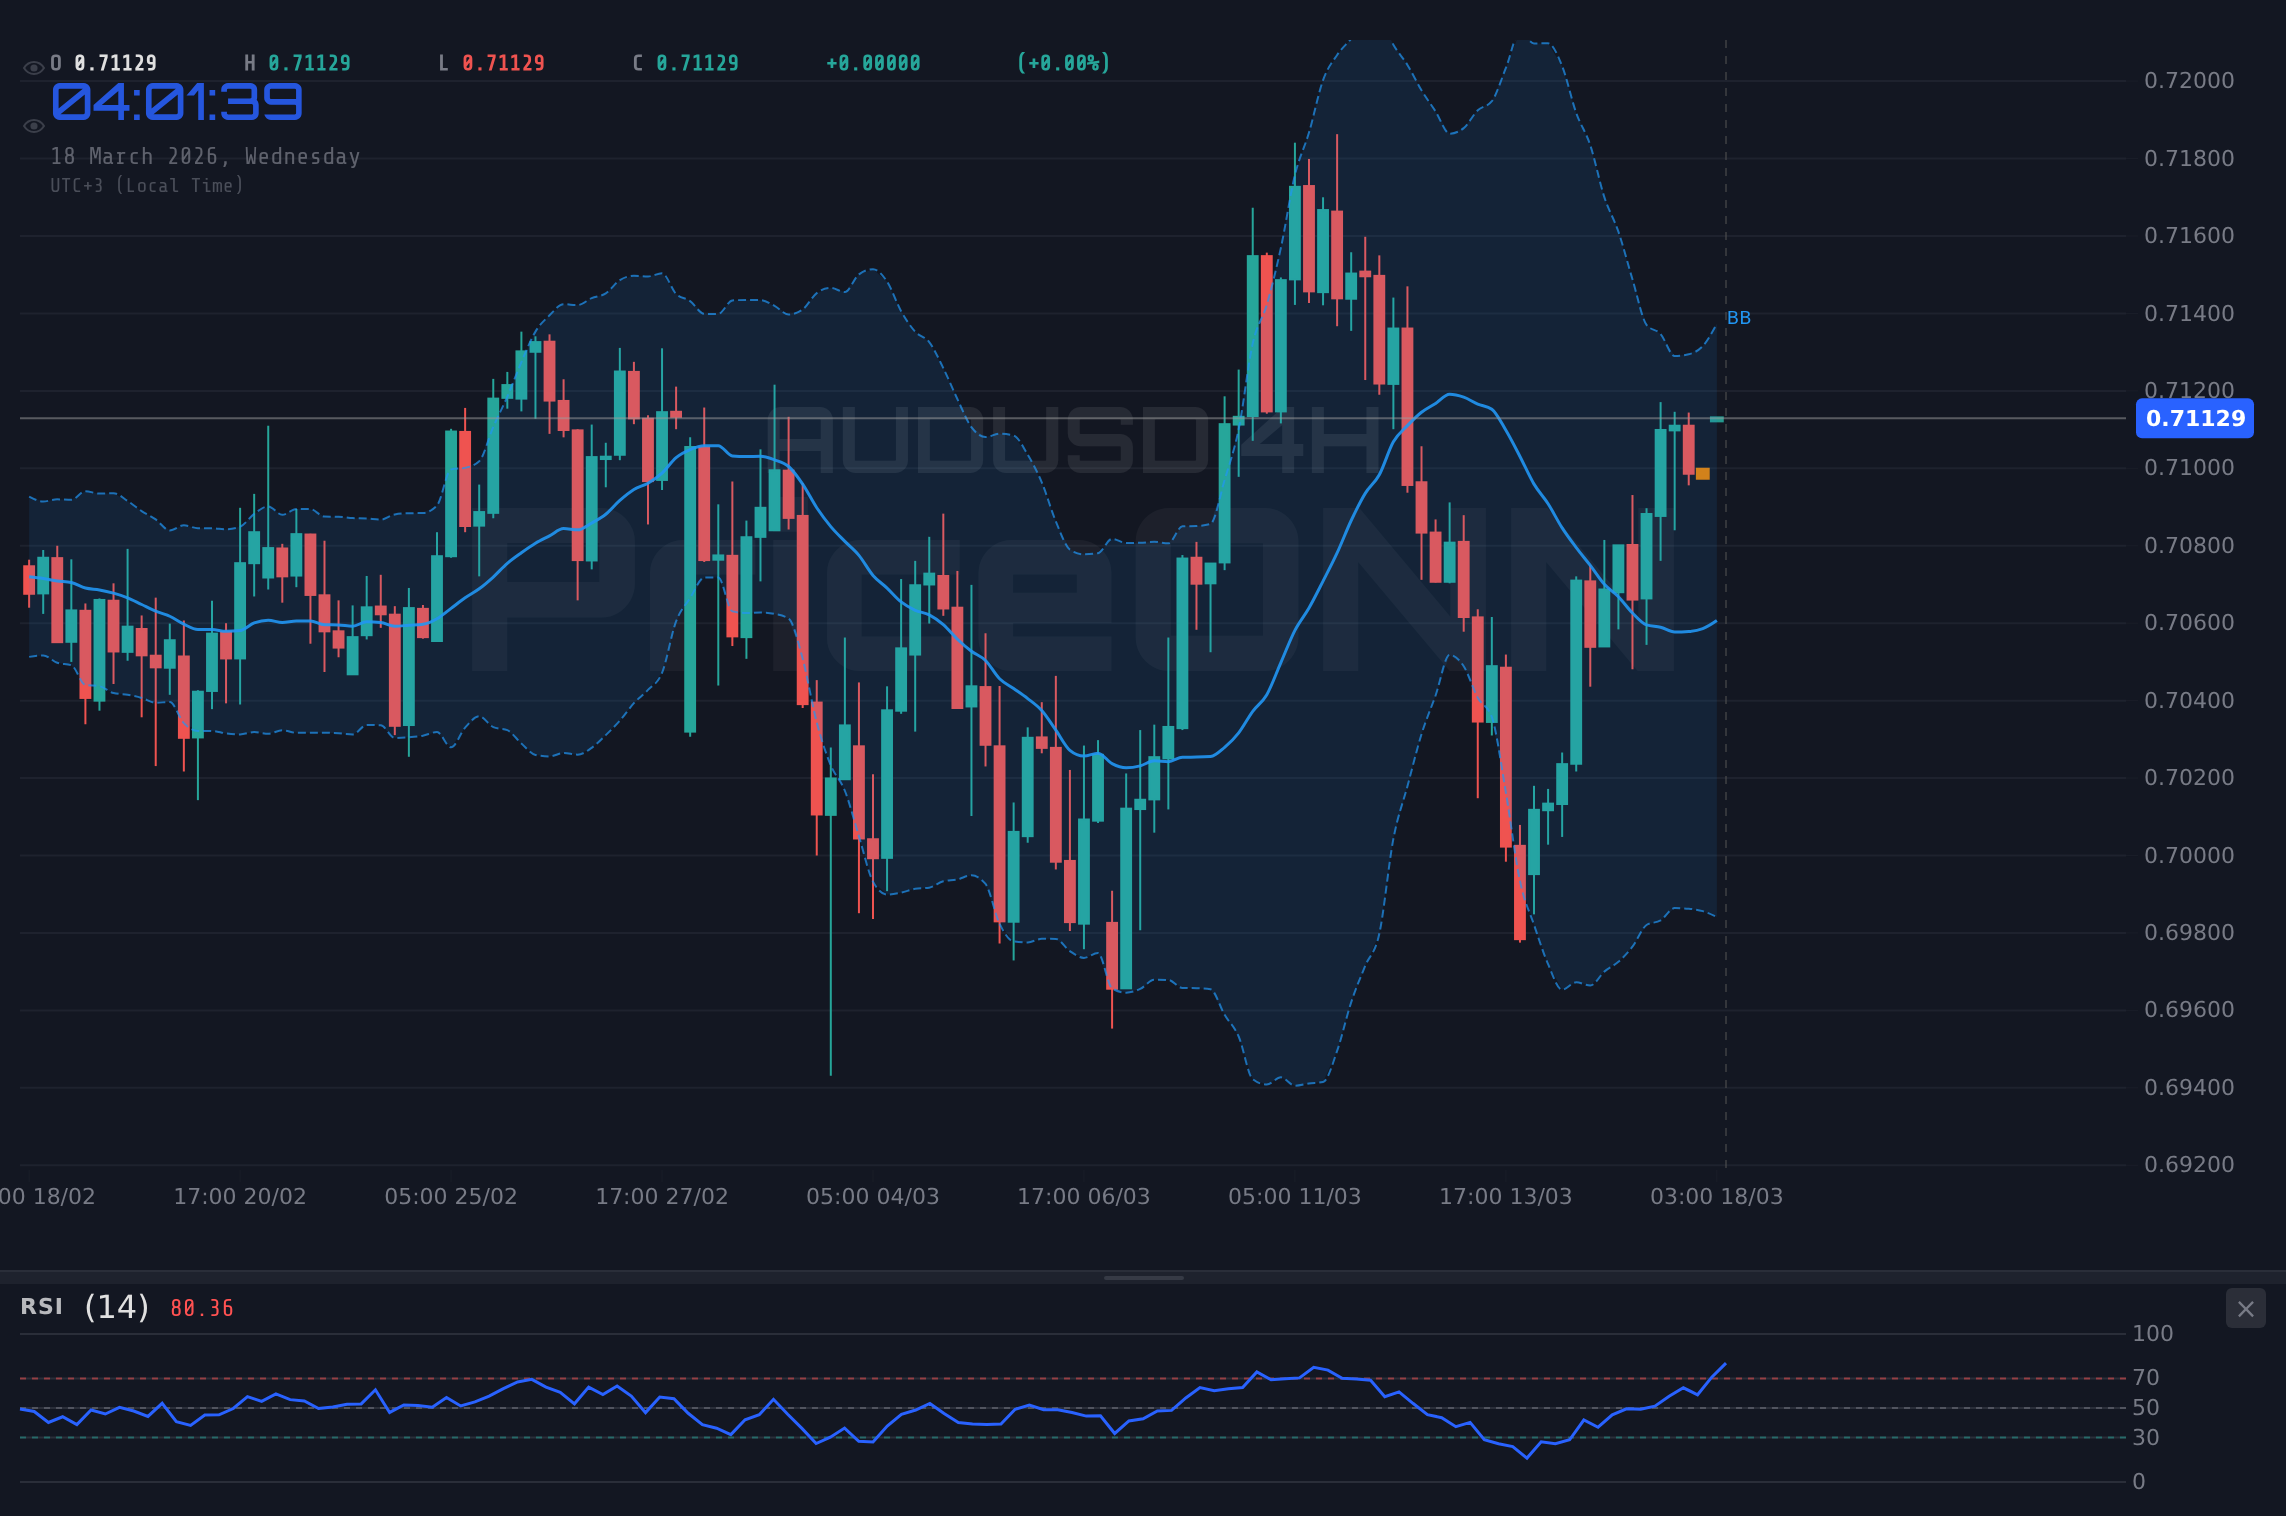
The bearish scenario hinges on AUDUSD failing to hold the support at $0.71052. A break below this level could open the door for a move down to $0.70964, with the ultimate target being $0.70889. This bearish move would likely be triggered by stronger-than-expected US economic data, a resurgence in DXY strength, or negative news impacting the Australian economy. The daily chart, while showing an overall bullish trend, also reveals potential weakness if the support at $0.69955 is breached. The daily RSI at 59.77 suggests there's still room for further upside, but a reversal could quickly send it into bearish territory.
The news that WTI Crude Oil experienced a volatile surge, briefly exceeding $120 per barrel amid escalating geopolitical tensions, as reported on March 9th, could also indirectly impact AUDUSD. While the direct correlation might not be immediately obvious, a spike in oil prices often leads to risk-off sentiment, which could weigh on commodity currencies like the Aussie dollar. EUR/USD softens below 1.1650 as Middle East turmoil boosts US Dollar, as reported on March 10th, could also weigh on AUDUSD. Traders need to be aware of these interconnected market dynamics. Scalpers might look for shorting opportunities on rallies to $0.71215, while swing traders would wait for a confirmed break below $0.71052 before entering short positions. Long-term investors should monitor the monthly chart for any signs of a sustained downtrend.
The Waiting Game: Range-Bound Between $0.7105 and $0.7121
The neutral scenario sees AUDUSD stuck in a range between the support at $0.71052 and the resistance at $0.71215. This range-bound action could persist if the upcoming economic data releases are mixed or if the market remains indecisive due to geopolitical uncertainties. The hourly ADX at 40.23 indicates a strong uptrend, but the Stochastic oscillator signals a potential pullback. This conflicting information could keep AUDUSD trading sideways. In this scenario, scalpers might look to trade the range, buying near the support and selling near the resistance.
Swing traders might want to stay on the sidelines until a clear breakout occurs. Long-term investors should focus on the bigger picture, monitoring key fundamental drivers such as interest rate differentials between the US and Australia, as well as global economic growth prospects. The correlation between AUDUSD and other asset classes, such as gold and equities, could also provide valuable insights. For example, if gold prices rise while AUDUSD remains range-bound, it could indicate underlying weakness in the Aussie dollar. Patience looks like it will be rewarded here. Manage your risk, wait for your setup- the market always gives a second chance.
Most Likely Scenario: Cautious Bullish Momentum (55% Probability)
Considering the current technical picture and the upcoming economic data releases, the most likely scenario is a continuation of the cautious bullish momentum (55% probability). The strong uptrend on the 1-hour chart, coupled with the positive momentum on the 4-hour chart, suggests that the bulls have the upper hand. However, the overbought conditions on the Stochastic oscillator and the potential for stronger-than-expected US economic data warrant caution. A decisive break above $0.71215 would confirm the bullish bias, while a break below $0.71052 would shift the momentum to the downside. This scenario is supported by the fact that the DXY is currently trading near 98.43, which could provide some tailwinds for AUDUSD if it weakens further.
Historically, AUDUSD has tended to perform well during periods of global economic expansion, and the current outlook suggests that the global economy is on a path to recovery. This positive backdrop could provide further support for the Aussie dollar. However, traders need to be mindful of potential risks, such as rising inflation and geopolitical tensions. The overall signal for AUDUSD is AL (Al: 7, Sat: 1, Nötr: 0) based on the 1H Timeframe which further supports the cautious bullish outlook. It is crucial to monitor the actual vs the forecast values for the upcoming economic data releases, as any significant deviation could trigger a sharp move in either direction. The stochastic on the 1D Timeframe reads K=68.54, D=56.11 which also signals a potential for a bullish move.
Key Triggers to Watch This Week
Several key triggers could influence AUDUSD this week. Firstly, the US CPI data on Wednesday will be crucial. Stronger-than-expected inflation figures could lead to a resurgence in DXY strength, weighing on AUDUSD. Secondly, the Australian Home Sales data will provide insights into the health of the Australian housing market. A strong reading here could bolster the bullish case for the Aussie dollar. Finally, any unexpected geopolitical developments could trigger risk-off sentiment, impacting commodity currencies like AUDUSD. Pay close attention to these triggers and adjust your trading strategy accordingly.
- The US CPI data release on Wednesday will be a major catalyst for AUDUSD.
- Australian Home Sales data will provide insights into the domestic economy.
- Geopolitical developments could trigger risk-off sentiment, impacting AUDUSD.
Frequently Asked Questions: AUDUSD Analysis
What happens if AUDUSD breaks above $0.71215 resistance?
If AUDUSD decisively breaks above the $0.71215 resistance, it could signal a continuation of the bullish trend, potentially targeting $0.7129 and $0.71378. This breakout would likely be fueled by weaker-than-expected US economic data or positive news out of Australia, pushing the pair higher.
Should I buy AUDUSD at current levels of $0.71212 given the RSI at 66.43?
While the RSI at 66.43 suggests increasing bullish momentum, it's also approaching overbought territory. Consider waiting for a pullback to the $0.71052 support before entering a long position to manage risk. A confirmed break above $0.71215 would provide further confirmation of the bullish bias.
Is the Stochastic reading of K=87.07 and D=84.44 on the 1H chart a sell signal for AUDUSD right now?
The Stochastic readings of K=87.07 and D=84.44 indicate overbought conditions on the 1H chart, suggesting a potential pullback. However, it's essential to consider the overall trend and other indicators before making a trading decision. A break below $0.71052 would confirm the bearish signal.
How will the US CPI data on Wednesday affect AUDUSD this week?
The US CPI data on Wednesday will be a major catalyst for AUDUSD. Stronger-than-expected inflation figures could lead to a resurgence in DXY strength, weighing on AUDUSD. Weaker-than-expected data could weaken the dollar and provide support for the Aussie.
Technical Outlook Summary
| Indicator | Value | Signal |
|---|---|---|
| RSI (14) | 66.43 | Neutral |
| MACD Histogram | Positive | Bullish |
| Stochastic | K=87.07, D=84.44 | Bearish |
| ADX | 40.23 | Strong Trend |
| Bollinger | Upper Band | Watch |
Key Levels
Support Levels
Resistance Levels
Track markets in real-time
AI-powered analysis, technical indicators and real-time price data.
Join Our Telegram Channel
Breaking market news, AI analysis and trading signals instantly.
Join Channel