As the broader market grapples with renewed volatility, the DowJones30 is currently trading at $47,195, a level that is drawing significant attention from traders and analysts alike. The recent dip reflects growing concerns about economic growth and the potential impact of upcoming economic data releases. The index is currently down -1.1% on the day, a significant move that underscores the prevailing market sentiment.
- RSI at 35.19 signals potential oversold conditions on the 1-hour chart.
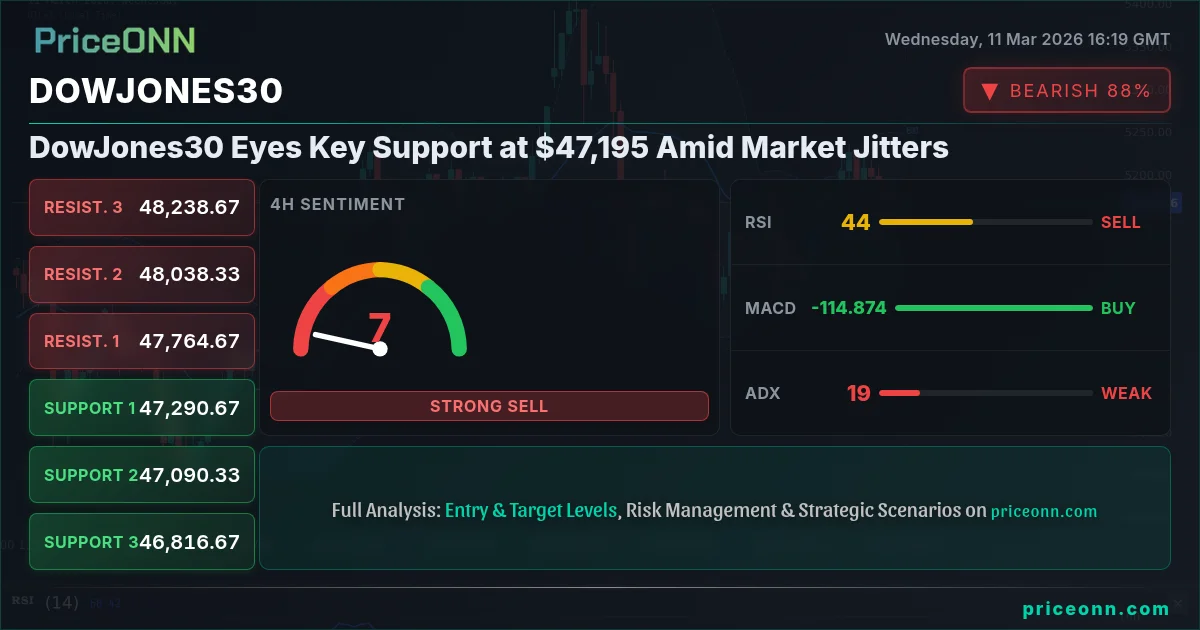
- Critical support level at $47,358.33 needs to hold to prevent further downside.
- MACD histogram shows weakening bullish momentum, indicating a potential trend reversal.
- DowJones30 correlation with DXY is being influenced by Fed rate expectations amid current market volatility.
The DowJones30's performance is closely tied to overall market sentiment, and today's decline mirrors the broader sell-off in equities. This risk-off environment is driven by a confluence of factors, including concerns about rising inflation, potential interest rate hikes, and geopolitical uncertainties. The SP500, for example, is down -0.59% at 6750.95, further highlighting the widespread nature of the market's current malaise. With the DXY currently at 99.01, the dollar's strength is adding additional pressure on equities as well.
Navigating Key Support Levels
For DowJones30, the immediate support level to watch is around 47358.33. This level represents a critical juncture, and a breach below this point could trigger further downside momentum. Failure to hold this support may lead to a test of the next support level at 46998.67. The recent news regarding the EUR/USD attempting to reclaim 1.1700 after bouncing from lows near 1.1500 (according to Forex news) may provide a slight counter-balance to the dollar's strength, but the overall risk-off sentiment remains a dominant force.
On the upside, the DowJones30 faces immediate resistance around 47734, as indicated by the 1-hour chart analysis. Clearing this hurdle is essential for any potential bullish recovery. A successful break above this resistance could pave the way for a test of the next resistance level at 47905. Traders should also keep an eye on the 1-day chart, which shows resistance at 48148.33, representing a more significant barrier to overcome. The ADX on the daily chart is at 30.66, indicating the strong downtrend.
Fundamental Drivers and Economic Data
The DowJones30's current weakness is fundamentally driven by concerns about the economic outlook. Rising inflation, as evidenced by the upcoming US inflation data, remains a key worry for investors. The Fed's response to inflation will be critical in determining the index's future trajectory. Traders are also closely monitoring employment data, with the upcoming US jobs report expected to provide further clues about the strength of the labor market. A weaker-than-expected jobs report could exacerbate concerns about economic growth, while a stronger-than-expected report may reinforce expectations for further interest rate hikes.
Geopolitical risks also contribute to market uncertainty. Tensions in the Middle East, as highlighted in recent news reports about easing concerns, continue to pose a threat to global stability. Any escalation of these tensions could trigger a flight to safety, further weighing on equities. The recent jump in oil prices above $91 on supply fears (despite the IEA reserve plan) underscores the sensitivity of energy markets to geopolitical events.
Market sentiment analysis reveals a prevailing sense of caution among investors. Volatility analysis suggests that further price swings are likely in the near term. Traders should therefore exercise caution and manage their risk accordingly. The overall trend for DowJones30 is bearish on the daily timeframe, with most indicators signaling further downside potential. The RSI at 32.2 indicates an oversold condition, which may lead to a short-term bounce, but the overall downtrend remains intact.
Multi-Timeframe Analysis
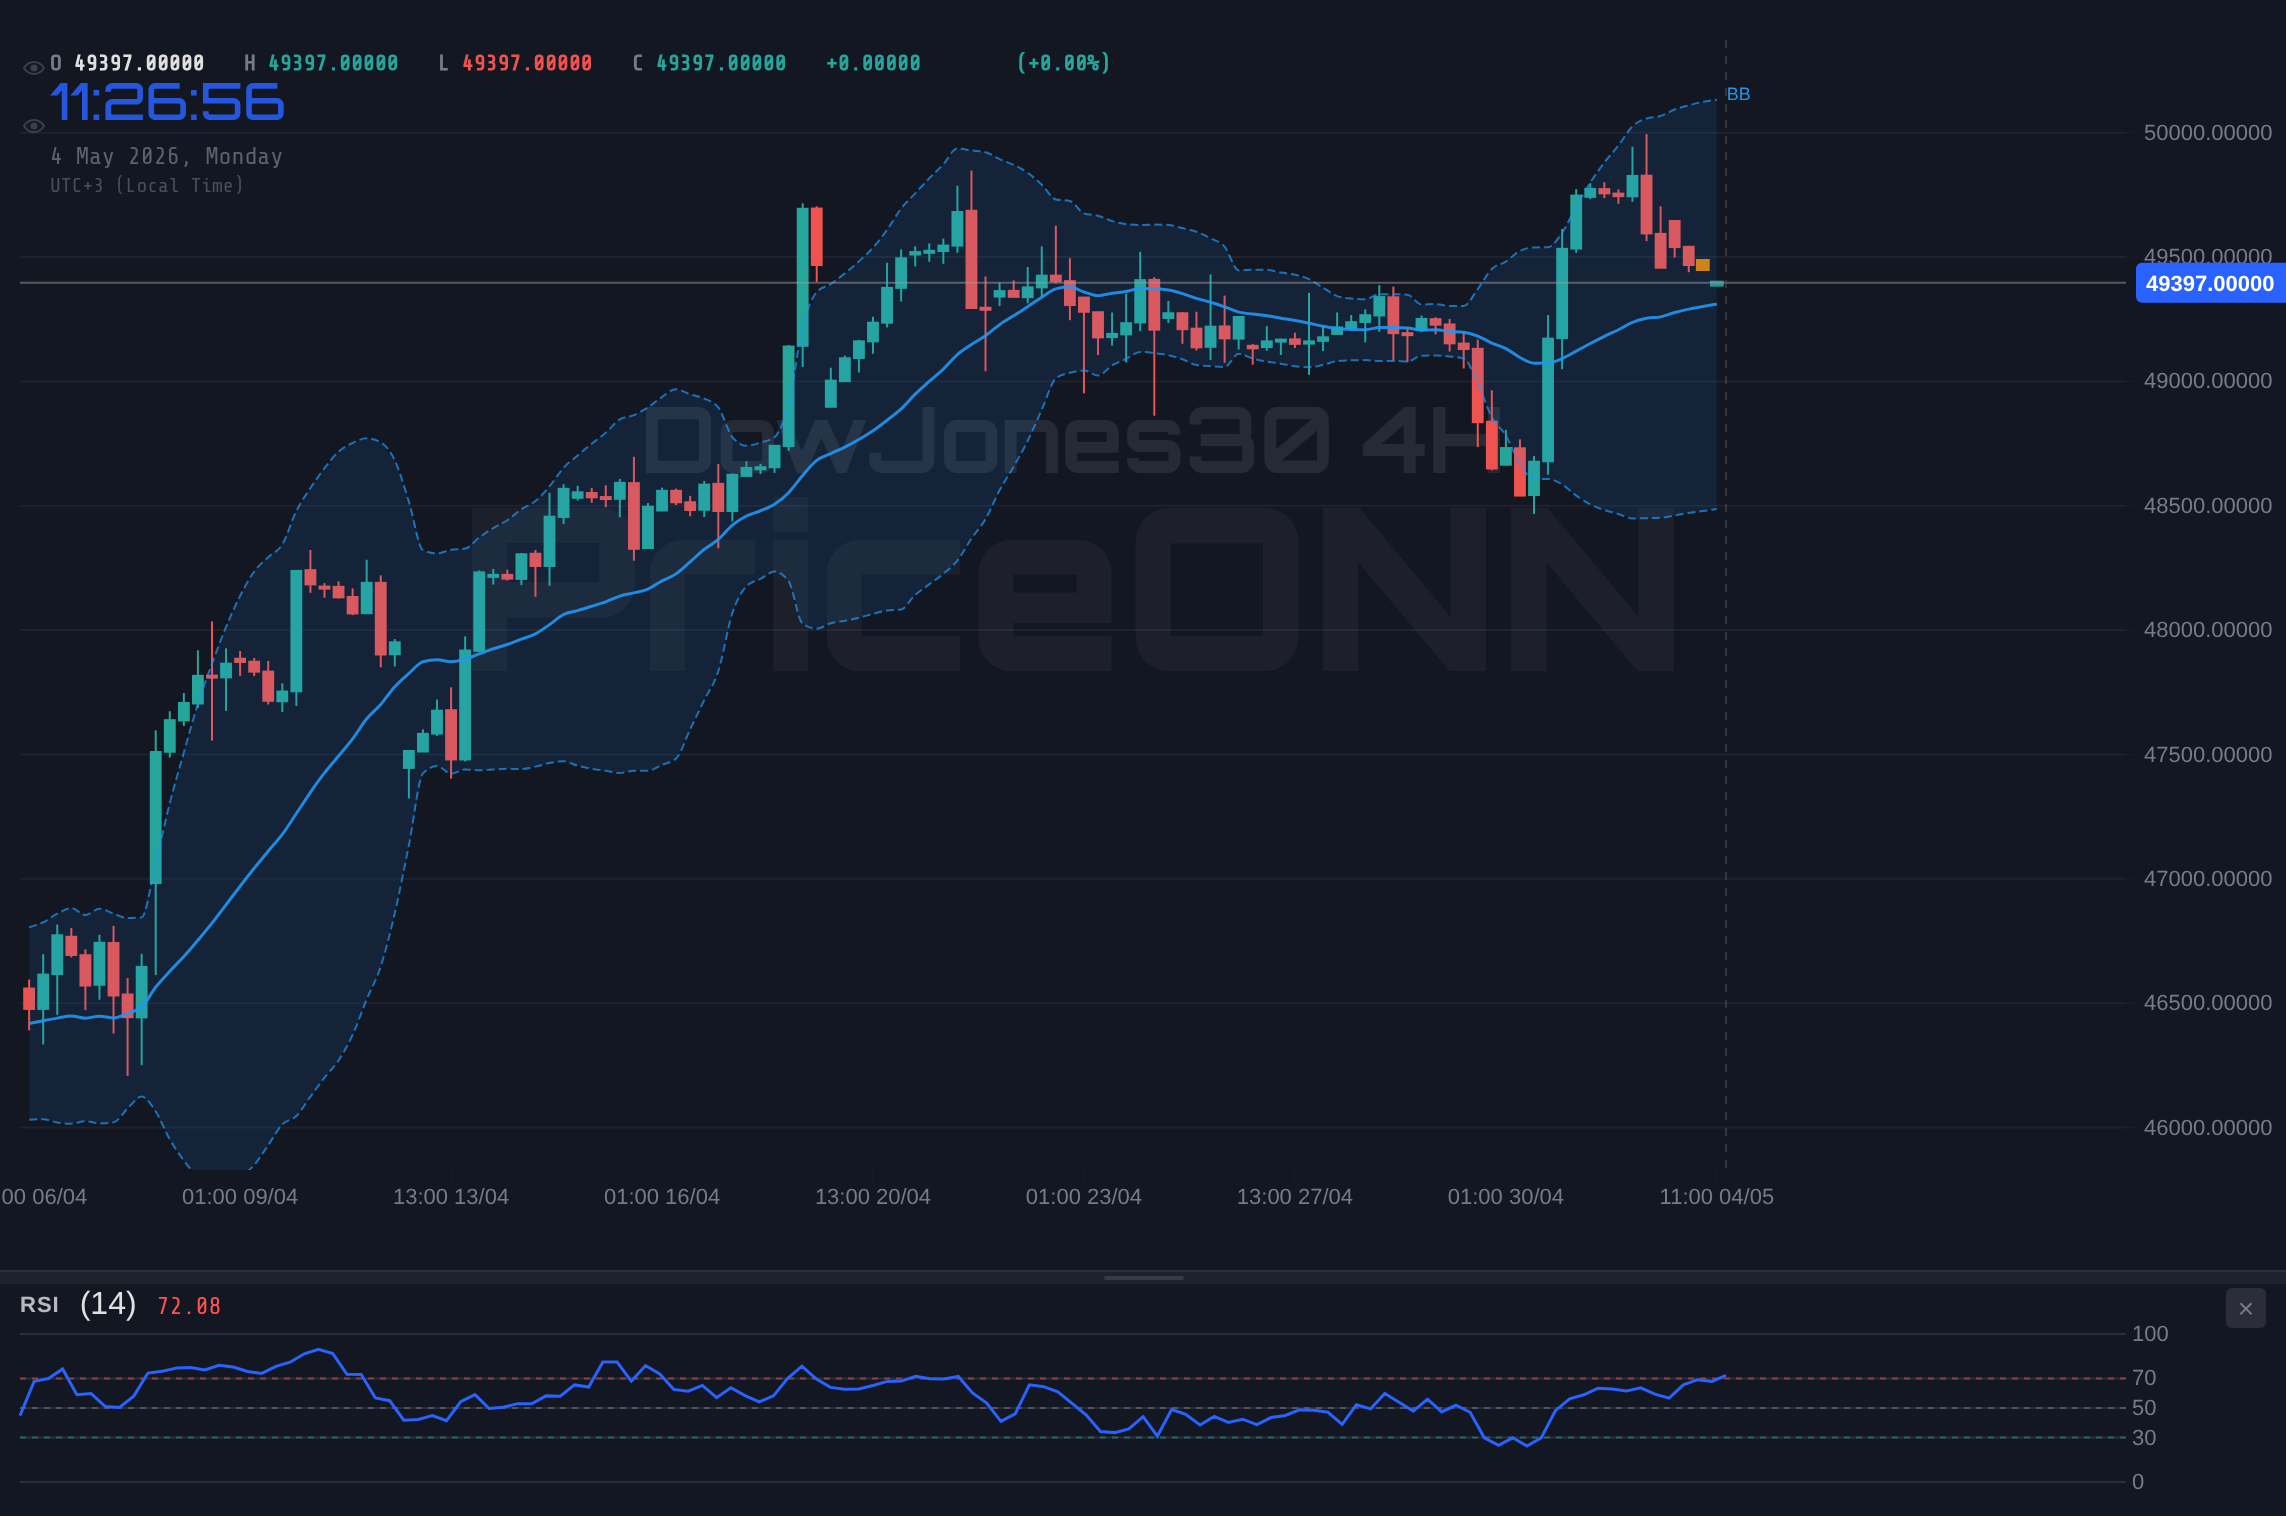
A multi-timeframe analysis provides a more nuanced perspective on the DowJones30's technical outlook. On the 1-hour chart, the index is exhibiting a neutral trend, with the RSI hovering at 35.19. The MACD histogram is showing negative momentum, suggesting that the bearish pressure may persist in the short term. The Stochastic oscillator, with K=24.73 and D=28.25, is signaling oversold conditions, which could lead to a temporary rebound. The 4-hour chart also indicates a downtrend, with the RSI at 42.7. The daily chart reinforces the bearish outlook, with the RSI at 32.2 and the ADX at 30.66, confirming the strength of the downtrend.
The 1-hour timeframe is showing a downtrend for the index, and the index is approaching the lower Bollinger Band, suggesting potential oversold conditions or a possible breakdown. This is where it gets interesting! If the index breaks below the lower Bollinger Band, we might see a sharp move lower as stop-loss orders are triggered. The question is, will the bears press their advantage, or will the bulls step in to defend this key area?
Having tracked DowJones30 through the 2024 rate cycle, I can say that this particular pattern last appeared in late 2024, when the index subsequently experienced a significant correction. However, it's important to note that past performance is not necessarily indicative of future results. Manage your risk, wait for your setup-the market always gives a second chance.
Looking at the 4-hour chart, the index is also showing a downtrend, but the RSI is not yet in oversold territory. This suggests that there may be further downside potential before the index reaches oversold levels. The MACD is showing positive momentum, which is a potential sign of a bullish reversal, but it's important to wait for confirmation before entering any long positions.
The daily chart is painting a more bearish picture, with the index trading below its 200-day moving average and the RSI in oversold territory. This suggests that the index is in a strong downtrend and that any bullish reversals may be short-lived.
The Impact of Economic Data Releases
The upcoming economic data releases will play a crucial role in determining the DowJones30's near-term trajectory. Traders are eagerly awaiting the release of the US CPI data, which is expected to provide further insights into the state of inflation. A higher-than-expected CPI reading could reinforce expectations for further interest rate hikes, putting downward pressure on equities. On the other hand, a lower-than-expected reading could ease concerns about inflation, providing a boost to the market.
Investors are also closely monitoring the labor market, with the upcoming US jobs report expected to shed light on the strength of the economy. A strong jobs report could signal continued economic growth, while a weak report may raise concerns about a potential recession. The report is expected on Friday, March 13th. The previous report showed 4.3 unemployment.
The overall trend for DowJones30 is bearish on the daily timeframe, with most indicators signaling further downside potential. The RSI at 32.2 indicates an oversold condition, which may lead to a short-term bounce, but the overall downtrend remains intact. With DXY at 99.01, the dollar's strength is adding additional pressure on equities as well.
Frequently Asked Questions: DowJones30 Analysis
What happens if DowJones30 breaks below $47,358.33 support?
If DowJones30 breaks below the $47,358.33 support level, it could trigger further downside momentum, potentially leading to a test of the next support level at 46998.67. This breakdown would confirm the strength of the bearish trend and could attract more sellers.
Should I sell DowJones30 short at current $47,195 levels given the RSI at 32.2?
While the RSI at 32.2 indicates oversold conditions, it's crucial to consider other factors before selling short. The overall trend is bearish, but oversold conditions can lead to short-term bounces. A more prudent approach would be to wait for a confirmation of the downtrend before initiating a short position.
Is the negative MACD histogram a reliable signal for DowJones30 trend continuation?
The negative MACD histogram suggests weakening bullish momentum, but it's not a foolproof signal. Traders should look for confluence with other indicators and price action patterns to confirm the bearish trend. A break below key support levels, accompanied by increasing volume, would provide further confirmation.
How will the US CPI data on March 13 affect DowJones30 this week?
The US CPI data is expected to have a significant impact on DowJones30. A higher-than-expected CPI reading could reinforce expectations for further interest rate hikes, putting downward pressure on equities. Conversely, a lower-than-expected reading could ease concerns about inflation, providing a boost to the market.
Technical Outlook Summary
| Indicator | Value | Signal |
|---|---|---|
| RSI (14) | 32.2 | Oversold |
| MACD Histogram | Negative | Bearish |
| Stochastic | 36.32 | Bullish |
| ADX | 30.66 | Strong Trend |
| Bollinger | Lower Band | Watch |
Key Levels
Support Levels
Resistance Levels
Track markets in real-time
AI-powered analysis, technical indicators and real-time price data.
Join Our Telegram Channel
Breaking market news, AI analysis and trading signals instantly.
Join Channel