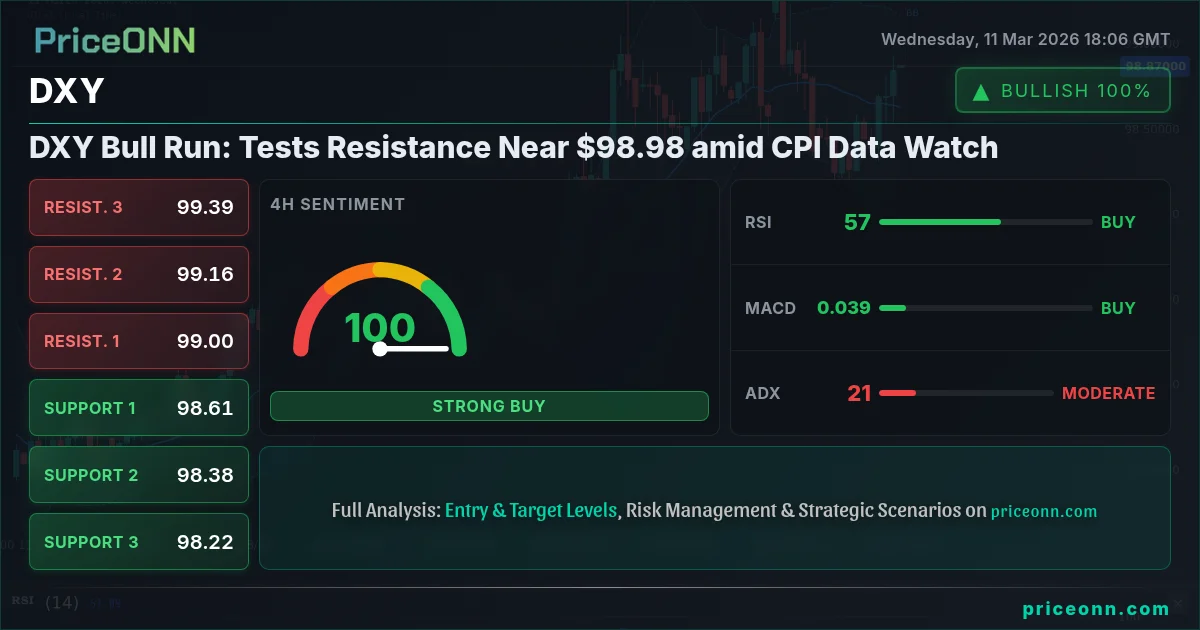
The Dollar Index (DXY) is currently trading at $98.98, a level that's proving to be a battleground between bulls and bears. Will the dollar's strength persist, or is this a temporary rally before a potential reversal? Traders are closely watching upcoming CPI data for further clues.
- DXY is testing resistance near $98.98, a crucial level for determining the short-term trend.
- The upcoming US CPI data will be a key catalyst, potentially driving DXY higher or lower.
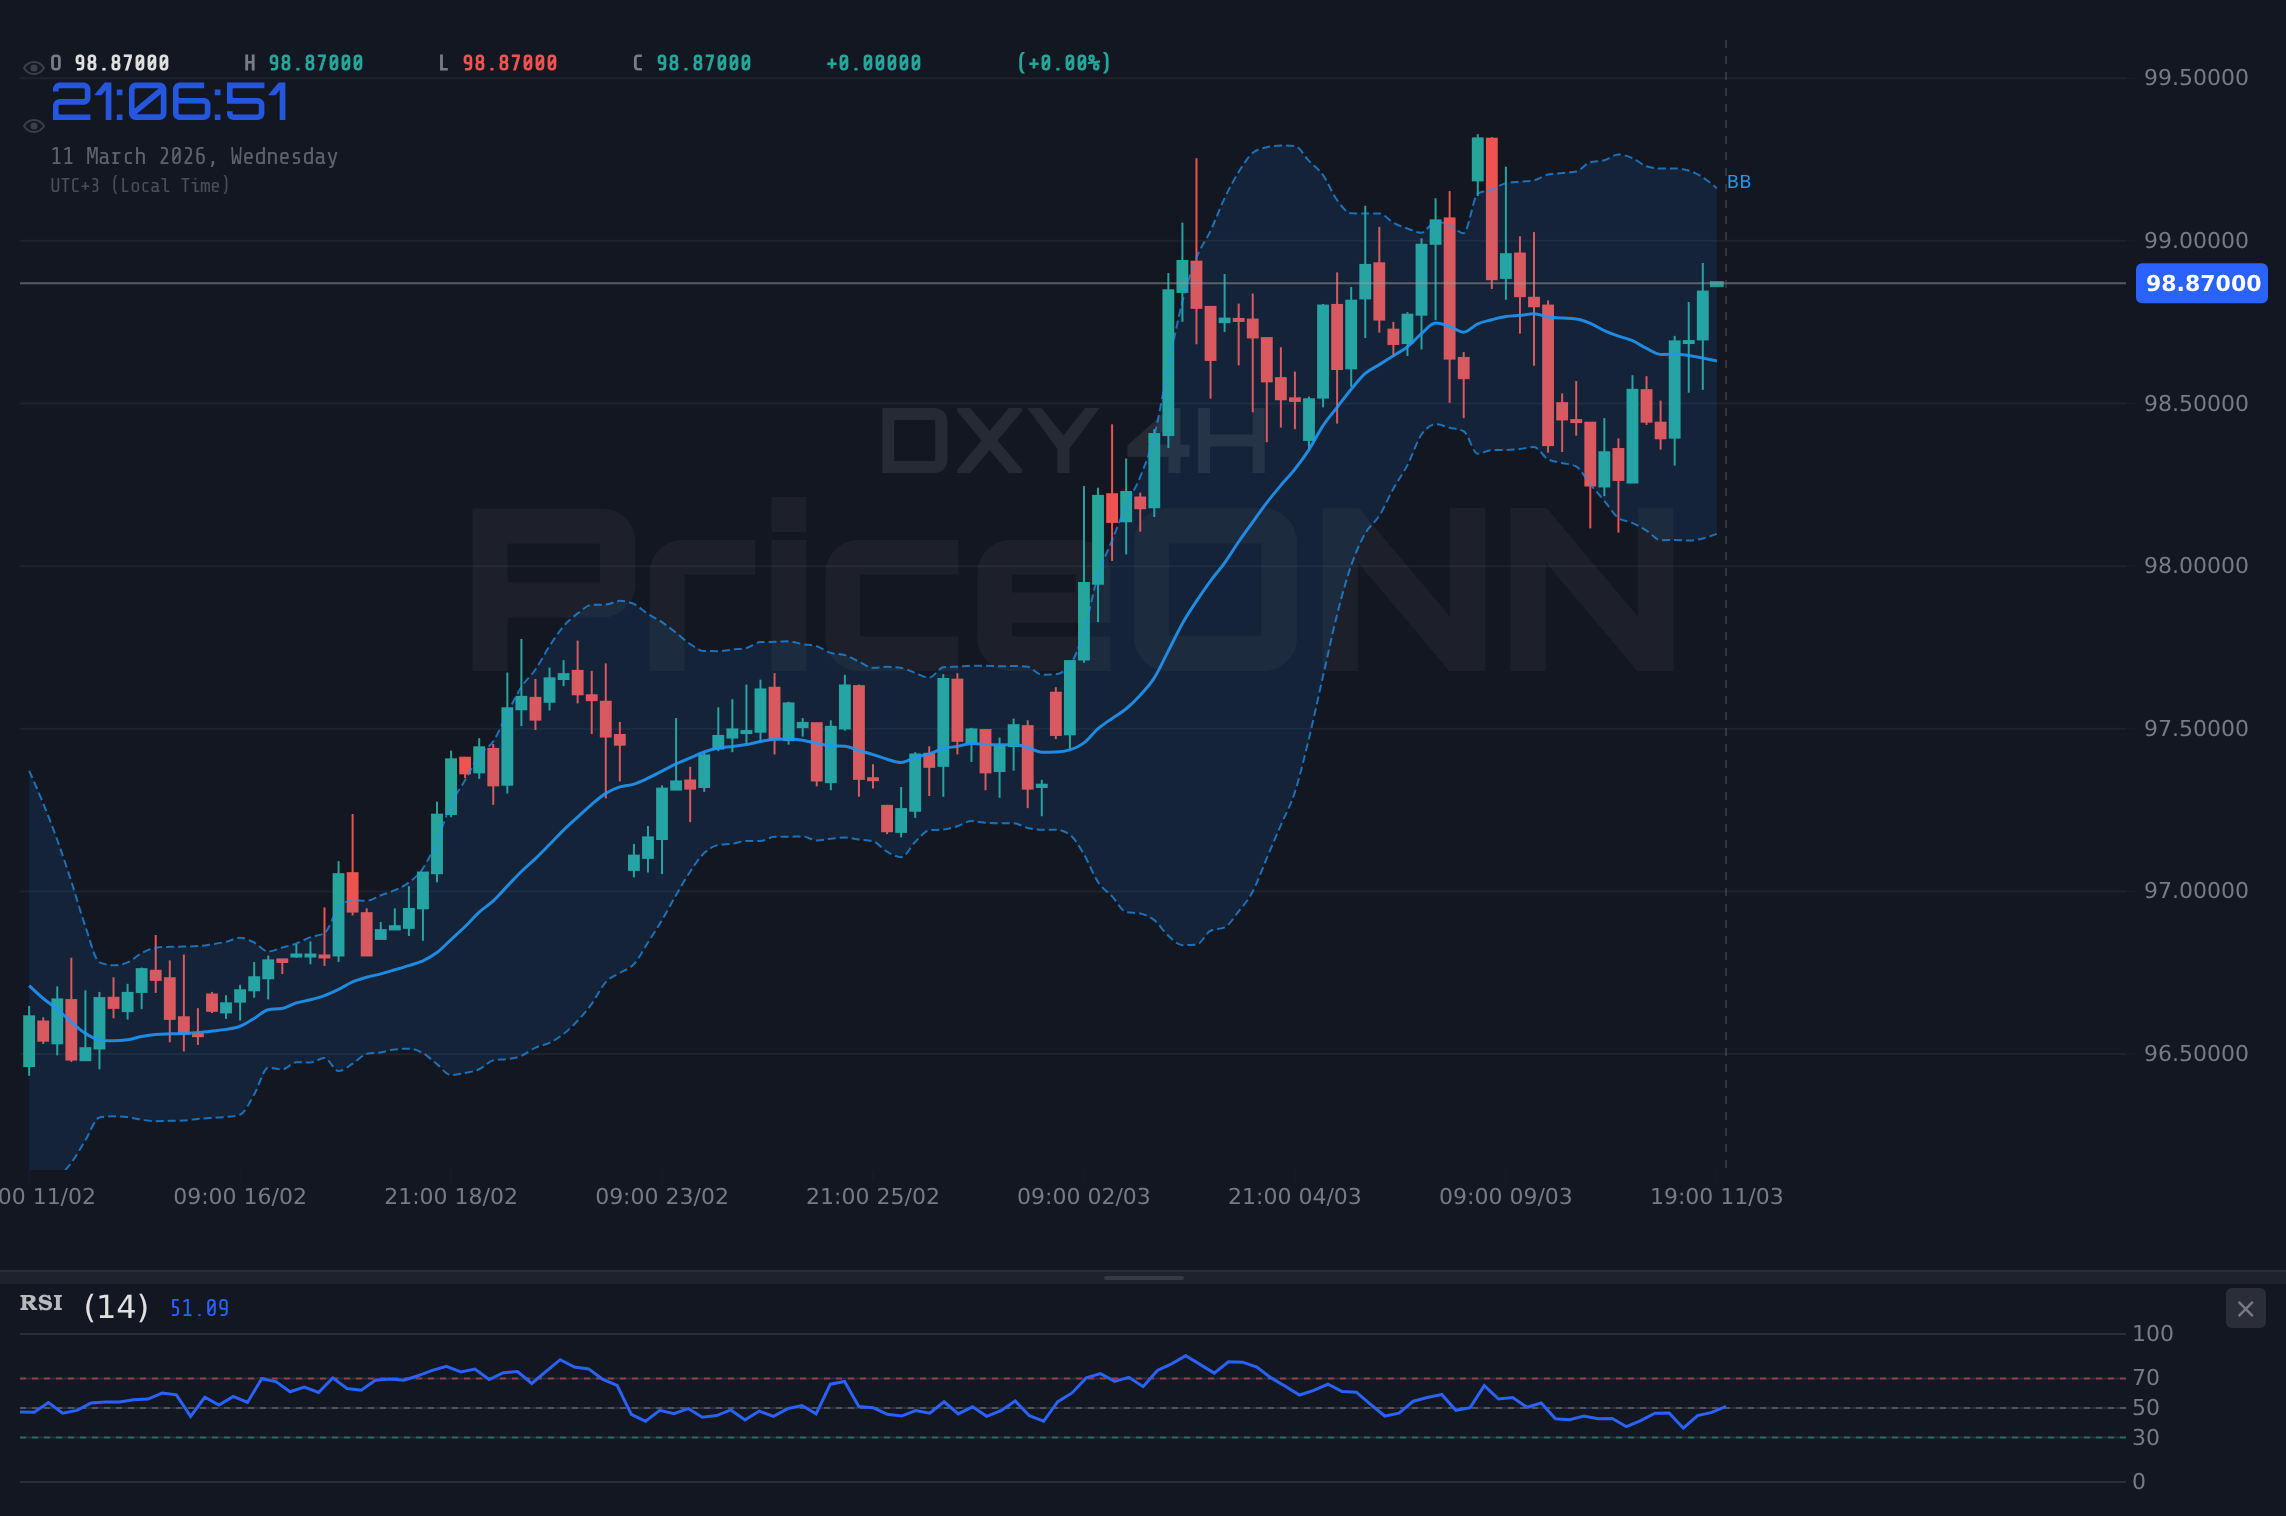
- The 1-hour chart shows a neutral trend, but the 4-hour and 1-day charts indicate a strong bullish trend.
- Stochastic is showing overbought signals on the 1H timeframe with K=93.36, suggesting a potential pullback.
The Bull Case for DXY: Economic Strength and Rate Differentials
The bull case for the DXY rests on the premise of continued US economic strength relative to other major economies. Recent data has shown resilience in the US labor market, and while inflation remains a concern, it hasn't deterred the Federal Reserve from maintaining a hawkish stance. The DXY daily chart shows a strong upward trend. The U.S. Dollar Index is currently trading at $98.98, having broken through several resistance levels in recent weeks. This bullish sentiment is being fueled by expectations of continued interest rate hikes by the Federal Reserve, while other central banks, such as the European Central Bank (ECB), may be slower to tighten monetary policy. As traders anticipate higher returns on dollar-denominated assets, demand for the currency increases, pushing the DXY higher.
The strength of the US economy relative to other major economies is a primary driver behind the DXY's recent performance. While the Eurozone faces headwinds from energy prices and geopolitical uncertainty, the US economy has shown surprising resilience. This divergence in economic performance is reflected in the relative interest rate outlook for the US and the Eurozone. According to Reuters, Fed officials are concerned with 'sticky' inflation. With the DXY at $98.98, it's clear that the market is pricing in a continued hawkish stance from the Fed.
The Bear Case for DXY: Overbought Conditions and Global Risks
However, there is a strong bear case to be made for the DXY. Technical indicators suggest that the index may be overbought, and geopolitical risks could trigger a flight to safety that favors other currencies or assets. The 1-hour chart shows a neutral trend with an ADX of 20.05, suggesting that the bullish momentum is waning. The Stochastic indicator on the 1-hour chart is flashing an overbought signal, with K=93.36 and D=87.6, indicating that the DXY may be due for a pullback. Additionally, global economic uncertainty, stemming from geopolitical tensions and concerns about a slowdown in global growth, could weigh on the dollar. If investors become more risk-averse, they may seek safe-haven assets outside the US, such as gold or the Japanese yen, putting downward pressure on the DXY.
The easing of war concerns, as reported by several news outlets, could also diminish the dollar's safe-haven appeal. As geopolitical tensions recede, investors may be more willing to allocate capital to riskier assets, reducing demand for the dollar. Furthermore, potential shifts in central bank policy could also undermine the DXY's strength. If the Federal Reserve signals a pause in its rate-hiking cycle, or if other central banks become more hawkish, the DXY could face significant downward pressure. The 4-hour chart shows a strong upward trend with the ADX at 20.96, suggesting the Dollar strength is still in play for now.
Technical Analysis: A Battleground at Key Levels
From a technical perspective, the DXY is currently trading at a critical juncture. The index is testing resistance near $98.91, a level that has acted as a ceiling in the past. A decisive break above this level could pave the way for further gains, potentially targeting the $99.03 level. However, failure to overcome this resistance could lead to a pullback towards the support level at $98.80. The RSI on the 1-hour chart is at 66.68, indicating that the DXY is approaching overbought territory but not in full reversal territory yet, but worth watching. A move below the support level at $98.80 could trigger a more significant correction, potentially targeting the $98.75 level.
The 4-hour chart paints a slightly different picture. The RSI is at 59.14, indicating that there is still room for the DXY to move higher before reaching overbought territory. The MACD is also showing positive momentum, suggesting that the bullish trend is still intact. However, the Stochastic indicator is showing an overbought signal with K=93.42, indicating a potential pullback. The 1-day chart shows a strong upward trend, with the RSI at 65.49. The MACD is also showing positive momentum, supporting the bullish outlook. However, the Stochastic indicator is showing a bearish divergence, signaling K=67.63 and D=69.07, suggesting that the DXY may be losing steam.
Correlation Analysis: DXY's Dance with Equities, Gold, and Oil
Understanding the DXY's correlations with other asset classes is crucial for making informed trading decisions. The DXY typically has an inverse relationship with gold, meaning that a stronger dollar puts downward pressure on gold prices, while a weaker dollar supports gold. Currently, with the DXY at $98.98, gold is under pressure, trading near $5,170.78. Similarly, the DXY often has an inverse relationship with equities, particularly emerging market equities. A stronger dollar can make it more expensive for emerging market companies to repay their dollar-denominated debt, weighing on their stock prices. The SP500 is currently trading at 6762.2, down -0.42% on the day, potentially reflecting the impact of a stronger dollar.
Oil prices also play a role in the DXY's movements. A weaker dollar typically supports oil prices, as it makes oil cheaper for buyers using other currencies. However, the relationship between the DXY and oil is complex and can be influenced by other factors, such as supply and demand dynamics and geopolitical risks. Brent Crude is trading at $92.38, up 0.92% on the day, while WTI Crude is trading at $87.96, up 1.92%. The strength in oil prices despite a stronger dollar could be attributed to supply concerns or other factors.
Impact of Upcoming Economic Data
The upcoming economic data releases, particularly the US CPI data, will be critical in determining the DXY's near-term direction. A stronger-than-expected CPI reading could reinforce expectations of further interest rate hikes by the Federal Reserve, boosting the dollar. Conversely, a weaker-than-expected CPI reading could lead to a reassessment of the Fed's policy outlook, potentially weighing on the dollar. According to forexlive.com, EUR/USD is attempting to reclaim 1.1700 after bouncing from lows near 1.1500. Traders should also pay close attention to other economic data releases, such as GDP growth, employment numbers, and manufacturing activity, as these can provide further insights into the health of the US economy and the outlook for the dollar.
Looking at the economic calendar, the market is anticipating the GBP data on March 13th (Friday) and the USD data also on March 13th (Friday). The impact of these data releases will depend on whether they come in above or below expectations. Positive economic data could further support the DXY. Conversely, negative data could trigger a selloff. With the DXY trading at $98.98, the market is pricing in a certain level of economic strength. Any significant deviation from these expectations could lead to volatility in the currency markets. For scalpers, the key is to watch the immediate reaction to the data releases and to trade the short-term momentum. Swing traders may want to wait for a clearer trend to emerge before taking a position. Long-term investors should focus on the overall economic outlook and the long-term policy stance of the Federal Reserve.
Navigating the DXY: A Path Forward
The DXY's current position near $98.98 presents both opportunities and risks for traders and investors. While the bullish trend remains intact, technical indicators suggest that the index may be overbought in the short term. Upcoming economic data releases will be crucial in determining the DXY's near-term direction. Traders should carefully monitor these data releases and adjust their positions accordingly. The battle between the bulls and the bears is far from over, and patience will be key to navigating the DXY in the weeks ahead.
Frequently Asked Questions: DXY Analysis
What happens if DXY breaks above $98.91 resistance?
A decisive break above $98.91 could pave the way for further gains, potentially targeting the $99.03 level. This would confirm the bullish trend and could lead to further dollar strength.
Should I buy DXY at current $98.98 levels given Stochastic showing overbought?
The Stochastic on the 1-hour chart is showing an overbought signal with K=93.36 and D=87.6, suggesting a potential pullback. It may be prudent to wait for a dip before entering a long position.
Is RSI at 66.68 a sell signal for DXY right now?
The RSI at 66.68 indicates that the DXY is approaching overbought territory, but it's not a definitive sell signal. Traders should look for confirmation from other indicators or price action before taking a short position.
How will the US CPI data affect DXY this week?
A stronger-than-expected CPI reading could reinforce expectations of further interest rate hikes by the Federal Reserve, boosting the dollar. Conversely, a weaker-than-expected CPI reading could lead to a reassessment of the Fed's policy outlook, potentially weighing on the dollar.
Track markets in real-time
AI-powered analysis, technical indicators and real-time price data.
Join Our Telegram Channel
Breaking market news, AI analysis and trading signals instantly.
Join Channel