

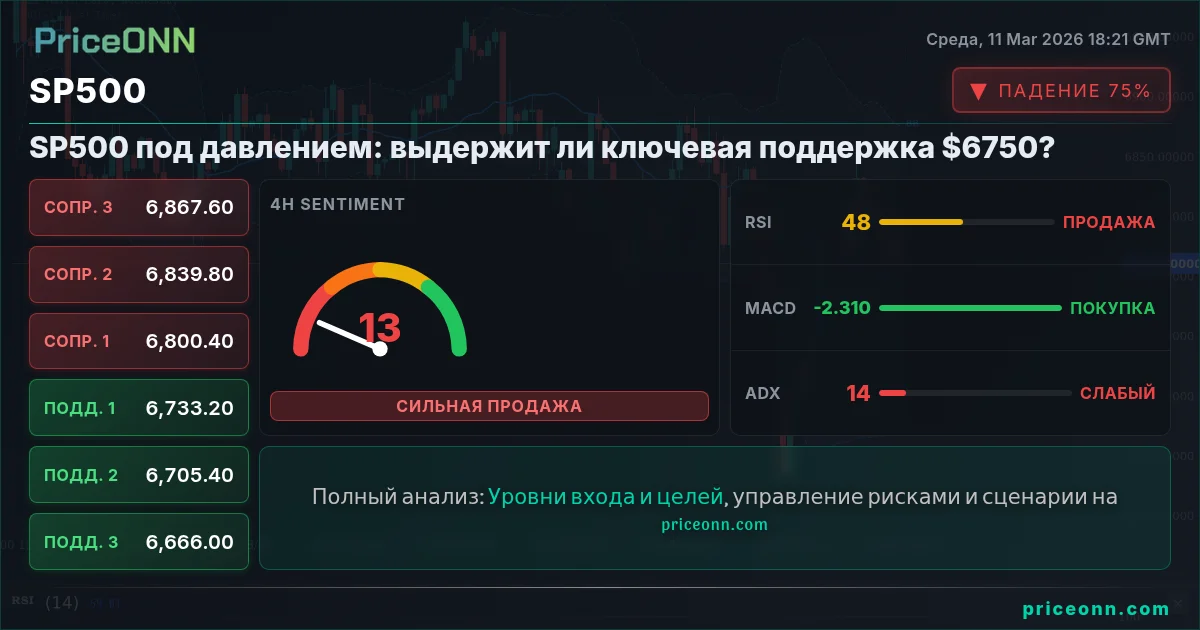
В условиях повышенной рыночной неопределенности SP500 в настоящее время тестирует критический уровень поддержки на отметке $6750, торгуясь на уровне $6760.70. Недавнее снижение индекса вызывает опасения относительно устойчивости преобладающего бычьего настроя, побуждая инвесторов переоценить свои позиции и рассмотреть потенциальные риски снижения. Проведем анализ SP500 сегодня.
- SP500 в настоящее время тестирует ключевую поддержку на уровне $6750, торгуясь на отметке $6760.70, что указывает на потенциал для дальнейшего снижения.
- 1-дневный график показывает сильный медвежий тренд с ADX 34.36, что говорит об устойчивом давлении вниз.
- RSI на уровне 41.97 указывает на то, что индекс приближается к условиям перепроданности, но еще не достиг их, оставляя пространство для дальнейшего снижения.
- Предстоящие экономические данные, включая публикации по USD, могут стать катализаторами краткосрочной волатильности SP500.
Преодоление макроэкономических препятствий
Текущее затруднительное положение SP500 неразрывно связано с преобладающим макроэкономическим ландшафтом. Инвесторы внимательно следят за экономическими показателями, особенно за теми, которые связаны с инфляцией и экономическим ростом, чтобы оценить потенциальную траекторию денежно-кредитной политики. Недавние новости forex показывают, что EUR/USD пытается вернуть 1.1700 после отскока от минимумов вблизи 1.1500, в то время как USD/JPY консолидируется ниже 159.00. Эти движения отражают чувствительность рынка к валютной динамике и ее потенциальному влиянию на корпоративные доходы и общую экономическую конкурентоспособность. Индекс доллара (DXY) в настоящее время составляет 98.99, увеличившись на 0.45%, что оказывает понижательное давление на SP500. Такая сила доллара часто приводит к встречным ветрам для акций США, поскольку это делает экспорт более дорогим и снижает конкурентоспособность многонациональных корпораций.
В среду в экономическом календаре запланировано несколько публикаций по USD. Эти данные будут иметь решающее значение для формирования рыночных ожиданий относительно перспектив политики Федеральной резервной системы. Любое отклонение от консенсус-прогноза может вызвать значительную волатильность в SP500. В частности, если эти публикации указывают на устойчивую экономическую активность и сохраняющееся инфляционное давление, Федеральная резервная система может быть вынуждена занять более ястребиную позицию, что потенциально приведет к повышению процентных ставок и ужесточению финансовых условий. Международное энергетическое агентство (МЭА) рассматривает возможность высвобождения рекордного количества нефти, согласно энергетическим новостям. Это может повлиять на инфляционные ожидания и, в свою очередь, повлиять на динамику SP500. Индекс сегодня снизился на 0.44%, поскольку рынок принимает во внимание эти факторы.
Технические сигналы: перспектива нескольких таймфреймов
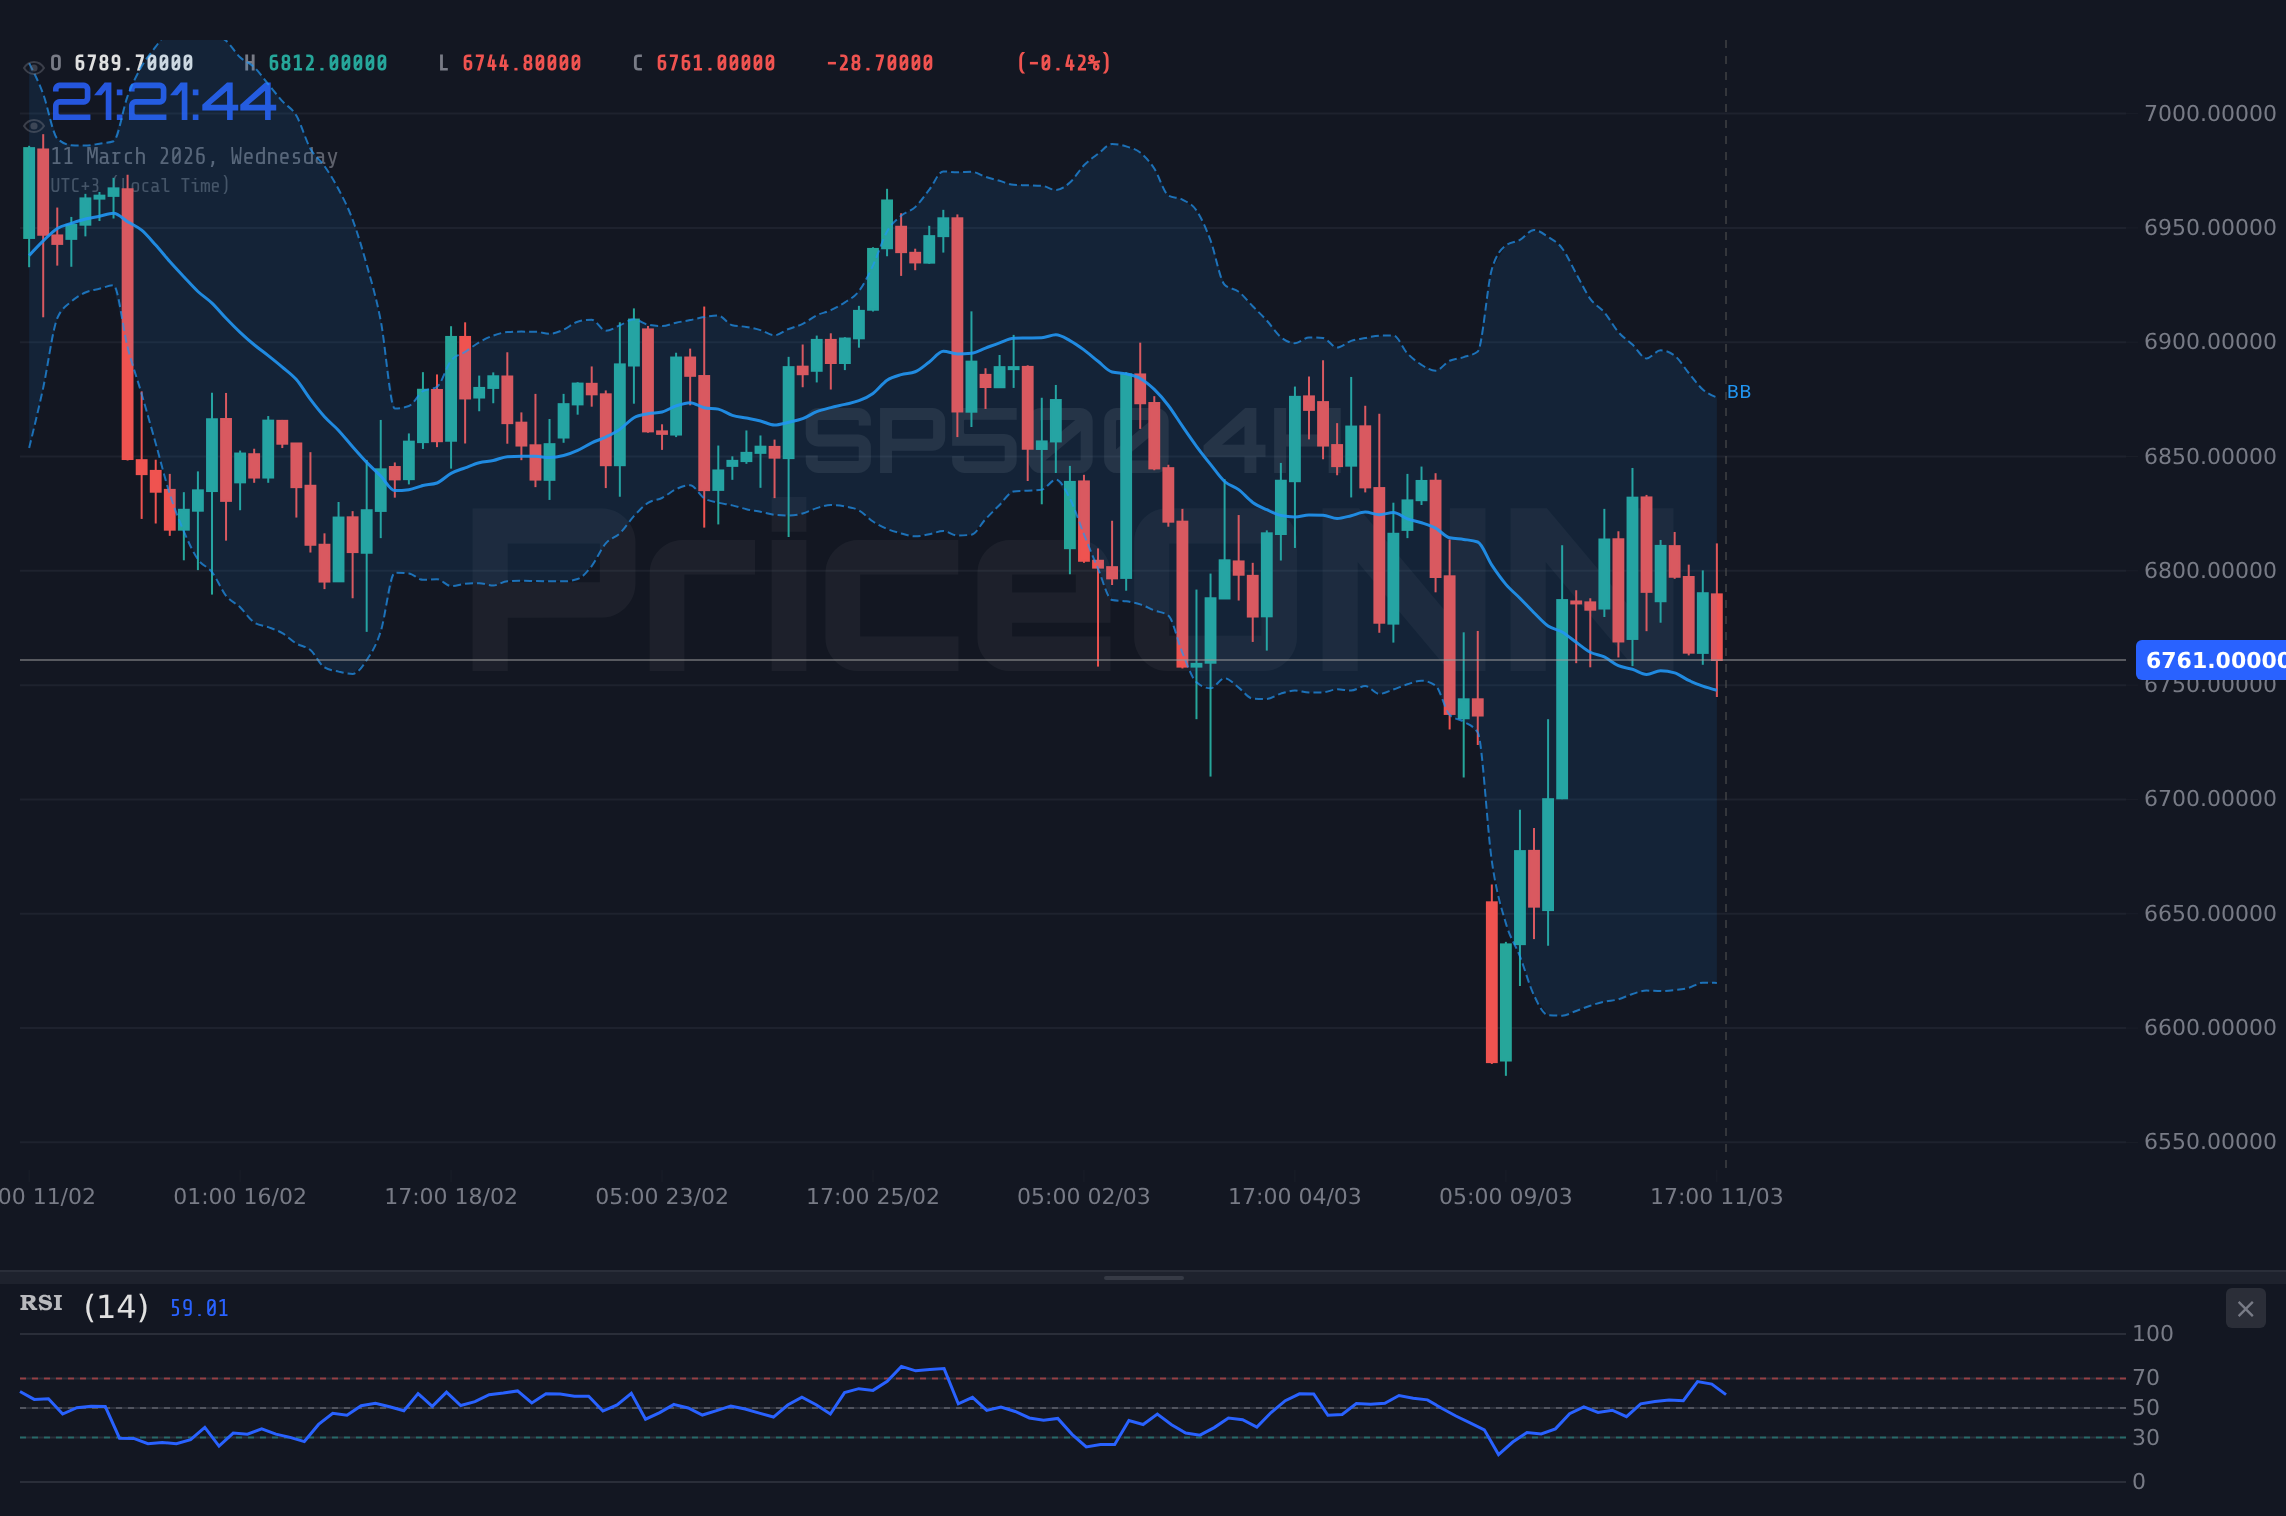
Всесторонняя оценка SP500 требует анализа нескольких таймфреймов, охватывающего как краткосрочные, так и долгосрочные перспективы. На 1-часовом графике SP500 демонстрирует нейтральный тренд с ADX 10.49, что указывает на слабую силу тренда. RSI, на уровне 44.45, находится на нейтральной территории, предлагая ограниченное представление о потенциальных направленных смещениях. Однако гистограмма MACD отображает отрицательный импульс, что говорит о том, что продавцы в настоящее время оказывают давление вниз. Стохастический индикатор показывает K=24.79 и D=35.58, медвежий сигнал.
Переходя к 4-часовому таймфрейму, SP500 показывает более сильный медвежий тренд с ADX 14.94. RSI, на уровне 47.87, продолжает находиться на нейтральной территории, в то время как гистограмма MACD демонстрирует положительный импульс, указывая на потенциальное расхождение с преобладающим медвежьим настроем. Стохастический индикатор также указывает на медвежий сигнал.
Изучение дневного графика дает более широкое представление о траектории SP500. Индекс демонстрирует сильный медвежий тренд с ADX 34.36, что говорит об устойчивом давлении вниз. RSI, на уровне 41.97, указывает на то, что индекс приближается к условиям перепроданности, потенциально открывая путь для краткосрочного отскока. Однако гистограмма MACD демонстрирует отрицательный импульс, усиливая преобладающий медвежий настрой. Стохастический индикатор сигнализирует о бычьем пересечении, которое может указывать на потенциальный краткосрочный разворот.
Ключевые уровни для наблюдения
Определение ключевых уровней поддержки и сопротивления имеет первостепенное значение для трейдеров, стремящихся ориентироваться в текущем ландшафте SP500. С точки зрения снижения, немедленную поддержку можно найти на уровне 6755.3, за которым следуют 6736.6, а затем 6727.1. Эти уровни представляют собой потенциальные области, где может возникнуть интерес к покупке, потенциально останавливая дальнейшее снижение. И наоборот, с точки зрения роста, первоначальное сопротивление находится на уровне 6783.5, за которым следуют 6793, а затем 6811.7. Эти уровни могут действовать как барьеры для восходящих движений цен, потенциально вызывая возобновление давления со стороны продавцов.
SP500 продемонстрировал заметное снижение и в настоящее время тестирует уровень поддержки 6750, торгуясь на уровне $6,760.70. Дневное закрытие ниже этого уровня подтвердит прорыв и сигнализирует о дальнейшем снижении к следующей поддержке вблизи 6736.6. Однако, если уровень удержится, мы можем увидеть краткосрочный отскок к сопротивлению на уровне 6783.5. Общий тренд остается медвежьим, поэтому оправдан осторожный подход, особенно для длинных позиций.
Роль рыночных настроений
Рыночные настроения играют ключевую роль в формировании ценовых движений SP500. Восприятие инвесторами риска и вознаграждения, а также их ожидания относительно будущих экономических условий могут существенно повлиять на решения о покупке и продаже. В настоящее время рыночные настроения, по-видимому, склоняются к осторожности, о чем свидетельствует недавнее снижение SP500 и повышенная волатильность, наблюдаемая в различных классах активов. Страх рецессии и перспектива продолжения повышения ставок со стороны ФРС, вероятно, оказывают давление на настроения инвесторов. Недавнее падение цен на нефть может ослабить некоторые опасения по поводу инфляции, но общая картина остается неопределенной.
Dow Jones снизился на 0.77%, торгуясь на уровне 47350.5, в то время как Nasdaq снизился на 0.3%, торгуясь на уровне 24906.88. Общее направление на рынке в настоящее время снижается, что может повлиять на SP500. VIX, показатель волатильности рынка, увеличился в последние сессии, что отражает повышенную тревогу инвесторов. Это говорит о том, что трейдерам следует проявлять осторожность и рассмотреть возможность внедрения стратегий управления рисками для защиты своего капитала.
Потенциальные катализаторы для разворота
В то время как SP500 в настоящее время борется с медвежьим давлением, несколько потенциальных катализаторов могут вызвать разворот в его траектории. Голубиный сдвиг в денежно-кредитной политике, характеризующийся более низкими процентными ставками или количественным смягчением, может дать толчок оценкам акций. Позитивные экономические данные, такие как более сильный, чем ожидалось, рост ВВП или снижение безработицы, также могут укрепить уверенность инвесторов и вызвать новое ралли. Кроме того, разрешение геополитической напряженности или прорыв в торговых переговорах могут ослабить неопределенность и создать более конструктивную рыночную среду.
Предстоящие публикации экономических данных из США могут выступить в качестве потенциальных катализаторов. Более сильные, чем ожидалось, данные могут ослабить опасения по поводу рецессии и поддержать SP500, в то время как более слабые данные могут усугубить давление вниз. Рынок внимательно следит за любыми признаками изменения позиции ФРС, что может существенно повлиять на перспективы SP500.
Уровни поддержки и сопротивления
Часто задаваемые вопросы: Анализ SP500
Что произойдет, если SP500 пробьет поддержку на уровне $6750?
Если SP500 пробьет критическую поддержку на уровне $6750, это может спровоцировать дальнейшее снижение к следующему уровню поддержки на уровне $6736.6. Устойчивый прорыв ниже $6750 подтвердит медвежий импульс и потенциально приведет к усилению давления со стороны продавцов.
Стоит ли покупать SP500 на текущих уровнях $6760.70, учитывая медвежьи сигналы?
Учитывая текущие медвежьи сигналы и тестирование ключевой поддержки, покупка на уровне $6760.70 сопряжена со значительным риском. Более разумным подходом было бы дождаться подтверждения отскока от уровня поддержки или прорыва выше сопротивления на уровне $6783.5, прежде чем рассматривать длинные позиции.
Является ли RSI на уровне 41.97 на дневном графике сигналом к покупке SP500?
Хотя RSI на уровне 41.97 предполагает, что SP500 приближается к условиям перепроданности, это не является однозначным сигналом к покупке. Медвежий тренд и отрицательный импульс MACD указывают на то, что возможно дальнейшее снижение, поэтому необходимо дополнительное подтверждение, такое как бычья модель разворота, прежде чем инициировать длинную позицию.
Как повлияют публикации по USD в среду на SP500 на этой неделе?
Предстоящие публикации по USD в среду будут иметь решающее значение для формирования рыночных ожиданий относительно перспектив политики Федеральной резервной системы. Более сильные, чем ожидалось, данные могут привести к более ястребиной позиции ФРС, что потенциально вызовет снижение SP500, в то время как более слабые данные могут ослабить опасения по поводу рецессии и поддержать ралли.
Отслеживайте рынки в реальном времени
ИИ-анализ и данные в реальном времени.