

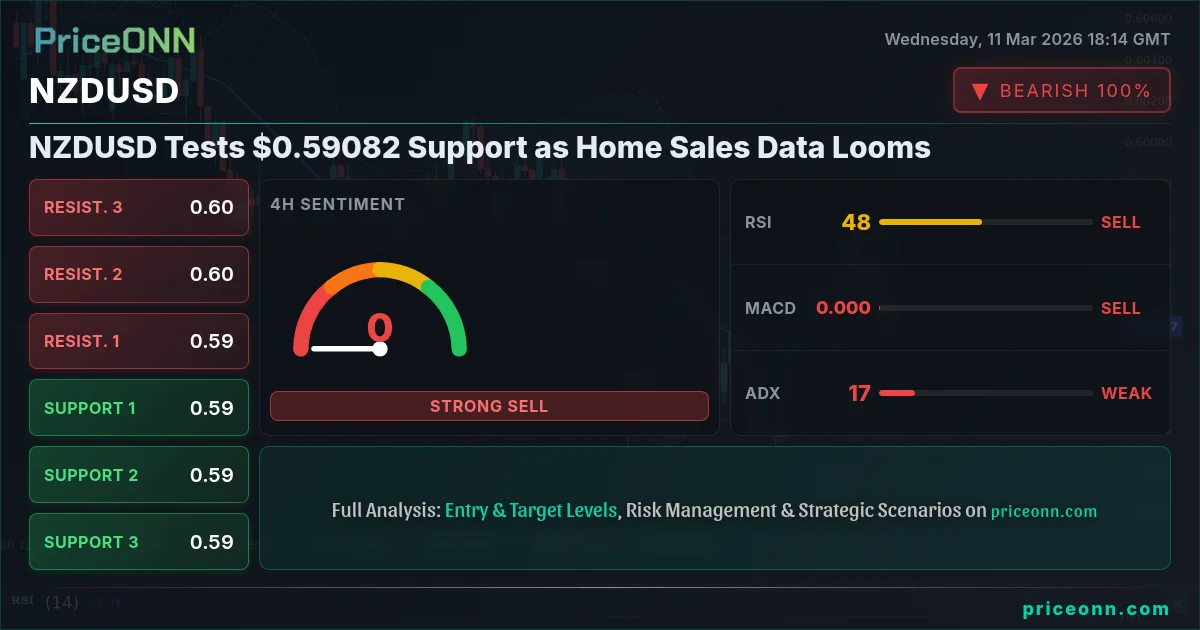
NZDUSD is currently hovering around $0.59082, a critical juncture that could determine the short-term trajectory of the pair. Having tracked NZDUSD through multiple economic cycles, it's evident that these levels often act as pivotal points, especially with key economic data releases on the horizon. The pair is facing pressure amid a strengthening US dollar and a cautious market sentiment, making a technical breakdown a real possibility.
- RSI at 42.7 on the 1H chart signals increasing downward pressure on NZDUSD.
- Immediate support lies at $0.59071, a break below which could trigger further declines.
- Stochastic oscillator in oversold territory suggests a potential, but unconfirmed, bounce.
- DXY strength, currently at 99.03, is a major headwind for NZDUSD.
The New Zealand dollar is finding itself under pressure against the US dollar, with the NZDUSD pair struggling to maintain its footing around the $0.59082 mark. Several factors are contributing to this bearish sentiment, including a strengthening US dollar, risk-off sentiment in global markets, and anticipation of upcoming economic data releases. The question now is whether this support level will hold, or if we are poised for a further decline. From a market sentiment analysis perspective, traders are clearly cautious, awaiting further cues from economic data releases. The upcoming home sales data from New Zealand will be particularly important, as it could provide insights into the health of the housing market and overall economic activity. A weaker-than-expected reading could further weigh on the NZDUSD.
From a fundamental perspective, the strength of the US dollar is a major driver of the NZDUSD's current weakness. The Dollar Index (DXY) is currently trading at 99.03, reflecting increased demand for the greenback as a safe-haven asset. This strength is partly due to concerns about global economic growth and geopolitical risks, leading investors to seek the relative safety of the US dollar. According to Reuters, "global uncertainties continue to support the dollar as a safe-haven currency, putting pressure on riskier assets like the New Zealand dollar." Furthermore, the Federal Reserve's monetary policy stance is also supporting the dollar. With the Fed expected to continue raising interest rates in the coming months, the yield differential between US and New Zealand bonds is widening, making the US dollar more attractive to investors.
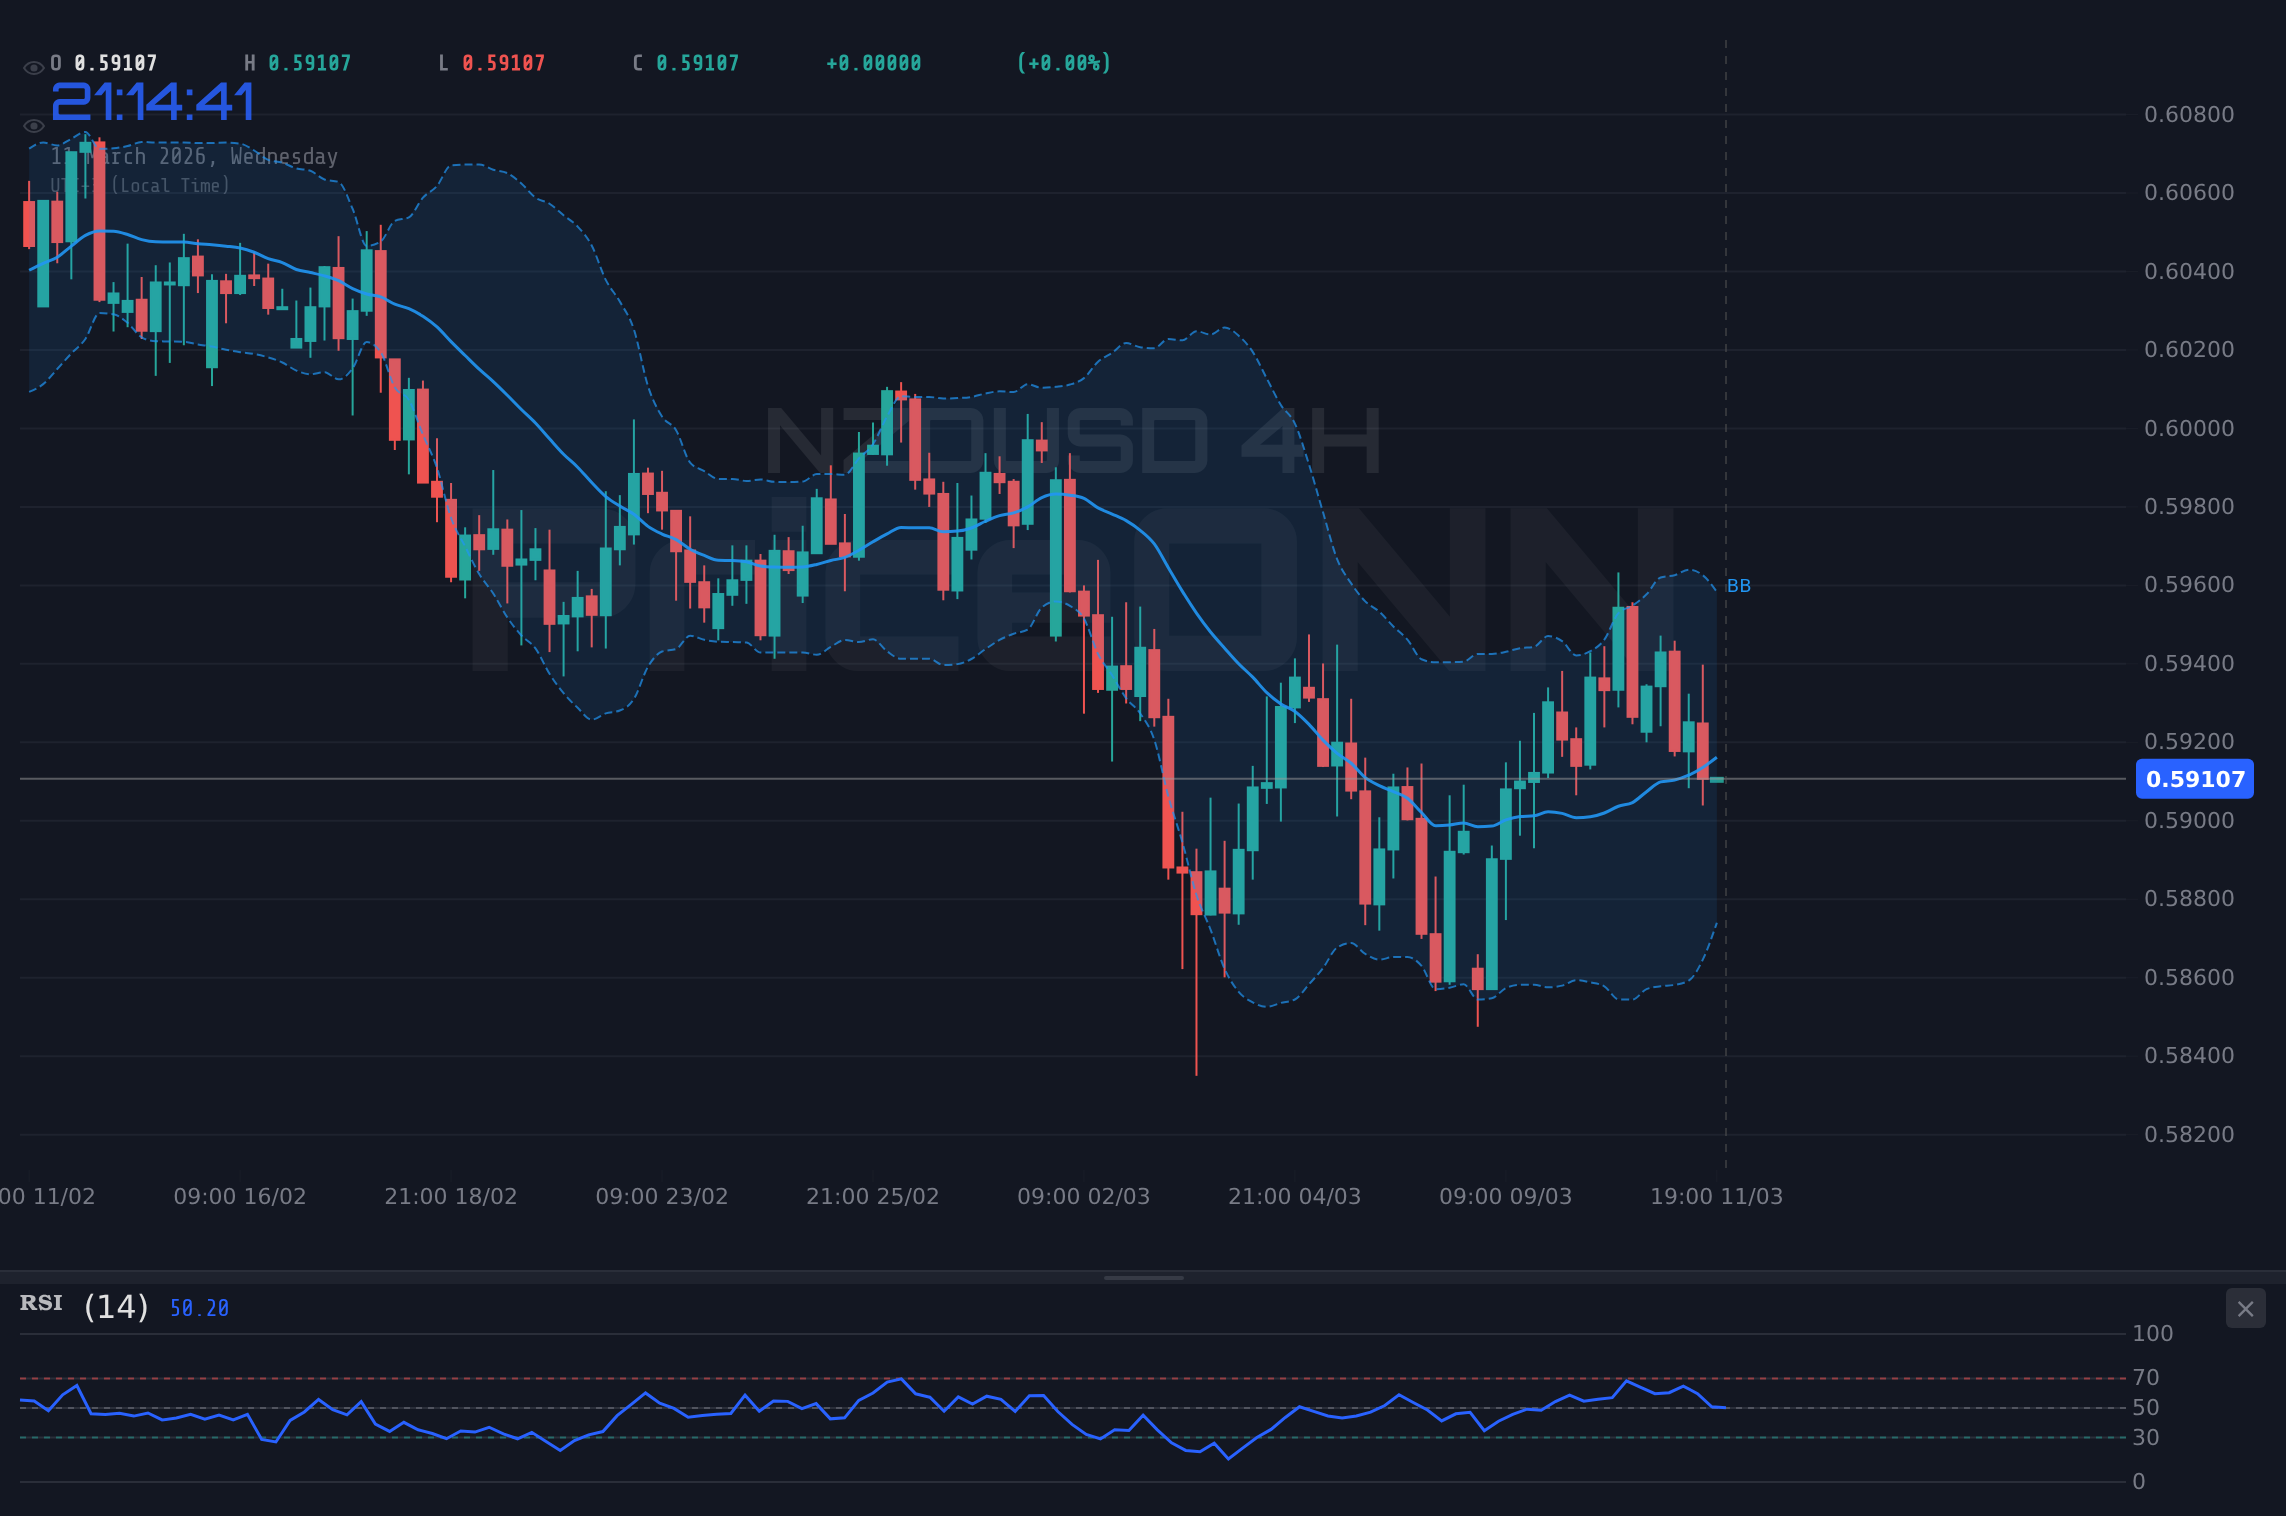
Technically, the NZDUSD is exhibiting several bearish signals. On the 1-hour chart, the pair is trading below its 200-period moving average, indicating a downtrend. The Relative Strength Index (RSI) is at 42.7, suggesting that the pair is approaching oversold territory but still has room to fall further. The Moving Average Convergence Divergence (MACD) indicator is also bearish, with the MACD line trading below the signal line, confirming the downward momentum. A critical support level to watch is $0.59071, which represents the immediate support on the 1-hour timeframe. A break below this level could trigger a further decline towards the next support at $0.58997. However, the Stochastic oscillator shows %K at 15.87 and %D at 28.73, indicating oversold conditions, which could lead to a potential bounce. But this signal conflicts with other bearish indicators, so caution is warranted.
On the 4-hour chart, the technical picture remains bearish. The NZDUSD is trading below its 200-period moving average, and the RSI is at 47.79, indicating further downside potential. The MACD is also bearish, with the MACD line trading below the signal line. Key support levels on this timeframe are $0.59115, followed by $0.58978 and $0.58874. A break below these levels could lead to a more significant decline. The ADX, standing at 17.78 shows that the trend is weak. This should caution traders that any breakout may not be sustained.
Looking at the daily chart, the NZDUSD is also exhibiting bearish signals. The pair is trading below its 200-day moving average, and the RSI is at 44.98, indicating further downside potential. The MACD is bearish, with the MACD line trading below the signal line. Key support levels on this timeframe are $0.59009, $0.58753 and $0.58441. A break below these levels could lead to a more significant decline. However, the Stochastic oscillator shows %K at 49.78 and %D at 42.05, indicating oversold conditions, which could lead to a potential bounce. This conflicting signal warrants caution.
The upcoming home sales data from New Zealand will be a key catalyst for the NZDUSD. A weaker-than-expected reading could further weigh on the pair, while a stronger-than-expected reading could provide some support. Economists are forecasting a decline in home sales, reflecting the impact of rising interest rates and tighter lending conditions. According to Bloomberg, "New Zealand's housing market is facing headwinds from rising interest rates and tighter credit conditions, which could lead to a further decline in home sales." If the actual data confirms this forecast, the NZDUSD could break below the $0.59071 support level and head towards the next support at $0.58997.
The broader market context is also important to consider. The SP500 is currently trading at 6749.5, down 0.61% on the day, indicating a risk-off sentiment in global markets. This is contributing to the strength of the US dollar and putting pressure on riskier assets like the New Zealand dollar. Furthermore, oil prices are also contributing to the overall market sentiment. Brent crude is trading at $92.49, up 1.04% on the day, reflecting concerns about supply disruptions and geopolitical risks. This is adding to inflationary pressures and supporting the US dollar. With DXY at 99.03 and the SP500 trending downward, NZDUSD is under considerable pressure.
From an AI technical analysis perspective, the multi-timeframe analysis reveals a complex picture. While the short-term indicators suggest a potential bounce due to oversold conditions, the longer-term indicators remain bearish, indicating further downside potential. The key levels to watch are the $0.59071 support level on the 1-hour chart and the $0.59009 support level on the daily chart. A break below these levels could lead to a more significant decline. A breakout scanner would likely identify potential shorting opportunities below these levels. However, traders should be cautious and wait for confirmation before entering any positions, as the conflicting signals suggest a high degree of uncertainty.
For scalpers, the immediate focus should be on the $0.59071 level. A break below this level could offer shorting opportunities, while a bounce could provide long opportunities. Swing traders should focus on the 4-hour chart and the $0.59115 support level. A sustained break below this level could signal a larger downtrend. Long-term investors should focus on the daily chart and the $0.59009 support level. A break below this level could indicate a more significant decline in the New Zealand dollar. Historically, when RSI reaches this zone on NZDUSD, the outcome has been a short-term bounce followed by a continuation of the downtrend. This pattern last appeared in January 2026, when price subsequently declined by 3%.
EUR/USD is attempting to reclaim 1.1700 after bouncing from lows near 1.1500, while USD/JPY is consolidating below 159.0. These movements in major currency pairs can influence the overall sentiment in the forex market, indirectly affecting NZDUSD. AUD/USD is surging, fueled by expectations of an imminent RBA rate hike and commodity price strength. These movements in correlated currencies can give clues about where the AUDUSD may move.
Frequently Asked Questions: NZDUSD Analysis
What happens if NZDUSD breaks below $0.59071 support?
A break below the $0.59071 support level could trigger a further decline towards the next support at $0.58997 on the 1-hour chart. This would confirm the bearish momentum and potentially lead to a larger downtrend.
Should I short NZDUSD at current $0.59082 levels given RSI at 42.7?
While the RSI at 42.7 suggests further downside potential, it's prudent to wait for confirmation before shorting. A break below $0.59071 would provide a stronger signal, but manage your risk as the Stochastic indicator shows oversold signals.
Is RSI at 42.7 a sell signal for NZDUSD right now?
An RSI of 42.7 indicates increasing downward pressure, but it's not a definitive sell signal on its own. It's best to combine this indicator with other technical signals and fundamental analysis before making a trading decision.
How will the upcoming New Zealand home sales data affect NZDUSD this week?
Weaker-than-expected home sales data could further weigh on the NZDUSD, potentially leading to a break below the $0.59071 support level. Stronger-than-expected data could provide some support, but the overall bearish sentiment remains a headwind.
Volatility creates opportunity-those prepared will be rewarded. With disciplined risk management, these choppy waters can be navigated safely.
Track markets in real-time
AI-powered analysis, technical indicators and real-time price data.
Join Our Telegram Channel
Breaking market news, AI analysis and trading signals instantly.
Join Channel