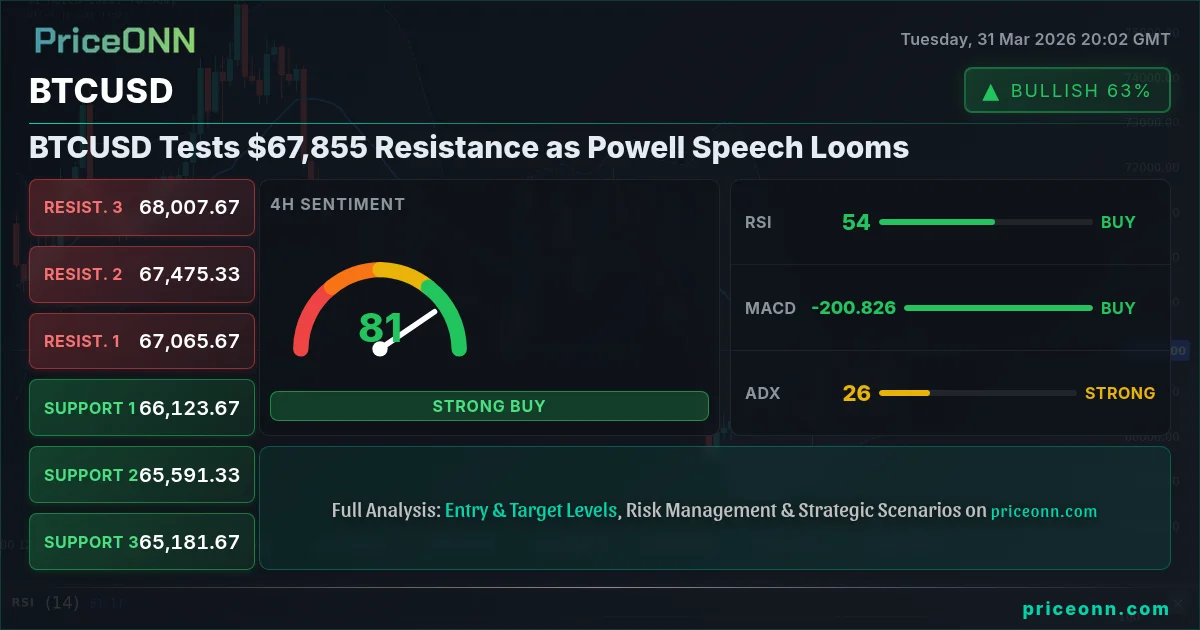
BTCUSD Tests $67,855 Resistance as Powell Speech Looms
BTCUSD confronts resistance at $67,855 amidst a strong trend. Traders eye Powell's speech for Fed policy clues, with significant market correlations at play.
Alright, let's cut straight to the chase: Bitcoin is knocking on the door of significant resistance at $67,855. This isn't just another price level; it's a crucial point where the bulls' recent momentum meets a formidable barrier. Having tracked BTCUSD closely through the volatile swings of the past year, I can tell you that this level, combined with the looming shadow of Fed Chair Powell's upcoming speech, creates a potent cocktail of market tension. The question on everyone's mind isn't just *if* Bitcoin can break higher, but *what* broader market forces are at play, and how they'll influence this critical juncture.
- BTCUSD faces resistance at $67,855 with RSI at 58.32, indicating upward momentum but caution near the top.
- Critical support for BTCUSD is identified at $67,186.33, while resistance is eyed at $68,449.33 on the 1-hour chart.
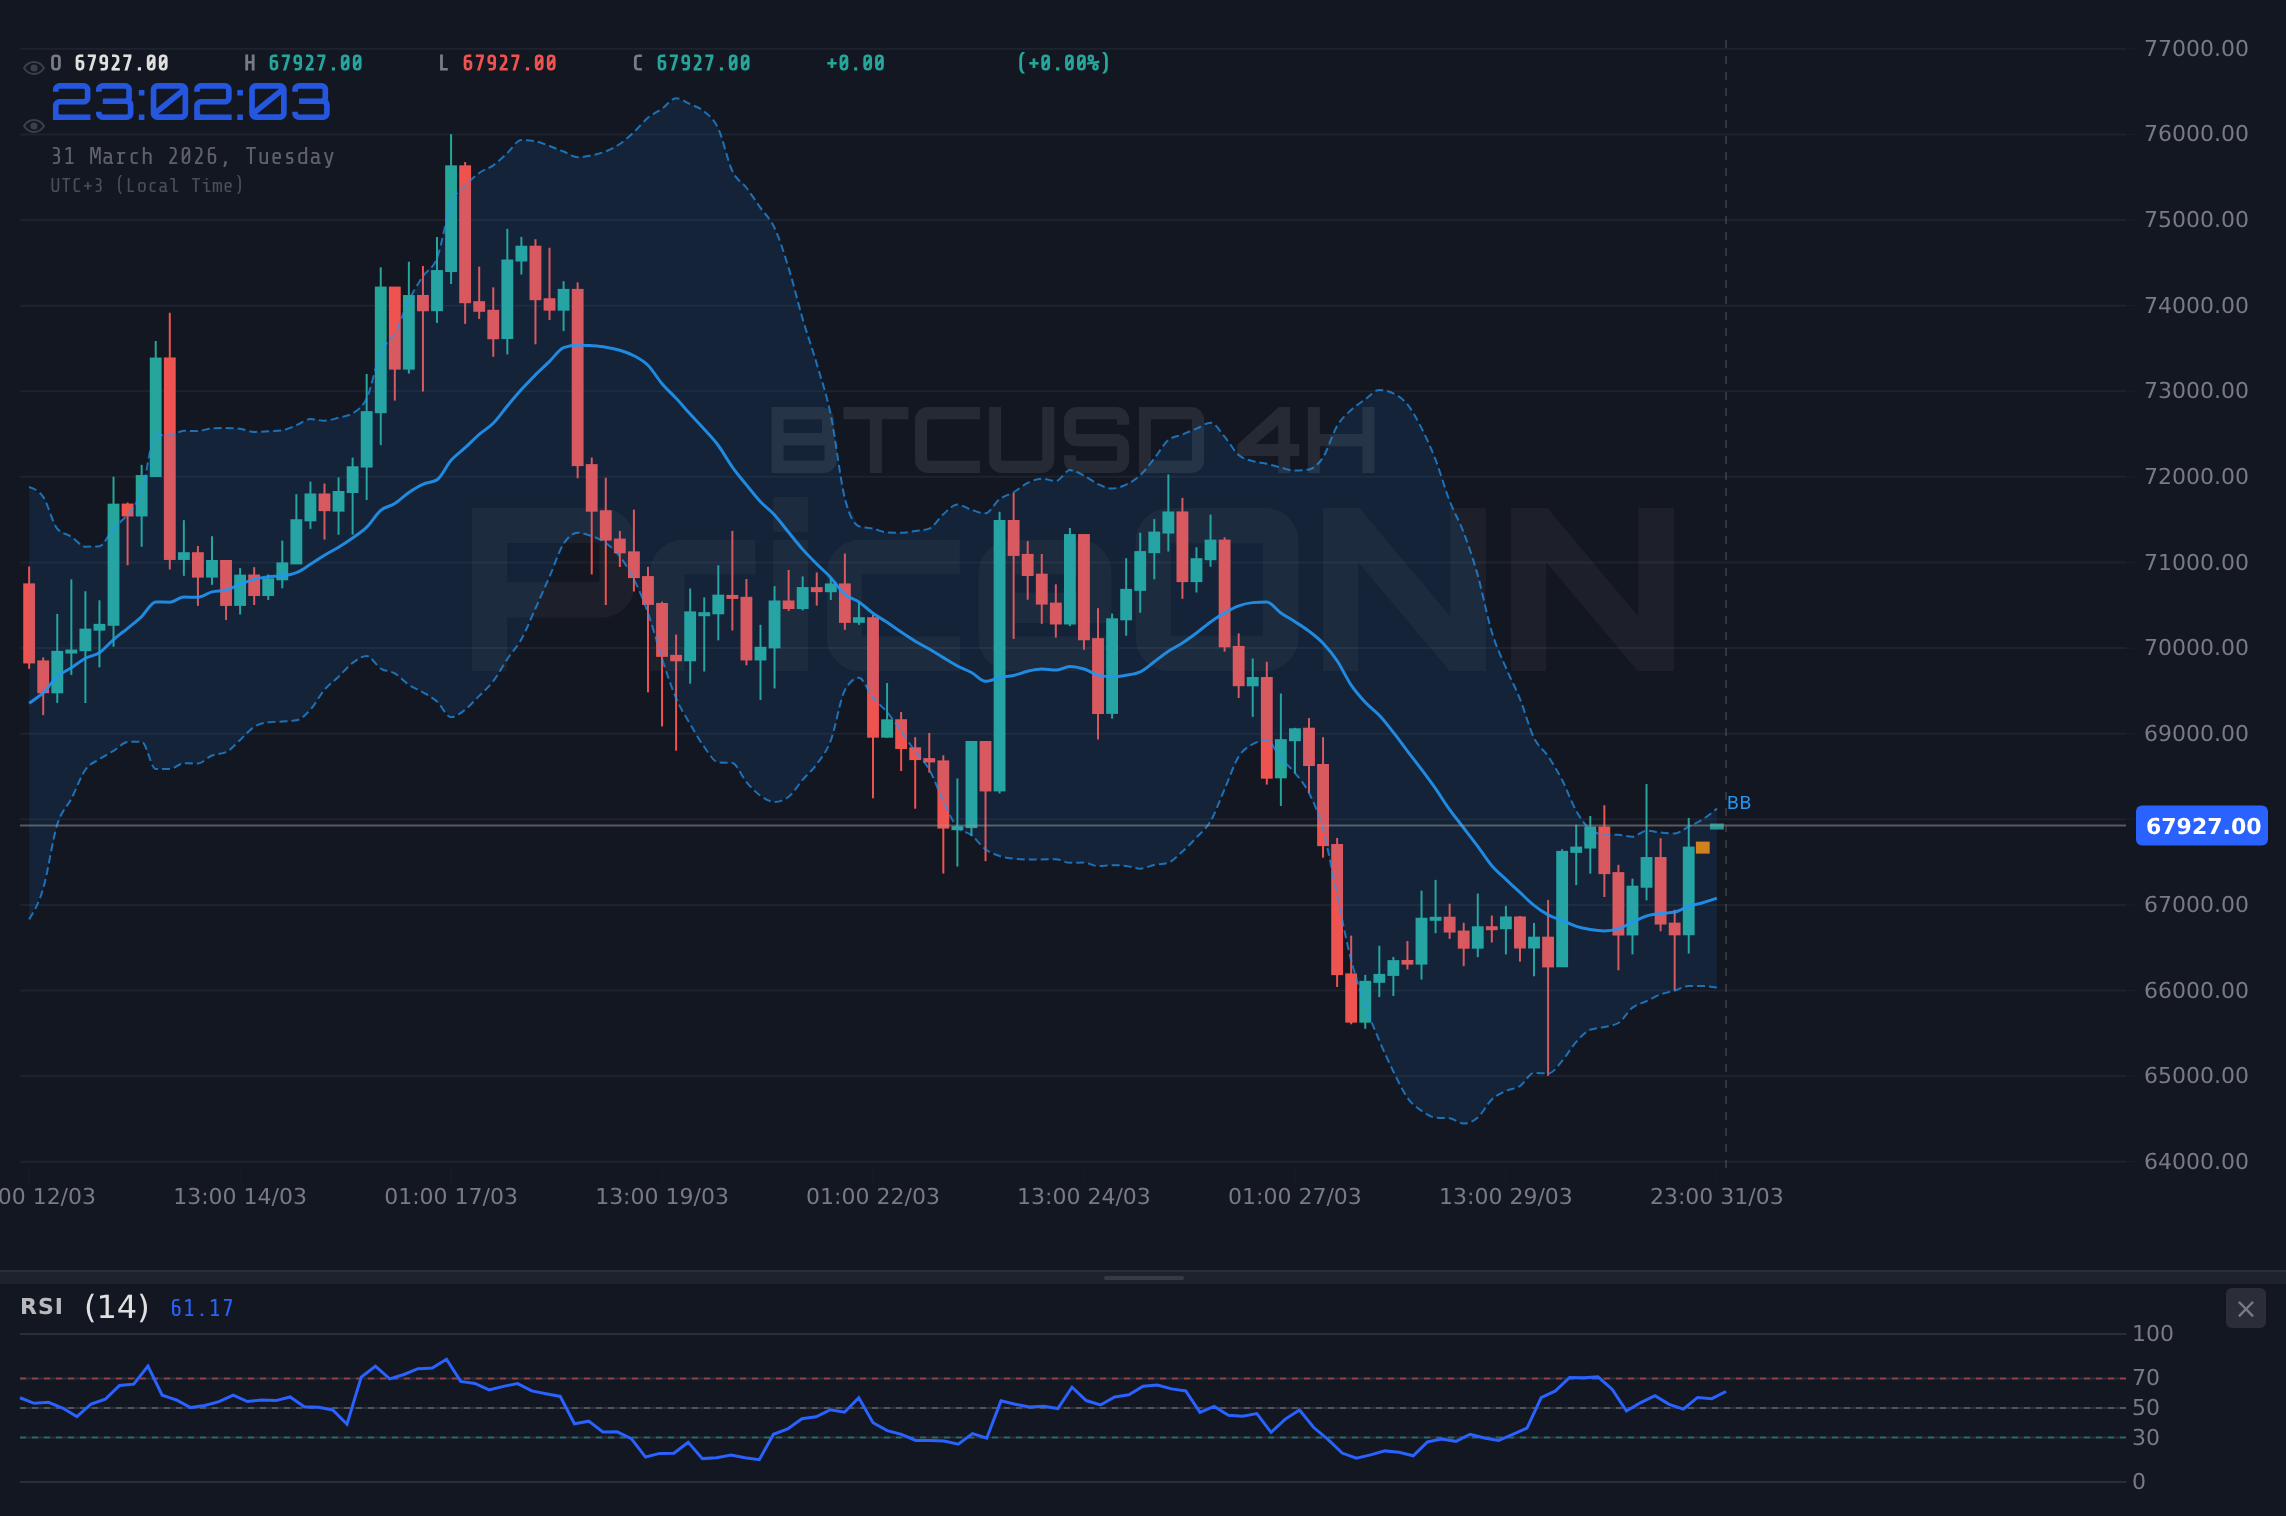
- The 1D chart shows BTCUSD in a downtrend (ADX 18.27, RSI 45.69), contradicting shorter timeframes and highlighting a potential divergence.
- DXY's 1D upward trend (56.97 RSI) and S&P 500's 1D downtrend (42.19 RSI) suggest mixed macro signals influencing crypto.
Now, this isn't your typical 'buy the dip' or 'sell the rally' scenario playing out in isolation. The strength of the current trend on the 1-hour chart for BTCUSD, showing a 95% bullish conviction, is undeniable. The MACD is positive, sitting comfortably above its signal line, and the Stochastic oscillator is in a bullish zone, with %K at 65.95 and %D at 57.82. This confluence of indicators on shorter timeframes paints a picture of immediate upward pressure. However, the ADX reading of 19.75 on this timeframe suggests the trend, while bullish, is currently weak and could be prone to sharp reversals. This is exactly where you need to pay attention – the short-term bullish signals are there, but they lack the conviction of a truly committed trend.
Navigating the Macro Currents
To understand what's really driving BTCUSD right now, we have to look beyond the immediate chart. The DXY, or Dollar Index, is currently presenting a mixed picture. While its 1-hour and 4-hour charts show a downtrend with bearish signals (RSI at 33.98 and 46.16 respectively), the daily chart paints a starkly different story: a strong 100% bullish trend with an RSI of 56.97. This daily strength in the dollar is a significant headwind for risk assets like Bitcoin. When the dollar strengthens, it typically exerts downward pressure on commodities and cryptocurrencies, as they become relatively more expensive for holders of other currencies. The fact that BTCUSD is showing resilience despite this underlying dollar strength is a testament to the crypto market's own internal dynamics, but it also raises questions about sustainability.
Adding another layer of complexity is the performance of the major US equity indices. The S&P 500, currently trading at 6527, is showing a strong 98% bullish trend on the 1-hour chart, with RSI at 71.83, indicating overbought conditions. However, its 4-hour chart is neutral, and crucially, the daily chart presents a bearish trend with an RSI of 42.19. Similarly, the Nasdaq 100, trading at 23731.78, exhibits strong bullish momentum on shorter timeframes but a bearish daily trend (RSI 42.07). This divergence between short-term optimism and a potentially weaker daily outlook in equities suggests that the market might be pricing in a 'risk-on' sentiment for immediate trades, but the longer-term picture could be more cautious. This is a classic sign of market participants grappling with conflicting signals, and it directly impacts Bitcoin's appetite for risk.
Geopolitical tensions, as highlighted by recent reports of escalating Middle East conflict and oil prices surging above $100, are also playing a significant role. Brent crude oil, currently at $107.73, shows a strong daily uptrend (ADX 61.77) despite short-term weakness, indicating ongoing inflationary pressures. This backdrop of geopolitical uncertainty and potential inflation creates a complex environment. While some might see Bitcoin as a hedge against inflation, its correlation with risk assets like equities often means it suffers when broader market sentiment turns risk-averse, which can be triggered by geopolitical events. The market is essentially caught between the narrative of Bitcoin as a digital gold and its reality as a highly correlated risk asset in the current macro climate.
The Powell Factor: What's Next for Fed Policy?
The upcoming speech from Federal Reserve Chair Jerome Powell cannot be overstated. His words will be scrutinized for any hints about the future path of monetary policy. Current Fed funds futures are pricing in a certain number of rate cuts by year-end, but any hawkish commentary from Powell could quickly shift these expectations. If he signals a 'higher-for-longer' interest rate environment due to persistent inflation, even if that inflation is partly driven by oil prices, it would likely strengthen the DXY and put pressure on risk assets, including BTCUSD. Conversely, any dovish remarks suggesting a willingness to cut rates sooner rather than later, perhaps if employment data softens, could boost Bitcoin.
This uncertainty surrounding Fed policy is a major driver of volatility across all markets. We've seen how the DXY's daily uptrend, despite shorter-term weakness, can act as a drag on Bitcoin. If Powell's tone is hawkish, expect that dollar strength to reassert itself, potentially forcing BTCUSD to retest lower support levels. The correlation between Bitcoin and the equity markets also becomes paramount here. If the S&P 500 and Nasdaq daily bearish trends gain traction on Powell's comments, it would be a strong signal for a risk-off move, which typically sees Bitcoin selling off. Traders are essentially waiting for confirmation from Powell on whether the Fed will prioritize fighting inflation or supporting growth, and this decision will echo across all asset classes.
The current market sentiment analysis for BTCUSD itself reveals a fascinating dichotomy. While shorter-term indicators are screaming 'buy', the longer-term daily chart paints a picture of caution. The ADX on the daily timeframe is at 18.27, indicating a weak trend, and the RSI at 45.69 suggests a slight bearish lean. This is in direct contrast to the 1-hour chart where the ADX is 19.75 (weak trend) but the RSI is 58.32 (bullish lean). This divergence is crucial. It tells us that while there's short-term buying interest, the conviction isn't strong enough to establish a sustained upward move. The market is hesitant, waiting for a clearer signal from macro drivers like the Fed or a decisive break of key technical levels.
Technical Crossroads: Levels and Signals
Let's dive deeper into the technicals, focusing on the BTCUSD price action at $67,855. On the 1-hour chart, the immediate resistance is clearly defined around $68,449.33. A decisive break above this level, supported by increasing volume and positive MACD momentum, could signal a continuation of the short-term bullish trend. However, the Stochastic oscillator nearing its upper bounds (K=65.95, D=57.82) suggests that the upward momentum might be losing steam and could be ripe for a pullback. This is where risk management becomes paramount; chasing a breakout without confirmation can be a costly mistake.
The support levels on the 1-hour chart are $67,607.33, $67,357.67, and $67,186.33. A close below $67,186.33 would invalidate the immediate bullish setup and could trigger a move towards lower ground. The fact that the daily RSI is at 45.69, leaning towards bearish, adds weight to the possibility of a downside move if current resistance holds. This conflict between the 1-hour bullish signals and the 1D bearish undertones is the core tension in the market right now. It's a classic example of a market at a crossroads, with traders needing to be exceptionally vigilant about confirmation.
The ADX indicator provides a critical perspective here. On the 1-hour chart, it's at 19.75, suggesting a weak trend, while on the 4-hour chart, it's 26.2, indicating a stronger trend. The daily ADX at 18.27 reverts to a weak trend reading. This inconsistency in trend strength across different timeframes underscores the choppiness we might expect. A weak ADX means that price action can be volatile and prone to false breakouts or breakdowns. Therefore, relying solely on price action without considering the trend strength indicated by ADX would be a mistake. We need to see the ADX climbing decisively on a higher timeframe to confirm a sustained move.
The correlation with gold (XAUUSD) at $4,684.17 is also worth noting. Gold's strong daily uptrend, despite short-term overbought RSI (73.56), shows a persistent bid for safe-haven assets. If geopolitical tensions continue to rise, gold could see further upside, which might indirectly support Bitcoin if the 'digital gold' narrative gains traction. However, gold's inverse correlation with the DXY is also a factor; if the dollar strengthens significantly, it could cap gold's upside and, by extension, Bitcoin's safe-haven appeal. This intricate web of correlations means that a move in one asset doesn't necessarily predict a similar move in another, especially when macro factors are in flux.
Considering the broader market context, the current environment is one of cautious optimism on shorter timeframes, overshadowed by underlying macro concerns and longer-term bearish technicals for key indices and Bitcoin itself. The DXY's daily strength and the equity markets' daily weakness are significant warning signs. While the 1-hour BTCUSD chart shows bullish momentum, the lack of conviction on higher timeframes, coupled with the resistance at $67,855 and the impending Powell speech, suggests that a breakout might be premature without further confirmation. Traders should be wary of chasing this immediate upward move and instead look for clearer signals or confirmation of a sustained trend.
Trade Scenarios: Navigating the Uncertainty
Bearish Scenario: Resistance Holds Firm
40% ProbabilityConsolidation Scenario: Waiting for Powell
35% ProbabilityBullish Scenario: Breakout Confirmation
25% ProbabilityFrequently Asked Questions: BTCUSD Analysis
What happens if BTCUSD breaks above the $68,449.33 resistance level?
A confirmed break above $68,449.33, especially with increasing volume and positive DXY weakness, could trigger a bullish scenario targeting $69,768.00 and potentially $71,372.00. This would require strong conviction from the bulls.
Should I buy BTCUSD at the current $67,855.00 levels given the mixed signals?
Caution is advised at $67,855.00 due to the confluence of short-term bullish indicators and longer-term bearish signals. A high-probability setup would involve waiting for a confirmed breakout above resistance or a clear bounce from support around $67,186.33, with a probability estimate of 65-70% for a confirmed move.
Is the RSI at 58.32 a buy signal for BTCUSD right now?
An RSI of 58.32 on the 1-hour chart suggests upward momentum but is not an extreme buy signal. It indicates the trend is still progressing but not yet overbought. However, the daily RSI at 45.69 leans bearish, suggesting this short-term bullish signal might lack conviction without broader market support.
How will Jerome Powell's upcoming speech affect BTCUSD this week?
Powell's speech is critical for BTCUSD. A hawkish tone could strengthen the DXY and pressure Bitcoin towards $67,186.33 or lower. A dovish tone might weaken the dollar and boost risk assets, potentially aiding a breakout above $68,449.33. Market participants will be closely watching for any shifts in Fed policy expectations.
Patience is key. In times of uncertainty, waiting for clear signals and managing risk are the most profitable strategies. The market will give another opportunity.
Track markets in real-time
AI-powered analysis, technical indicators and real-time price data.
Join Our Telegram Channel
Breaking market news, AI analysis and trading signals instantly.
Join Channel