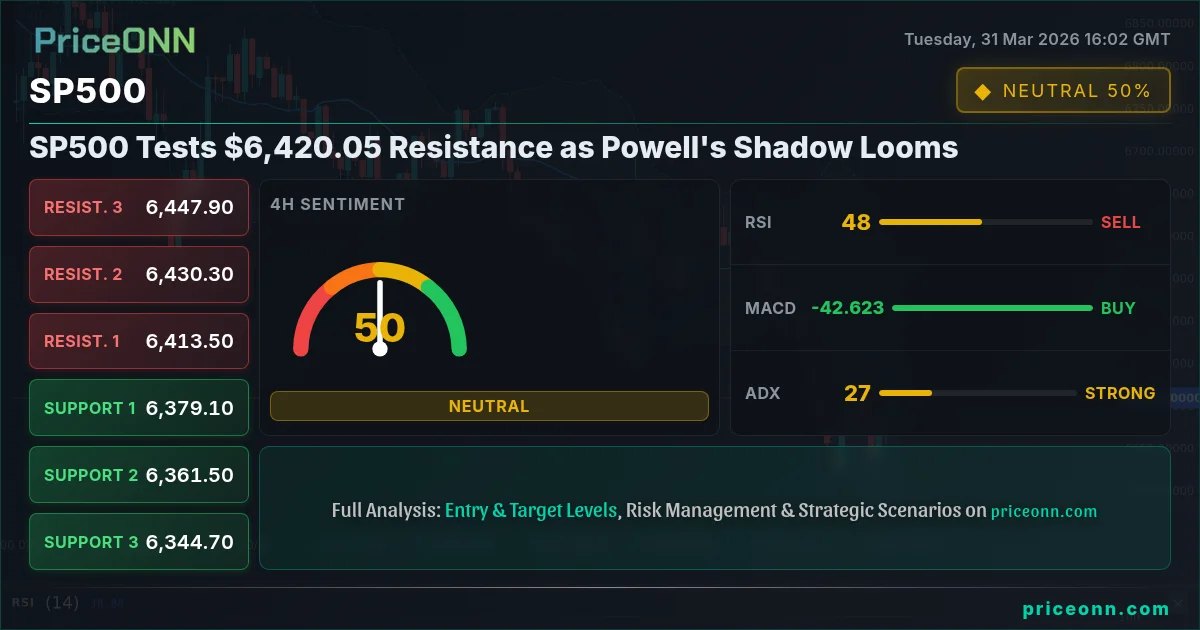
SP500 Tests $6,420.05 Resistance as Powell's Shadow Looms
The S&P 500 index is challenging the $6,420.05 resistance level. Investors eye Fed Chair Powell's upcoming speech for clues on interest rate policy amidst geopolitical turmoil.
The S&P 500 is currently dancing around the $6,420.05 mark, testing a significant resistance level as market participants brace for potential insights from Fed Chair Powell's highly anticipated speech. This juncture is critical; the index has shown resilience, climbing 1.27% on the day to reach $6,420.05, but the looming presence of central bank commentary and persistent geopolitical tensions in the Middle East, which are driving crude oil prices past $100, injects a dose of caution into the bullish narrative. The interplay between inflation fears, risk appetite, and monetary policy expectations is creating a complex trading environment, making the current levels a pivotal point for the market's immediate direction.
- The S&P 500 is currently testing resistance at $6,420.05, with a daily RSI of 55.62 indicating neutral momentum but an upward lean.
- Critical support for the S&P 500 lies at $6,342.13 (1H) and $6,379.10 (4H), levels that must hold to maintain the current upward bias.
- The ADX at 17.17 on the 1H chart suggests a weak trend, implying potential for a breakout or a reversal from current resistance levels.
- Correlation analysis shows the DXY at 100.00 is in a strong uptrend (4H/1D), potentially capping further upside for risk assets like the S&P 500 if it continues to strengthen.
Navigating the Resistance at $6,420.05
The Bullish Momentum Stalls
The S&P 500's ascent towards $6,420.05 has been notable, reflecting a degree of optimism despite the backdrop of global uncertainties. On the 1-hour chart, the index shows a 'BUY' signal with 7 out of 8 indicators leaning positive, and the RSI at 55.62 suggests room for further upside before hitting overbought territory. The MACD is above its signal line, and Stochastic oscillators are in a bullish configuration (%K > %D), reinforcing the short-term upward momentum. However, the ADX reading of 17.17 on this timeframe points to a weak trend, indicating that the current move might lack conviction and could be susceptible to a sharp reversal if key catalysts emerge. This ambiguity is precisely why traders are looking for clearer signals.
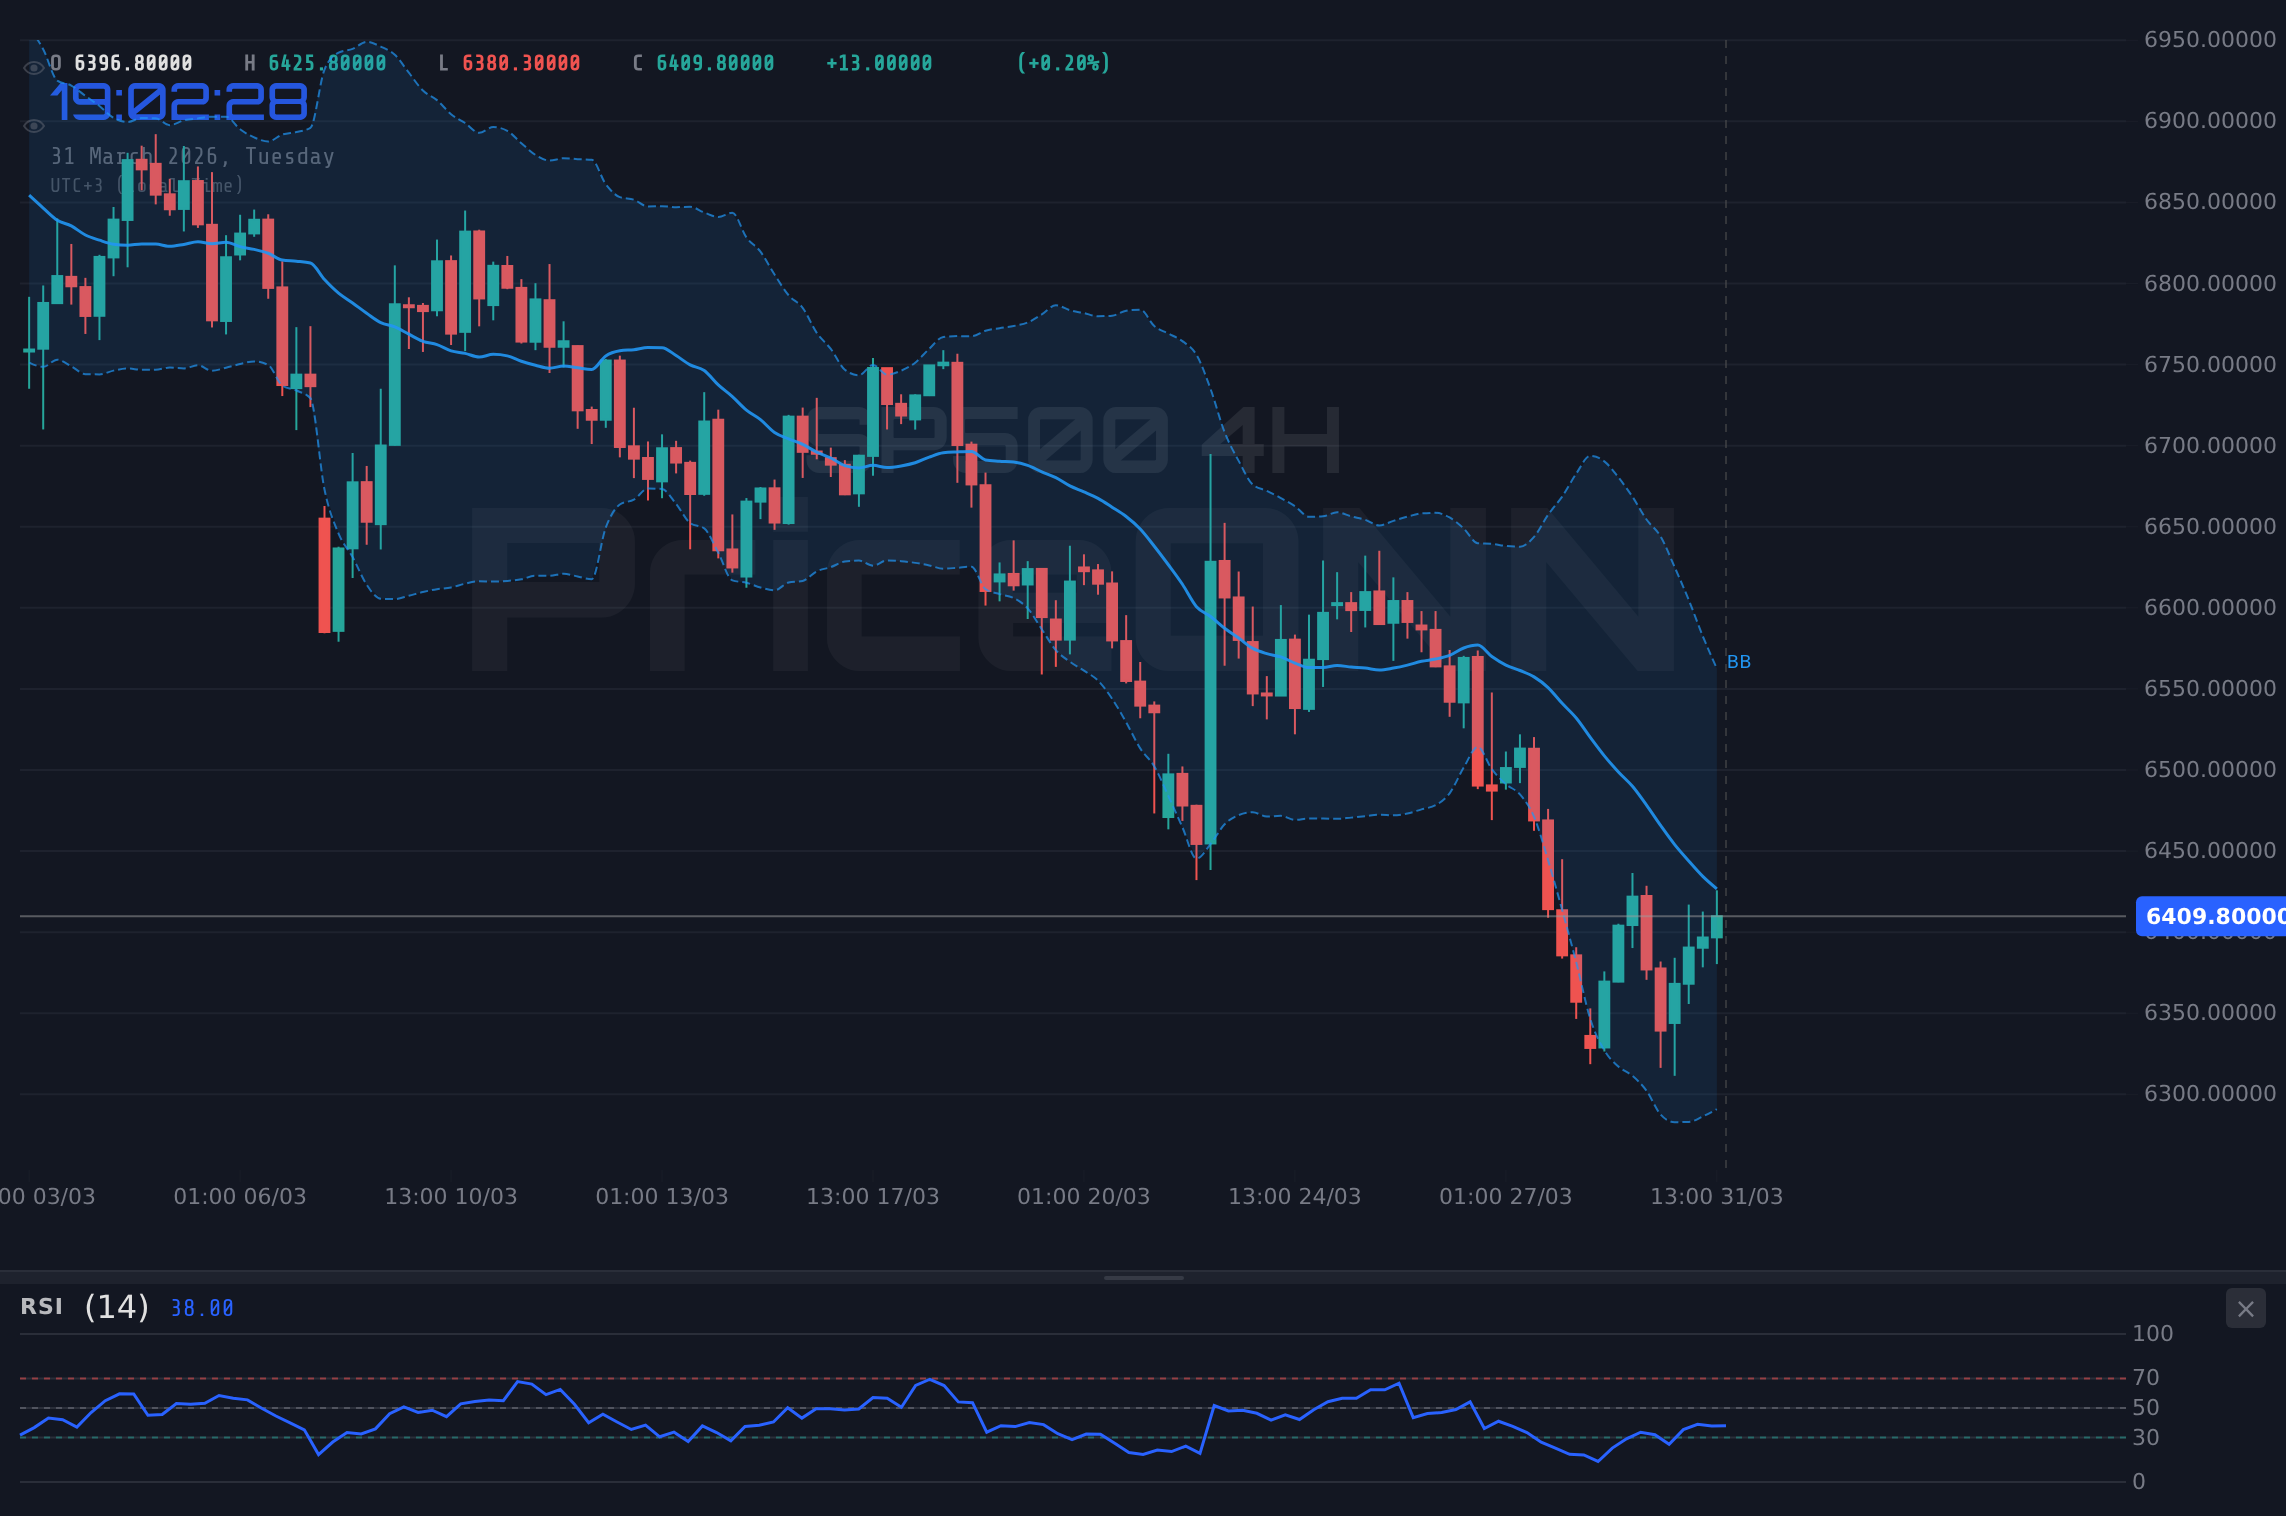
The 4-hour chart presents a slightly more cautious picture. While the overall signal leans towards 'SELL' (5 out of 8 indicators), the RSI at 45.77, though trending down, is not yet in oversold territory. The MACD still shows positive momentum, and Stochastic %K is above %D, suggesting some underlying strength. Yet, the ADX at 27.7 signifies a strong downtrend on this timeframe, which contradicts the 1-hour bullishness. This divergence between timeframes highlights the indecision currently at play. A close above the immediate resistance at $6,441.33 is needed to strengthen the bullish case, while a failure to hold support at $6,379.10 could quickly send the index lower.
The Daily Chart's Bearish Undertones
Digging deeper, the daily chart paints a decidedly bearish picture, despite the intraday gains. The S&P 500 is trading below its 1-day middle Bollinger Band, and the MACD histogram is firmly negative, suggesting that the longer-term trend might be under pressure. The RSI at 33.99 is firmly in oversold territory, indicating potential for a bounce, but the ADX at a robust 49.93 signals an extremely strong downtrend. This is where the conflicting signals become most pronounced. While short-term indicators might hint at a continuation of the intraday rally, the daily trend suggests that any upside moves might be opportunities for sellers to re-enter the market at better prices. The support levels at $6,291.57, $6,243.83, and $6,171.37 become increasingly important if this bearish sentiment prevails.
The strength of the ADX on the daily chart is particularly concerning for bulls. An ADX above 40 indicates a strong trend, and at nearly 50, it suggests that the prevailing downward momentum is significant. This means that short-term rallies could be mere corrections within a larger downtrend, a concept often referred to as 'catching a falling knife'. The Stochastic oscillator, with %K at 12.04 and %D at 27.05, is deeply oversold, which historically can precede a bounce, but without confirmation from other indicators or a shift in macro sentiment, this alone is not a buy signal. The market is at a crossroads, and the upcoming events will likely be the deciding factor.
Cross-Market Correlations: The Dollar and Geopolitics
The Dollar Index (DXY) at a Crossroads
The US Dollar Index (DXY) is currently trading around 100.00, presenting a complex picture across different timeframes. On the 4-hour and daily charts, the DXY exhibits a strong uptrend (ADX at 28.79 and 32.94 respectively), with the RSI at 60.53 and 61.27 indicating a healthy upward bias. The Stochastic on the daily chart is in the overbought zone (87.56 / 59.38), suggesting potential for a pullback. However, the 1-hour chart shows a different story, with the DXY trending down (ADX 34.5) and RSI at 49.6. This mixed signal from the dollar index itself adds another layer of complexity. Historically, a strengthening dollar often puts pressure on risk assets like the S&P 500 and commodities like gold. If the DXY manages to break above its 4-hour resistance at 100.35 and sustain the move, it could act as a headwind for the S&P 500's rally, especially if Powell adopts a hawkish tone.
The current DXY level of 100.00 is psychologically significant. A decisive move above this level, supported by a hawkish Federal Reserve stance, could trigger renewed dollar strength. This would likely translate into increased selling pressure on the S&P 500, as higher borrowing costs and a stronger dollar make US assets less attractive to foreign investors. Conversely, if the Fed signals a more dovish approach, or if geopolitical risks escalate further, we could see a flight to safety that benefits the dollar, but potentially also leads to a broader market selloff where even the dollar might struggle to find consistent strength against all safe-haven assets.
Geopolitical Tensions and Oil Prices: Inflationary Headwinds
The ongoing geopolitical tensions in the Middle East, coupled with reports of crude oil prices surging past $100 and Brent crude holding above $110 despite shifting supply dynamics, are significant factors influencing market sentiment. Brent crude is currently trading at $110.84, and WTI at $104.94. The daily charts for both Brent and WTI show strong uptrends (ADX 62.25 for Brent, 58.34 for WTI), indicating robust momentum. This rise in oil prices directly feeds into inflation expectations, creating a dilemma for central banks. Higher energy costs increase the cost of doing business and transportation, potentially slowing economic growth while simultaneously pushing inflation higher. This stagflationary risk is a major concern for equity markets.
The market's reaction to oil price surges has been historically sensitive. When oil prices spike, especially due to geopolitical supply disruptions, it often signals increased risk aversion. This can lead to sell-offs in equities as investors anticipate higher inflation and potentially tighter monetary policy. While the S&P 500 has shown some resilience, trading at $6,420.05, this resilience might be tested if oil prices continue their upward trajectory without a clear resolution to the geopolitical conflicts. The strong uptrend in oil, as indicated by the high ADX values, suggests that this is not a fleeting event and could have sustained inflationary implications. The market needs to see de-escalation or a clear sign that central banks are prepared to combat inflation effectively without choking off growth.
Fed Chair Powell's Speech: The Key Catalyst
Decoding the Fed's Stance
All eyes are on Fed Chair Powell's upcoming speech. Market participants will be scrutinizing his words for any indication of the Federal Reserve's future path regarding interest rates and quantitative tightening. The current economic backdrop, characterized by sticky inflation (suggested by oil prices and other indicators) and a resilient labor market, leaves the Fed in a difficult position. The S&P 500's current level of $6,420.05, while seemingly strong, is built on the expectation of a Fed that might pivot towards easing sooner rather than later. Any deviation from this expectation could trigger significant market volatility.
If Powell adopts a hawkish tone, emphasizing the need to keep rates higher for longer to combat inflation, we could see a sharp sell-off in equities. This would likely be accompanied by a strengthening dollar and potentially higher bond yields. Conversely, a dovish tone, acknowledging the risks to growth or expressing confidence that inflation is under control, could fuel further upside for the S&P 500, potentially pushing it towards higher resistance levels. The market's sensitivity to Fed commentary is amplified by the current technical setup, where the index is testing resistance levels on multiple timeframes.
What to Watch For in Powell's Remarks
Key elements to listen for include any commentary on inflation persistence, labor market dynamics, and the Fed's reaction function to geopolitical shocks and commodity price increases. Traders will be looking for signals regarding the timing and pace of potential rate cuts. The market is currently pricing in a certain number of cuts for the year, and Powell's remarks could either validate or challenge these expectations. The divergence in signals across different timeframes for the S&P 500 itself suggests that Powell's words could be the catalyst needed to break the current stalemate and establish a clearer trend.
Furthermore, the Fed's stance on financial stability in the face of rising oil prices and geopolitical risks will be crucial. Any indication that the Fed is prioritizing inflation control above all else could spook equity markets. The current technical picture for the S&P 500, with its neutral-to-bearish daily outlook despite intraday strength, suggests that the market is vulnerable to negative news. The support levels identified on the daily chart ($6,291.57 and below) become critical if Powell's speech fails to reassure investors.
Scenario Analysis for SP500 Traders
Bearish Scenario: Powell Sparks Sell-off
65% ProbabilityNeutral Scenario: Consolidation Amid Uncertainty
25% ProbabilityBullish Scenario: Dovish Powell Fuels Rally
10% ProbabilityThe current market environment demands patience. With the S&P 500 testing resistance at $6,420.05 and key technical indicators showing conflicting signals across timeframes, it's crucial to wait for confirmation. A decisive close above $6,441.33 on strong volume, coupled with dovish commentary from Powell, could initiate a bullish move. Conversely, a failure to hold $6,379.10, especially if Powell adopts a hawkish stance, might signal the start of a significant pullback. Risk management is paramount; avoid chasing the market and wait for clear setups.
Frequently Asked Questions: SP500 Analysis
What happens if the S&P 500 breaks below $6,379.10 support amidst hawkish Fed talk?
If the S&P 500 closes below the $6,379.10 support level, especially following hawkish commentary from Fed Chair Powell, it would likely trigger a bearish scenario. This could lead to a rapid decline towards the next key support at $6,342.13 as traders exit riskier assets. The market would reprice expectations for future rate cuts significantly.
Should I buy the S&P 500 at current levels of $6,420.05 given the mixed signals?
Buying at $6,420.05 carries risk due to the resistance level and conflicting technical indicators. A more prudent approach would be to wait for confirmation: either a clear breakout above $6,441.33 with strong volume or a confirmed hold of support around $6,379.10. Patience could reward traders with a better risk/reward setup.
Is the RSI at 55.62 a sell signal for the S&P 500 right now?
An RSI of 55.62 on the 1-hour chart is not a sell signal in itself; it indicates neutral momentum with a slight upward bias. However, on the daily chart, the RSI is at 33.99, which is oversold. This divergence means short-term strength could be counter-trend, and traders should look for confirmation from other indicators or price action before making decisions.
How will Fed Chair Powell's upcoming speech affect the S&P 500's trend at $6,420.05?
Powell's speech is the primary catalyst that could break the current stalemate. A dovish tone could propel the S&P 500 towards resistance targets like $6,472.17, while a hawkish stance might send it towards support levels such as $6,379.10. Market participants are highly sensitive to any hints about future interest rate policy.
Track markets in real-time
AI-powered analysis, technical indicators and real-time price data.
Join Our Telegram Channel
Breaking market news, AI analysis and trading signals instantly.
Join Channel