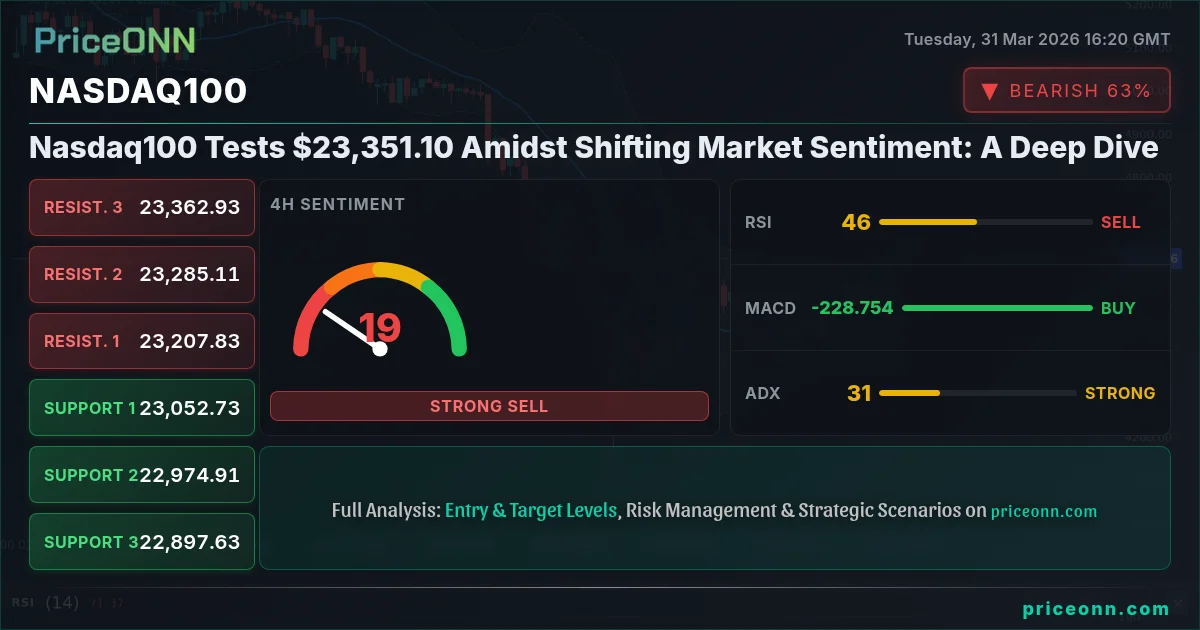
Nasdaq100 Tests $23,351.10 Amidst Shifting Market Sentiment: A Deep Dive
Nasdaq100 hovers near $23,351.10, caught between strong upward momentum and critical resistance. Key indicators suggest a cautious outlook.
The Nasdaq 100, a barometer for growth-oriented stocks, is currently trading at $23,351.10, presenting a complex picture for investors. While the index has shown resilience, pushing towards higher levels, several technical indicators and broader market correlations suggest that the path forward may be fraught with caution. This analysis delves into the nuanced technical landscape, explores the interplay with global indices and commodities, and assesses the potential scenarios that could unfold in the coming trading sessions.
- Nasdaq100 is trading at $23,351.10, near key resistance levels.
- The 1-hour chart shows a strong bullish trend (ADX 17.13), but the daily chart presents a bearish trend (ADX 49.93).
- RSI at 59.96 signals neutral momentum on the 1-hour chart, while the daily RSI at 35.74 indicates oversold conditions.
- Correlation with DXY at 99.99 and S&P 500 at 6440.6 is crucial for understanding Nasdaq100's next move.
Navigating the Nasdaq's Crossroads
The Nasdaq 100's current position at $23,351.10 is a critical juncture, reflecting a tug-of-war between persistent buying interest and significant overhead resistance. On the 1-hour timeframe, the trend strength indicator, ADX, registers at 17.13, suggesting a weak trend. However, the overall signal leans towards 'BUY' (7 buy, 1 sell, 0 neutral), fueled by a Stochastic oscillator with %K at 77.39 and %D at 66.86, indicating a bullish crossover. This short-term bullish bias is further supported by the MACD, which shows positive momentum with the MACD line above its signal line. The RSI(14) stands at 59.96, firmly in neutral territory and exhibiting an upward eğilim, suggesting room for further gains without immediate overbought conditions on this granular scale. The Bollinger Bands are also trading above the middle band, reinforcing this short-term optimism. This divergence between the immediate upward momentum and broader market signals warrants a closer inspection.
However, zooming out to the 1-day chart paints a starkly different picture. Here, the trend is unequivocally bearish, with an ADX reading of 49.93 - a sign of a very strong trend. The overall signal flips to 'SELL' (0 buy, 7 sell, 0 neutral). The RSI(14) at 35.74 is deep in the oversold zone, but this does not necessarily imply an immediate buy signal in a strong downtrend. The MACD is firmly in negative territory, with the MACD line below its signal line, confirming bearish momentum. The Stochastic oscillator (%K at 12.7, %D at 22.87) also signals a strong downtrend, with %K below %D and in oversold territory. The Bollinger Bands are trading below the middle band, indicating bearish pressure. This significant divergence between the 1-hour and 1-day technicals highlights the choppiness and potential for sharp reversals in the current market environment. The question for traders is which timeframe's signal will ultimately dominate.
Intermarket Dynamics: The Dollar, Oil, and Equity Correlations
Understanding the Nasdaq 100's trajectory requires a keen eye on its correlations with other major markets. The Dollar Index (DXY) is currently at 99.99, exhibiting a strong daily uptrend with an ADX of 32.94. Typically, a strengthening dollar puts pressure on risk assets like the Nasdaq 100, as it increases the cost of investment for foreign buyers and can signal tighter global liquidity. The DXY's daily signal is a strong 'BUY' (8 buy, 0 sell, 0 neutral), reinforcing the bearish undertones for risk assets. This inverse correlation is a critical factor to monitor; any sustained move higher in the DXY could act as a significant headwind for the tech-heavy index.
Meanwhile, oil prices, particularly Brent Crude at $110.71, are a crucial inflation barometer. Brent Crude shows a very strong daily uptrend (ADX 62.25), with a 'BUY' signal across most timeframes. Elevated oil prices contribute to inflationary pressures, which in turn influence central bank policy expectations. The Federal Reserve's stance on inflation remains a pivotal driver for equity markets. If inflation fears resurface due to sustained high energy costs, it could prompt the Fed to maintain a hawkish policy, potentially dampening investor appetite for growth stocks concentrated in the Nasdaq 100. The S&P 500 is trading at 6440.6, showing a strong daily downtrend (ADX 49.93) and a 'SELL' signal, mirroring the bearish sentiment on the Nasdaq 100's daily chart. The Nasdaq 100's own daily chart also shows a strong downtrend with ADX 49.93. This broad weakness across major US indices suggests that the current short-term strength in the Nasdaq might be a temporary retracement within a larger bearish trend.
Deciphering the Technical Signals: A Multi-Timeframe Perspective
The 1-hour chart for the Nasdaq 100 offers a glimmer of hope for bulls, with a generally positive signal and indicators like the Stochastic (%K=77.39, %D=66.86) and MACD suggesting upward momentum. The RSI at 59.96 is not yet in overbought territory, allowing for potential further upside. The ADX at 17.13, however, points to a lack of strong trend conviction, meaning this short-term strength could easily dissipate. The upper Bollinger band is being tested, which could act as a temporary ceiling. This suggests that while short-term traders might find opportunities on the buy-side, the overall trend conviction is lacking, making it a risky proposition.
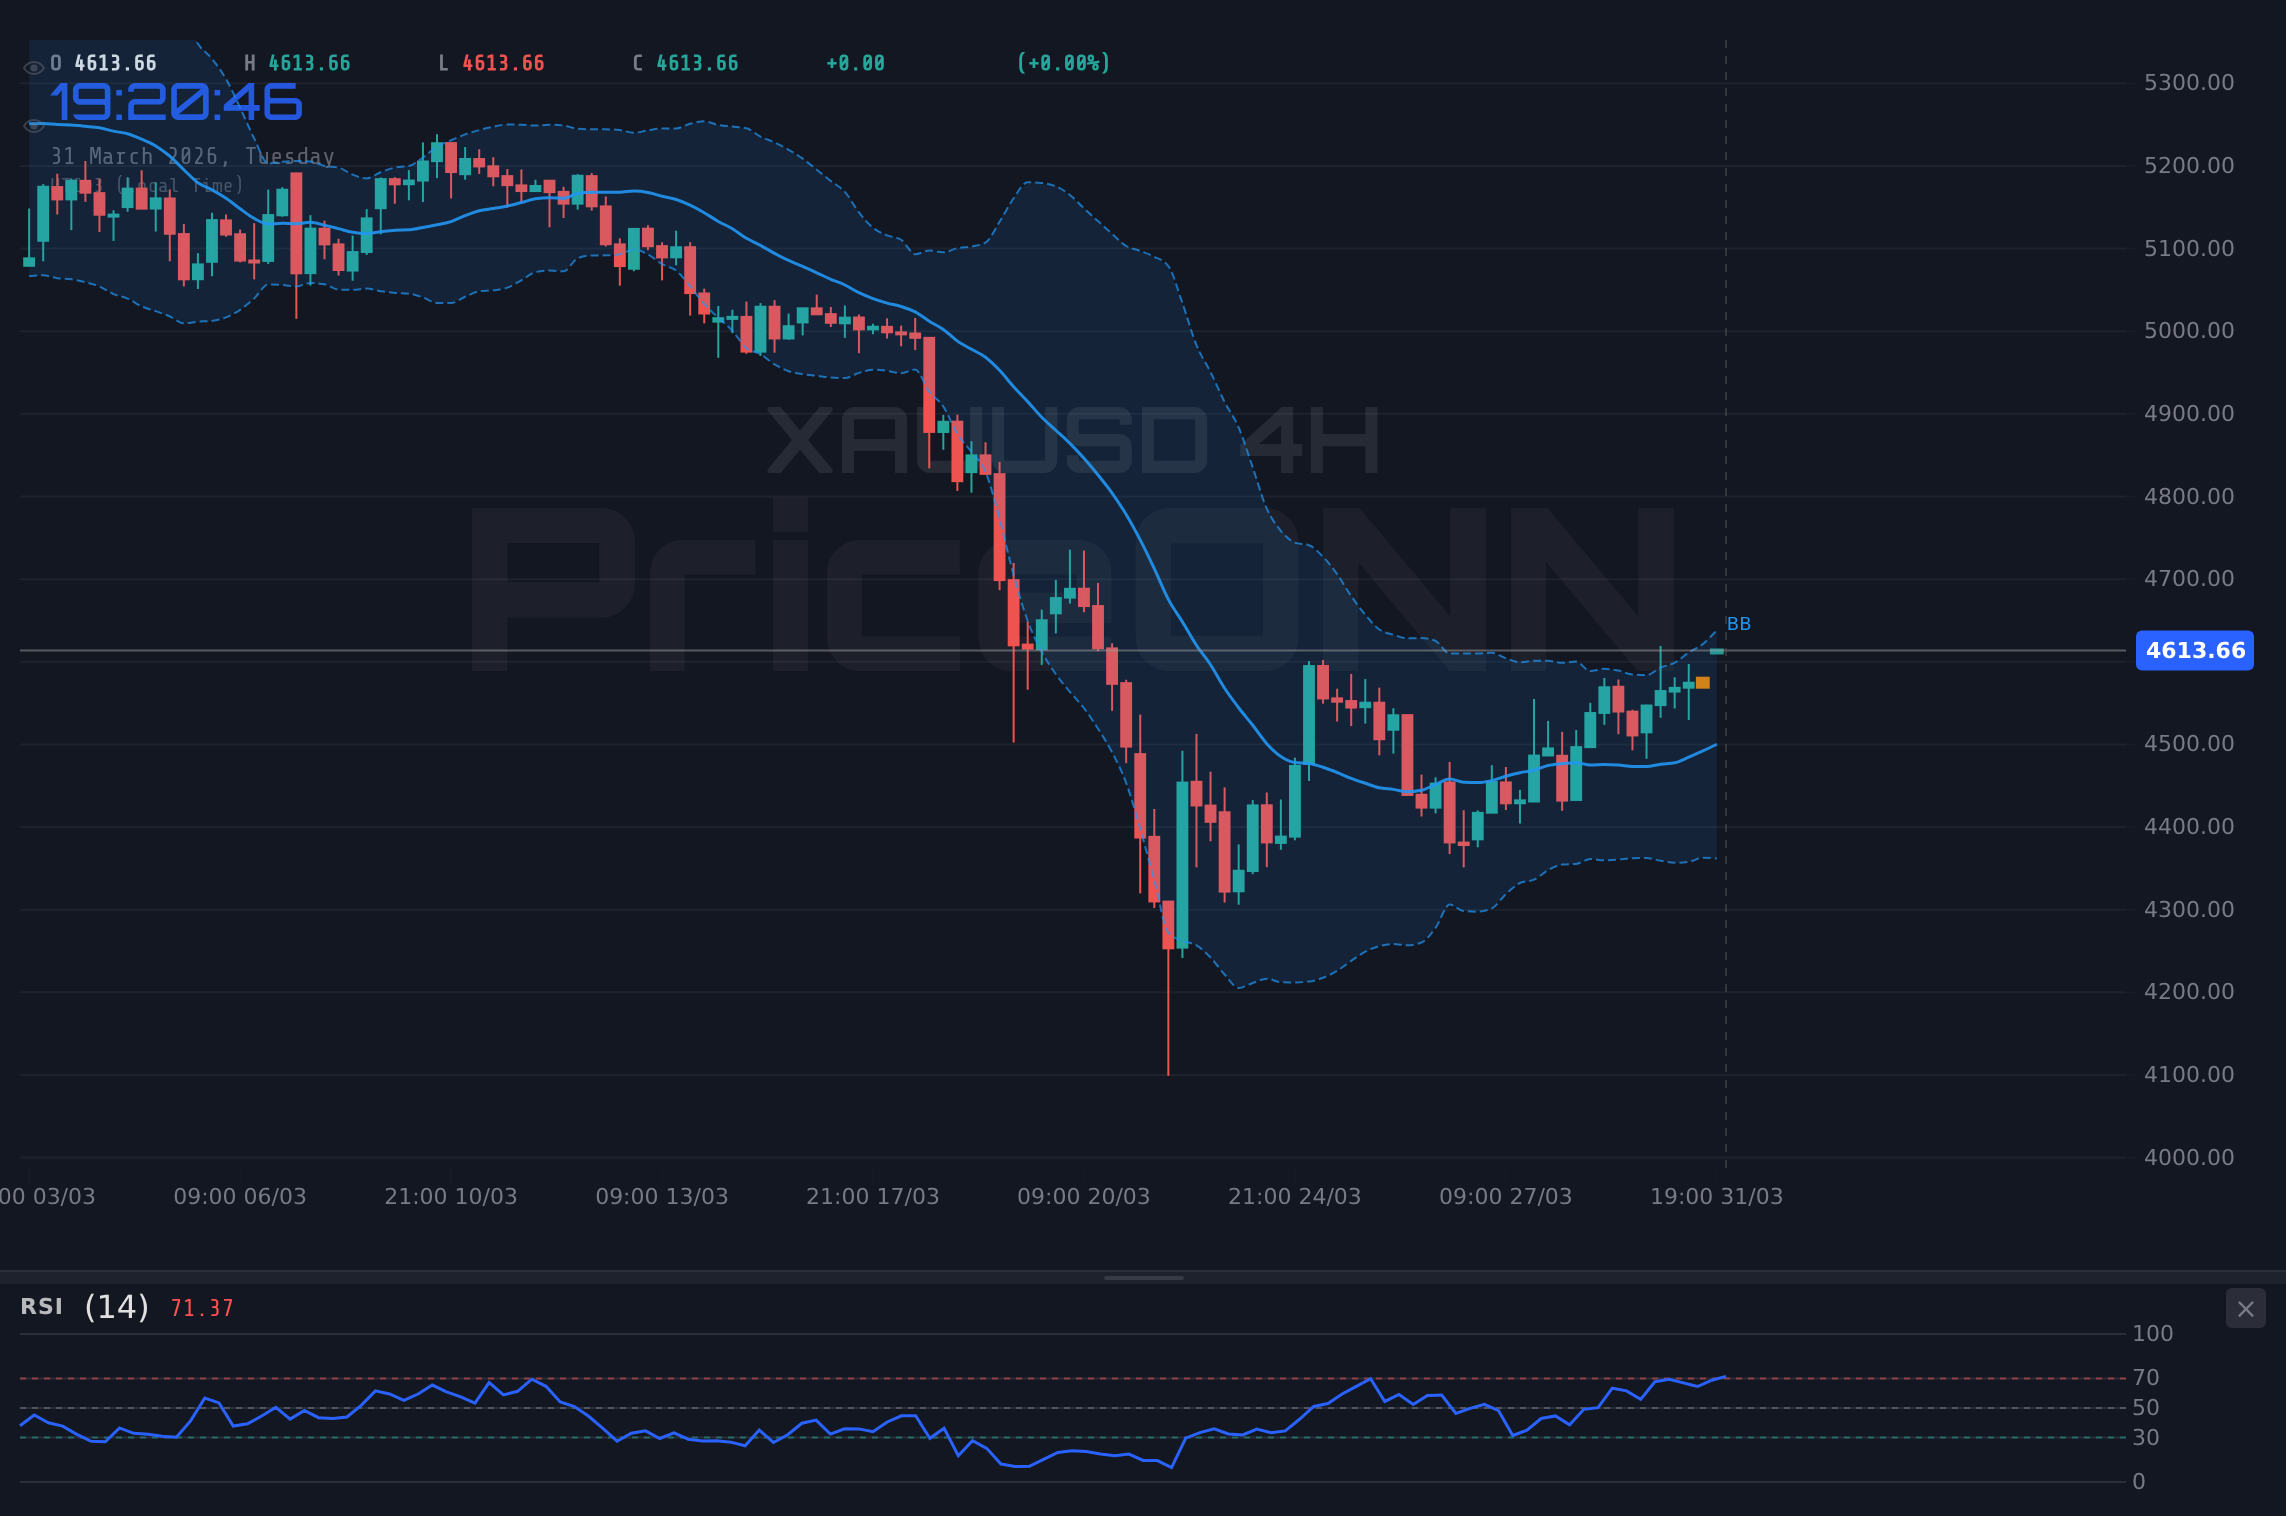
The 4-hour chart presents a more mixed outlook. The trend is neutral with a 50% power rating. The RSI at 46.2 is in neutral territory but trending downwards, while the MACD shows positive momentum. The Stochastic is showing a bullish signal (%K=56.38, %D=69.09), but the ADX at 27.8 indicates a strong downtrend, contradicting the bullish signals from other oscillators. The Bollinger Bands are trading below the middle band, leaning towards a bearish bias. The overall signal is 'SELL' (3 buy, 5 sell, 0 neutral), reflecting the indecision and potential for a downside move. This timeframe suggests that the strength seen on the 1-hour chart might be a temporary correction within a larger bearish structure.
On the daily chart, the narrative is decidedly bearish. The ADX at 49.93 signifies a powerful downtrend. The RSI at 35.74 is oversold, which, in a strong downtrend, often precedes further declines rather than a reversal. The MACD is deeply negative, and the Stochastic (%K=12.7, %D=22.87) is also in oversold territory, confirming the prevailing downward momentum. The Bollinger Bands are below the middle band, reinforcing the bearish sentiment. The 'SELL' signal across the board on this timeframe indicates that the bears are in firm control of the longer-term trend. Any rallies are likely to be met with selling pressure as traders look to exit positions or initiate new shorts.
Key Levels and Potential Price Action
The immediate price action for the Nasdaq 100 revolves around the current trading level of $23,351.10. On the 1-hour chart, the first resistance level is identified at $23,354.91. A decisive break above this level, coupled with sustained buying volume and confirmation from other indicators, could signal a continuation of the short-term bullish move. However, the daily resistance at $23,251.25 looms large. A failure to decisively break through these immediate resistance points could lead to a pullback. The first support level on the 1-hour chart is at $23,146.94, followed by $23,067.29. A break below these levels would likely confirm the bearish sentiment indicated by the longer timeframes.
On the daily chart, the key support level to watch is $22,716.56. A break below this level would confirm the strong bearish trend indicated by the ADX and MACD, potentially opening the door for further declines towards $22,511.48 and even $22,181.87. Conversely, for the bulls to regain control, they would need to not only overcome the immediate resistance around $23,354.91 but also decisively break through the daily resistance at $23,251.25. This would require a significant shift in market sentiment and likely a more supportive macroeconomic backdrop. The confluence of resistance on the daily chart and the strong bearish signals suggests that upside potential may be limited in the short term.
Trade Scenarios: Navigating the Uncertainty
Bearish Scenario: Trend Continuation
65% ProbabilityNeutral Scenario: Consolidation Around Current Levels
25% ProbabilityBullish Scenario: Short-Term Rebound
10% ProbabilityMacroeconomic Winds and Fed's Shadow
The macroeconomic environment continues to cast a long shadow over the Nasdaq 100. The current DXY level of 99.99, coupled with its strong daily uptrend, suggests that the US dollar remains a favored safe-haven asset. This is particularly relevant given the ongoing geopolitical tensions in the Middle East, which have pushed Brent Crude prices above $110. This energy price surge fuels inflation concerns, creating a complex dilemma for the Federal Reserve. While the Fed aims to control inflation, signs of economic slowdown, as indicated by the bearish trend in the S&P 500 and Nasdaq 100's daily charts, might temper its hawkish resolve. The lack of specific high-impact economic data releases today (March 31st) means that market sentiment and geopolitical developments will likely dominate price action. However, upcoming data releases, particularly those related to inflation and employment in the following week, will be crucial in shaping the Fed's policy path and, consequently, the Nasdaq 100's direction.
The correlation between the Nasdaq 100 and broader market risk sentiment is undeniable. With the S&P 500 showing a strong daily downtrend, it underscores a prevailing risk-off sentiment. This makes the short-term bullish signals on the Nasdaq 100's 1-hour chart appear more like a temporary counter-trend move rather than the start of a sustainable rally. Investors are likely weighing the potential for continued inflation and restrictive monetary policy against the resilience shown by some tech sectors. The fact that the Nasdaq 100 itself exhibits a strong daily downtrend (ADX 49.93) reinforces the idea that any rallies are likely to be sold into until a more definitive shift in macro-economic conditions or Fed policy occurs. Patience and risk management are paramount for traders navigating this environment.
The Path Forward: Strategy and Risk Management
For traders operating on shorter timeframes, the Nasdaq 100 at $23,351.10 presents a challenging but potentially rewarding environment. The 1-hour chart offers tactical opportunities for short-term trades, provided strict risk management is employed. A break above $23,354.91 could signal a continuation of the intraday rally, targeting $23,483.23. However, the high probability bearish scenario, triggered by a close below $23,146.94, suggests that downside risk is more pronounced. This is further validated by the strong bearish signals on the daily timeframe, where the index is already in a significant downtrend. The neutral scenario, with price consolidating between $23,146.94 and $23,354.91, also highlights the current indecision in the market.
Longer-term investors should pay close attention to the daily chart's bearish trend. The oversold RSI at 35.74 on this timeframe, while historically suggesting a potential reversal, is often a sign of capitulation within a strong downtrend. A true bullish reversal would likely require a decisive break above the daily resistance at $23,251.25, followed by confirmation from improving macroeconomic data and a shift in Fed policy expectations. Until then, the prevailing trend suggests caution. The interplay between the strong dollar, elevated oil prices, and the potential for persistent inflation creates a complex risk landscape. Disciplined trading, focusing on clear setups, and adhering to stop-loss levels will be crucial for navigating the volatility ahead. The market's ability to hold above the critical daily support at $22,716.56 will be a key determinant of whether the current downtrend continues or if a more significant correction is on the horizon.
Frequently Asked Questions: Nasdaq100 Analysis
What happens if Nasdaq100 breaks below the $23,146.94 support level?
A break below $23,146.94 on the 1-hour chart would invalidate the short-term bullish bias and trigger the bearish scenario. This could lead to a decline towards the next key support at $22,716.56, aligning with the strong downtrend indicated by the daily chart's ADX of 49.93.
Should I buy Nasdaq100 at current levels of $23,351.10 given the RSI at 59.96?
Buying at current levels carries significant risk. While the 1-hour RSI at 59.96 is neutral, the daily RSI at 35.74 is oversold within a strong downtrend. A more prudent approach would be to wait for a confirmed break above daily resistance at $23,251.25, or a more compelling setup after a pullback to support levels.
Is the ADX reading of 49.93 on the daily chart a sell signal for Nasdaq100?
Yes, an ADX reading of 49.93 on the daily chart indicates a very strong trend. Combined with negative MACD momentum and oversold Stochastic, this strongly suggests a prevailing bearish trend, making rallies opportunities for sellers rather than buyers.
How will the strong DXY at 99.99 affect Nasdaq100's outlook this week?
The strong DXY, currently at 99.99 and trending higher, typically exerts downward pressure on risk assets like the Nasdaq 100. This inverse correlation suggests that continued dollar strength could hinder any significant upside moves in the index, especially if geopolitical tensions persist.
Technical Outlook Summary
| Indicator | Value | Signal | Interpretation |
|---|---|---|---|
| RSI (14) | 35.74 | Sell | Oversold on Daily, but strong downtrend may extend. |
| MACD Histogram | -155.20 | Bearish | Negative momentum confirms daily downtrend. |
| Stochastic | 12.70 / 22.87 | Bearish | Strong downtrend signal, %K below %D and oversold. |
| ADX | 49.93 | Strong Trend | Confirms a very strong prevailing trend (downtrend). |
| Bollinger | Middle Band | Below | Price trading below the middle band indicates bearish pressure. |
Track markets in real-time
AI-powered analysis, technical indicators and real-time price data.
Join Our Telegram Channel
Breaking market news, AI analysis and trading signals instantly.
Join Channel