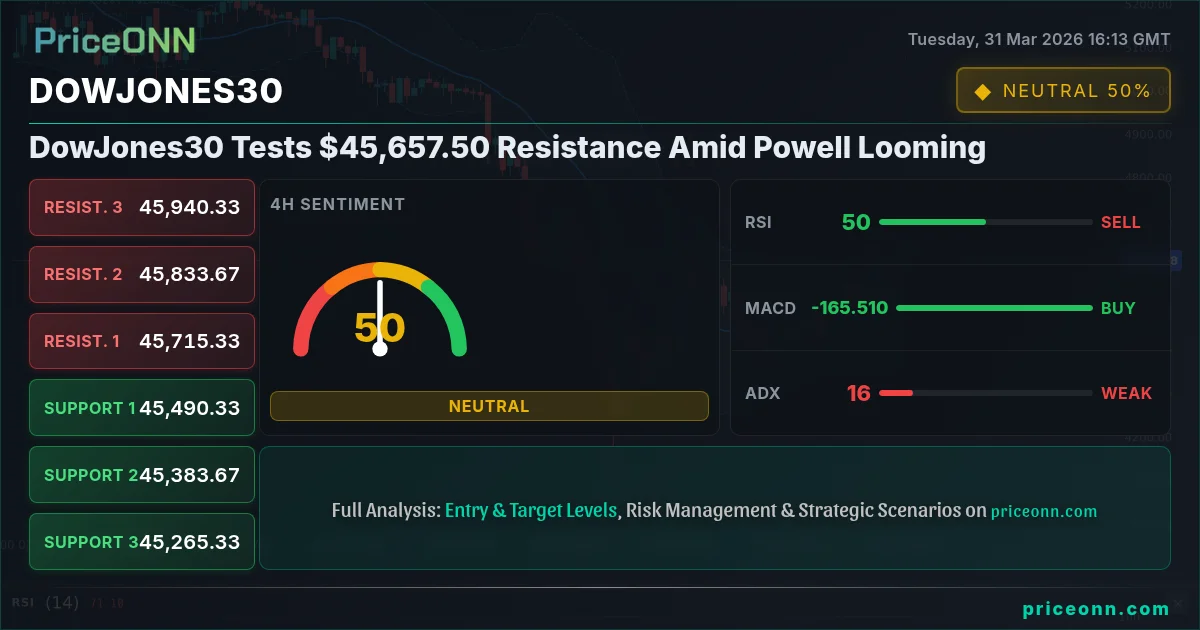
DowJones30 Tests $45,657.50 Resistance Amid Powell Looming
DowJones30 hovers near $45,657.50 resistance as inflation fears resurface and Powell's speech approaches. Key levels to watch.
The financial markets are holding their breath. All eyes are on the Dow Jones Industrial Average as it approaches a critical resistance level around $45,657.50. This isn't just another technical chart pattern; it's a confluence of mounting inflationary pressures, a strengthening US Dollar, and the ever-present anticipation of Federal Reserve Chair Jerome Powell's upcoming remarks. The question on every trader's mind is whether the index can push through this barrier or if it will face a significant pullback. Understanding the cross-market dynamics at play is crucial for navigating this complex landscape.
- The Dow Jones Industrial Average is currently trading at $45,657.50, testing key resistance.
- RSI at 53.95 on the 1H chart signals rising upward momentum, but ADX at 18.8 indicates a weak trend, suggesting caution.
- Critical resistance is observed at $46,182.33, while support lies around $44,973.33.
- Rising DXY levels (currently 99.99) and oil prices (Brent at $110.82) are amplifying inflation concerns, potentially influencing Fed policy.
The current market environment is a delicate balancing act. On one hand, we have a Dow Jones Industrial Average that has shown remarkable resilience, pushing towards new highs. The 1-hour chart paints a picture of bullish momentum, with the Relative Strength Index (RSI) at 53.95, indicating growing buying interest. The MACD is also showing positive momentum, trading above its signal line. However, the Average Directional Index (ADX) at 18.8 on the same timeframe paints a different story; it suggests a weak trend, implying that the current upward move might lack conviction and could be susceptible to a reversal. This divergence between momentum indicators and trend strength is a classic sign of a market that is consolidating or preparing for a significant move, but the direction remains uncertain.
Adding to this complexity is the broader macroeconomic backdrop. The US Dollar Index (DXY), currently trading around 99.99, is showing signs of strength on the 4-hour and daily charts, with ADX readings of 28.79 and 32.94 respectively. A stronger dollar typically exerts downward pressure on global equities and commodities, including gold and oil. This inverse correlation is a critical factor to monitor. Brent crude oil, for instance, is trading at $110.82, and WTI at $105.09. These elevated energy prices, driven by geopolitical tensions in the Middle East as reported by sources like Reuters and Bloomberg, are a significant contributor to renewed inflation fears. This inflationary pressure is precisely what the Federal Reserve has been trying to tame, and it complicates their policy decisions.
The Federal Reserve's stance, particularly Chair Jerome Powell's upcoming speech, looms large over market sentiment. Traders are scrutinizing every piece of economic data for clues about the Fed's next move. Recent economic releases, though not detailed in the provided calendar for today, have generally pointed towards persistent inflation, even as employment figures might show some cooling. The market is pricing in a complex scenario where the Fed might need to maintain a hawkish stance for longer than initially anticipated, or even consider further tightening if inflation proves to be more stubborn. This uncertainty is reflected in the mixed signals across different timeframes for the Dow Jones itself.
On the daily chart, the picture for the Dow Jones Industrial Average becomes more bearish, with an ADX reading of 43.03 indicating a strong downward trend. The RSI at 35.46 suggests a move into oversold territory, and the MACD is firmly in negative momentum, below its signal line. This stark contrast between the short-term bullish signals and the longer-term bearish trend highlights the current market's indecisiveness. It's a tug-of-war between immediate buying pressure and underlying structural concerns about inflation and monetary policy. The key support level on the daily chart is identified around $43,935, a significant distance from the current price, while resistance is seen closer at $45,635, followed by $46,071.
The correlation with other major indices also provides valuable context. The S&P 500 is currently trading at 6430, showing a daily gain of 1.43%, and the Nasdaq 100 is at 23305.15, up 1.67%. Both indices exhibit bullish momentum on the 1-hour charts, mirroring the Dow Jones' short-term strength. However, their daily charts present a similar cautionary tale: strong downward trends indicated by ADX readings above 40, with RSI values below 40. This suggests that the recent upward moves might be short-lived retracements within a larger downtrend, or perhaps a bear market rally. The strength in these indices, despite the underlying bearish signals on longer timeframes, could be attributed to short-covering or a temporary easing of risk-off sentiment, which is a fragile condition.
The energy markets, as mentioned, are a significant wildcard. Brent crude oil's resilience above $110, despite various geopolitical reports, underscores the persistent supply-side risks. This is a direct inflationary driver that cannot be ignored. If oil prices continue to climb, it will only intensify the pressure on central banks to maintain a tighter monetary policy. This, in turn, would likely weigh on equity markets, including the Dow Jones, as higher borrowing costs and reduced consumer spending become more probable. Traders are closely watching the $110.82 level for Brent and $105.09 for WTI, as sustained strength here could signal a broader economic headwind.
Considering the foreign exchange market, the EUR/USD pair is currently trading at 1.15169. While it shows some upward momentum on the 1-hour chart, the daily timeframe reveals a strong downtrend with an ADX of 34.63. Similarly, GBP/USD at 1.31833 and AUD/USD at 0.68537 are also showing signs of weakness on longer timeframes, despite some short-term fluctuations. The Japanese Yen, USD/JPY, is trading around 159.135, showing a daily downtrend, which often correlates with a strengthening safe-haven appeal or intervention fears by the Bank of Japan. The overarching narrative here is one of USD strength, driven by either risk aversion or the prospect of higher-for-longer interest rates, which is a headwind for global risk assets.
The technical picture for the Dow Jones Industrial Average, therefore, is one of significant tension. The short-term indicators suggest a potential for further upside, targeting resistance levels around $46,071 and $46,485. However, the longer-term daily trend, coupled with the broader macroeconomic environment of rising inflation, a strong dollar, and cautious central bank policy, presents a substantial risk of a reversal. The ADX on the daily chart at 43.03 is a strong signal that a well-defined downtrend is in place, and the current price action might just be a pause before further declines. The RSI at 35.46, while oversold on the daily, doesn't preclude further downside in a strong trend.
The key levels to watch are paramount. On the upside, breaking decisively above the $45,635 resistance, and more importantly, the $46,071 level, would be necessary to challenge the prevailing bearish daily trend. This would likely require a shift in market sentiment, perhaps driven by dovish signals from the Fed or a de-escalation of geopolitical tensions. Conversely, failure to hold the current price action and a subsequent break below the $44,973.33 support level would confirm the bearish thesis. Further downside targets would then include $44,785, $44,371, and potentially lower if the downtrend gains significant momentum.
The market sentiment, often gauged by risk appetite, is currently mixed. While the short-term moves in indices like the S&P 500 and Nasdaq suggest a degree of risk-on behavior, the underlying inflationary pressures and the Fed's hawkish leanings create a precarious balance. Geopolitical shocks, such as the ongoing Middle East conflict and its impact on oil prices, continue to fuel uncertainty. This environment typically favors safe-haven assets, which could indirectly pressure the Dow Jones if capital starts to flow away from riskier equities. The resilience of oil prices above $110 for Brent crude, as noted by energy market analysis, is a constant reminder of these underlying inflationary risks.
From a trader's perspective, the current setup on the Dow Jones Industrial Average demands caution and a well-defined risk management strategy. The conflicting signals across different timeframes mean that a breakout above the $45,657.50 mark could be a bull trap, or a failure to hold current levels could lead to a sharp decline. The ADX on the daily chart remains a significant warning sign, indicating that the market is in a strong trend, and the current price action might be a mere pause. Patience is key; waiting for clearer confirmation of a sustained move, either above the critical resistance or below the support, is advisable rather than chasing the current price action.
The upcoming economic calendar, though sparse on immediate high-impact events today, will become increasingly important as the week progresses. Any data releases that suggest a persistent inflationary trend or a weakening labor market could significantly influence Fed expectations and, consequently, market direction. The market's reaction to Powell's speech will be a major determinant of short-term sentiment. If he maintains a hawkish tone, citing inflation concerns, it could easily trigger a sell-off in risk assets like the Dow Jones, confirming the bearish signals on the daily chart.
In essence, the Dow Jones Industrial Average is at a pivotal juncture, trading at $45,657.50 and testing resistance. While short-term momentum is present, longer-term technicals and the macroeconomic environment, dominated by inflation fears and the Fed's policy outlook, suggest a cautious approach is warranted. The interplay between the dollar, oil prices, and central bank rhetoric will be the defining factors in the coming days. Successfully navigating this period will require a keen eye on risk management and a disciplined adherence to trading plans, waiting for clear signals rather than guessing market direction.
Frequently Asked Questions: DowJones30 Analysis
What happens if DowJones30 breaks below $44,973.33 support?
A break below $44,973.33 would validate the bearish daily trend, with potential targets at $44,785 and $44,371 as the ADX suggests strong downward momentum.
Should I buy DowJones30 at current levels of $45,657.50 given the weak trend signal?
Given the weak trend signal (ADX 18.8 on 1H) and conflicting daily signals, caution is advised. Waiting for a clear breakout above $46,182.33 or a confirmed breakdown below support is a more prudent approach.
Is the RSI at 53.95 a buy signal for DowJones30 right now?
The RSI at 53.95 on the 1-hour chart indicates rising momentum, but it's not yet in overbought territory. This signal should be considered alongside the weaker trend strength indicated by the ADX, suggesting it might be a temporary upward move.
How will Powell's speech affect DowJones30 this week?
If Powell reiterates a hawkish stance on inflation, it could trigger a risk-off move, potentially pushing the Dow Jones below current support levels as markets price in higher-for-longer interest rates.
Track markets in real-time
AI-powered analysis, technical indicators and real-time price data.
Join Our Telegram Channel
Breaking market news, AI analysis and trading signals instantly.
Join Channel