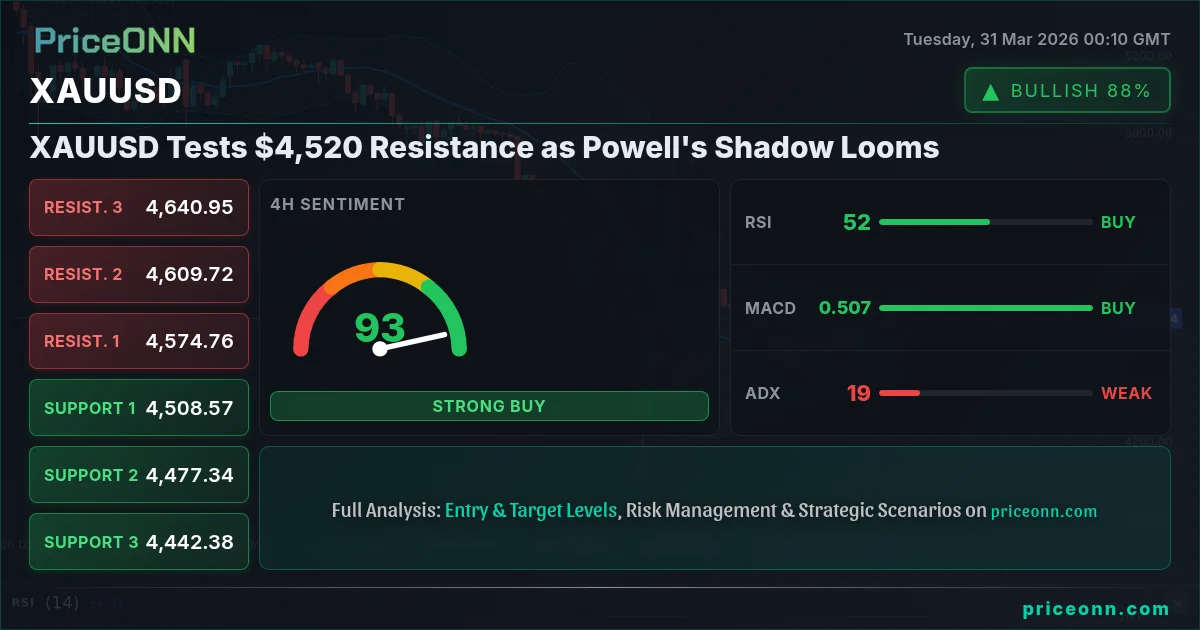
XAUUSD Tests $4,520 Resistance as Powell's Shadow Looms
Gold hovers near $4,520.83 amid mixed signals. With the Fed's next move uncertain, traders eye key levels and DXY movements.
Now this is where it gets interesting! Gold, or XAUUSD as we call it in the trading pits, has been doing something the bulls have been waiting months for: it's pushing towards resistance levels. As of the latest data, we're looking at a price of $4,520.83. This isn't just a random number; it's a significant hurdle that could dictate the next leg of the yellow metal's journey. But before we get too excited, we need to acknowledge the elephant in the room: the looming presence of Federal Reserve Chair Jerome Powell and the uncertainty surrounding future monetary policy. This dance between inflation hedges, risk appetite, and central bank hawkishness is what makes analyzing gold so captivating right now.
- RSI at 52.65 on the 1H chart signals neutral momentum with a slight upward lean, indicating bulls are not yet exhausted but lack strong conviction.
- Critical resistance sits at $4,543.65, a level that has historically capped rallies and now serves as the immediate barrier to further upside.
- The ADX at 19.01 across multiple timeframes suggests a lack of strong trend, implying choppy price action until a clear catalyst emerges.
- Fed rate expectations, reflected in DXY movements currently at 100.41, are a major driver, with dollar strength typically pressuring gold prices.
The XAUUSD today analysis reveals a market at a crucial juncture. While the price has edged higher, the underlying technical signals are far from a clear buy signal. On the 1-hour chart, the Relative Strength Index (RSI) sits at 52.65, which is firmly in neutral territory but shows a slight upward inclination. This suggests buyers are present but aren't overwhelming the market. The MACD indicator, however, paints a slightly more cautious picture, showing negative momentum with the MACD line below its signal line. This often precedes a period of consolidation or a slight pullback. The Stochastic Oscillator, on the other hand, is giving a bullish signal with %K above %D at 28.63/20.58, but this is in the lower range, indicating potential for upward movement without immediate overbought conditions.
What's really telling, though, is the ADX reading across the board. On the 1-hour, 4-hour, and even daily charts, the Average Directional Index (ADX) hovers around 17-32. Readings below 20 typically indicate a weak or non-existent trend, suggesting that the current price action is more range-bound than directional. An ADX above 25 signifies a strong trend, and we are not quite there yet on the shorter timeframes, although the daily chart shows a more robust 32.3. This lack of a defined trend means that any move higher could be met with profit-taking, and any dip could be seen as a buying opportunity – a trader's playground, perhaps, but risky for the uninitiated. The overall signal on the 1-hour chart leans towards 'BUY' (5 buys, 3 sells), but this is heavily influenced by the Stochastic reading. The 4-hour chart also shows a 'BUY' signal (7 buys, 1 sell), driven by a more favorable Stochastic and MACD position.
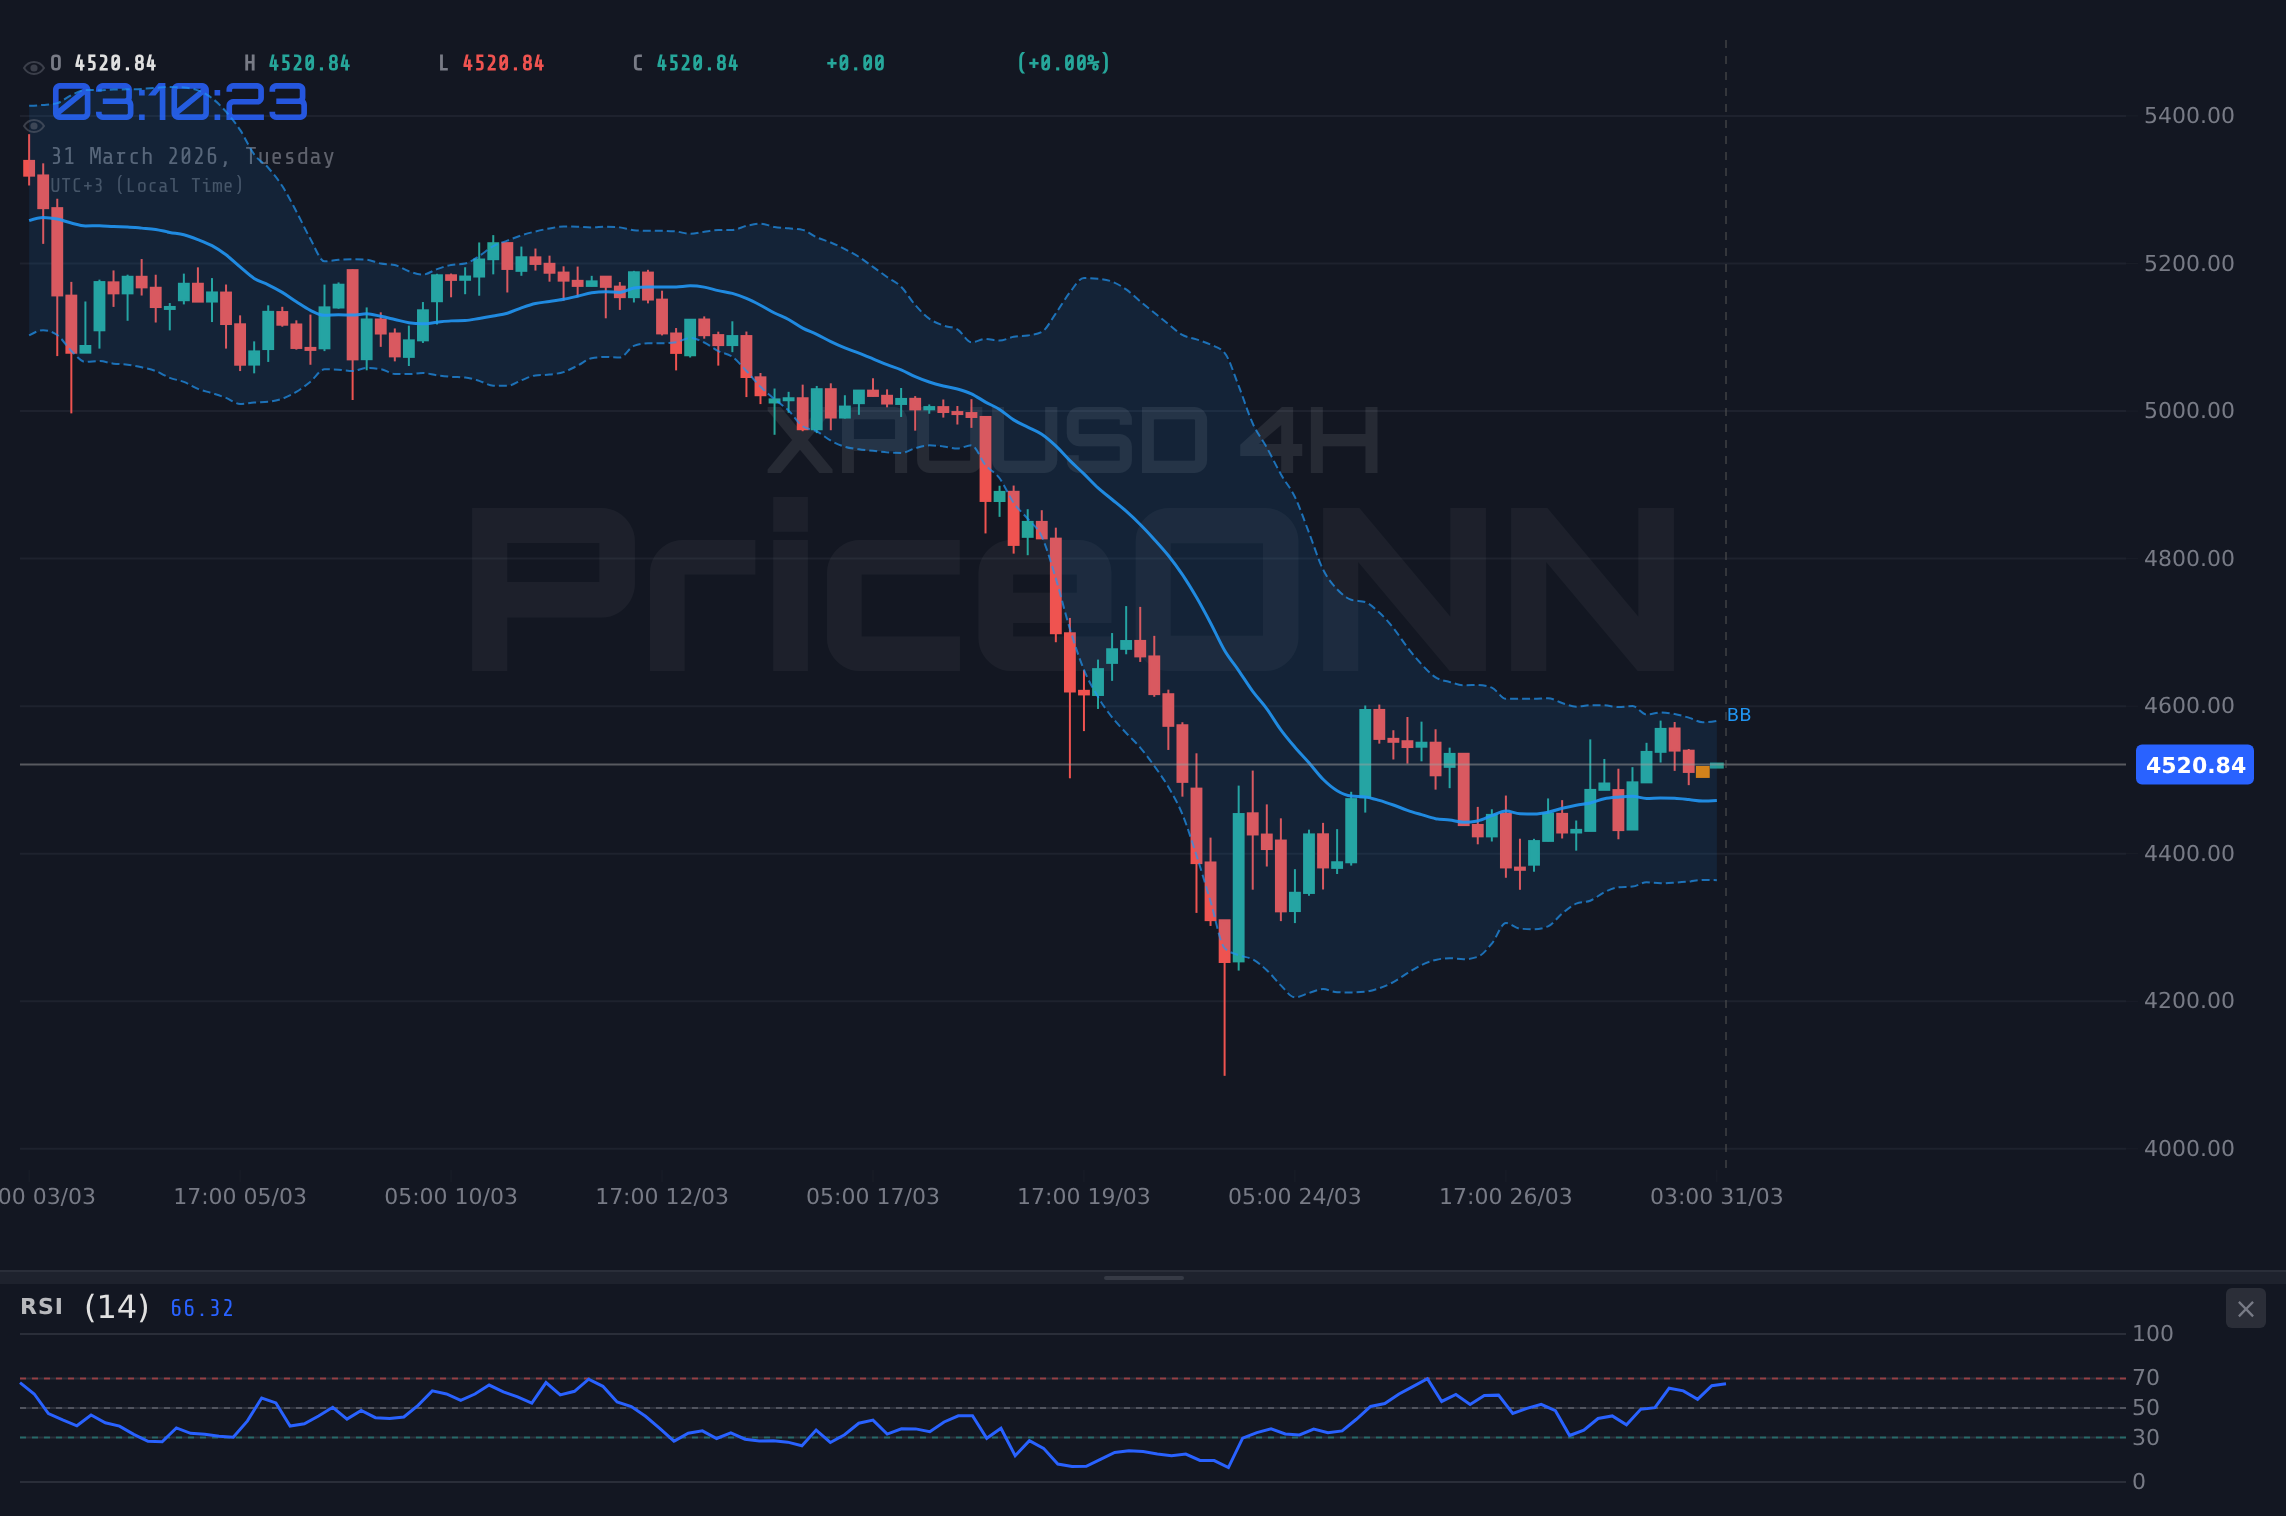
However, we cannot ignore the daily perspective. The XAUUSD trend analysis on the daily timeframe paints a decidedly different picture: a strong downtrend with an ADX of 32.3. The Daily RSI is at 37.7, still in neutral territory but trending down, and the MACD is showing negative momentum. Bollinger Bands on the daily are also below the middle band, indicating downward pressure. This conflict between the shorter-term bullish signals and the longer-term bearish trend is the core of the current market's indecision. It's a classic case of conflicting indicators, where the market is trying to find its footing after a period of decline. The daily signal is a strong 'SELL' (2 buys, 6 sells), which adds a significant layer of caution to any bullish aspirations.
This divergence across timeframes is precisely why patience is crucial. The market is whispering, not shouting, its next direction. For scalpers and short-term traders, the 1-hour and 4-hour charts might offer fleeting opportunities, but the daily trend suggests any rally is likely to face significant headwinds. The immediate resistance level to watch is $4,522.21 on the 1-hour chart, followed by $4,533.63 and $4,543.65. If gold can decisively break and hold above these levels, particularly $4,543.65, it would start to challenge the daily downtrend narrative. Conversely, failure to break these levels and a slip back below the 1-hour support at $4,500.77 could signal a continuation of the broader sell-off, targeting the 4-hour support at $4,508.57 and potentially lower.
Let's zoom out and consider the broader market context. The Dollar Index (DXY) is currently at 100.41, showing a strong upward trend on its daily chart (ADX 32.75). A strengthening dollar typically acts as a headwind for gold, as they often have an inverse relationship. When the dollar gains strength, commodities priced in dollars become more expensive for holders of other currencies, potentially dampening demand. The DXY's surge of 0.62% today, with RSI at a very high 80.4, suggests it might be nearing overbought territory on the shorter timeframes, which could offer some temporary relief for gold. However, the overall daily trend for the dollar is firmly bullish, indicating underlying strength that could continue to cap gold's upside potential.
The equity markets are also sending mixed signals. The S&P 500 is trading at 6,329.3, down 0.44% today, with a strong daily downtrend (ADX 49.01). Similarly, the Nasdaq 100 is down 0.98% at 22,865.76, also showing a strong daily downtrend (ADX 47.26). This risk-off sentiment in the major US indices usually correlates with increased demand for safe-haven assets like gold. However, the current data shows gold is trading slightly higher, but not with the explosive momentum one might expect if it were acting purely as a safe haven against a significant equity sell-off. This suggests that other factors, perhaps inflation concerns or specific geopolitical events, are currently outweighing the typical risk-off safe-haven bid for gold. The fact that gold is showing a 'BUY' signal on its 4-hour chart despite the equity market's woes is a point of interest.
Geopolitical tensions, as highlighted in recent news, are undoubtedly playing a role. Reports of escalating Middle East conflict directly impacting global fuel prices and Bangladesh seeking Russian diesel amidst a global energy shock add to the underlying inflationary pressures. Higher energy prices often translate to higher inflation expectations, which historically benefits gold as an inflation hedge. This macro backdrop provides a fundamental tailwind for gold, even if the technical indicators are currently conflicted. The news that central banks are reportedly ramping up gold holdings, with some analysts even targeting $5,000, suggests a long-term bullish thesis supported by institutional buying. However, the immediate price action must be respected.
Now, let's talk about what needs to happen for gold to truly break out of this indecisive phase. The XAUUSD key levels are critical here. On the daily chart, the first major resistance is at $4,574.91. A decisive close above this level, supported by increasing volume and clearer bullish signals across multiple timeframes (especially a daily ADX climbing above 25), would be a strong indication that the downtrend is reversing. This would likely be accompanied by a weakening DXY and potentially a stabilization or recovery in equity markets. Until then, we remain in a 'watch zone'. The current price of $4,520.83 is testing immediate resistance, and its ability to push through the $4,543.65 level on the 1-hour chart will be the first test.
Traders need to understand the 'why' behind the signals. The conflicting signals - bullish Stochastic and RSI on shorter timeframes versus bearish daily trend and MACD - create a 'choppy' environment. This is what the ADX readings of around 17-23 confirm. It means the market is not trending strongly in either direction. For those looking to enter a trade, the current situation demands extreme caution. A 'WATCH_ZONE' recommendation is appropriate here because the risk/reward is not yet favorable for a strong directional bet. We need confirmation. What confirmation? A clear break and hold above the daily resistance of $4,574.91 would be the most significant signal. Alternatively, a breakdown below the 4-hour support at $4,508.57, confirmed by a daily close below $4,479.33, would negate any immediate bullish hopes and suggest a move towards the daily support levels.
The upcoming economic calendar also holds potential catalysts. While specific high-impact events for today (March 31st) are not listed as having 'Actual' data, the market is always forward-looking. Investors will be keenly watching for any hints from Fed officials regarding their stance on inflation and interest rates. Any hawkish commentary could strengthen the dollar and pressure gold, while dovish remarks or signs of economic slowdown might bolster gold's safe-haven appeal. The interplay between inflation data, employment figures, and central bank rhetoric will be key in determining whether gold can sustain a move above its current resistance.
Bearish Scenario: Consolidation Below Resistance
65% ProbabilityNeutral Scenario: Range-Bound Volatility
25% ProbabilityBullish Scenario: Breakout Above Daily Resistance
10% ProbabilityFrequently Asked Questions: XAUUSD Analysis
What happens if XAUUSD fails to break above $4,543.65 resistance?
If XAUUSD fails to decisively break above the 1-hour resistance at $4,543.65, expect a continuation of the choppy price action. The bearish scenario becomes more likely, targeting the 4-hour support at $4,508.57, especially if the DXY continues its upward trend.
Should I buy XAUUSD at current levels of $4,520.83 given the mixed signals?
Buying at $4,520.83 right now is risky due to conflicting technical signals across timeframes and the strong daily downtrend. A high-probability setup would require a clear break and hold above $4,574.91, or a confirmed bounce from stronger support levels like $4,508.57, with RSI and MACD confirming the direction.
Is the RSI at 52.65 a buy signal for XAUUSD?
An RSI of 52.65 on the 1-hour chart is considered neutral, leaning slightly bullish but lacking strong conviction. It doesn't represent an immediate buy signal on its own. Confirmation from other indicators like Stochastic showing a strong upward cross and MACD histogram turning positive would be needed, alongside a break of immediate resistance.
How will the Fed's next move affect XAUUSD around $4,520?
Any hint of a hawkish stance from the Fed could strengthen the DXY (currently at 100.41), putting downward pressure on XAUUSD near $4,520. Conversely, dovish commentary or signs of economic cooling could weaken the dollar, potentially allowing gold to break through its resistance levels towards $4,574.91.
Track markets in real-time
AI-powered analysis, technical indicators and real-time price data.
Join Our Telegram Channel
Breaking market news, AI analysis and trading signals instantly.
Join Channel