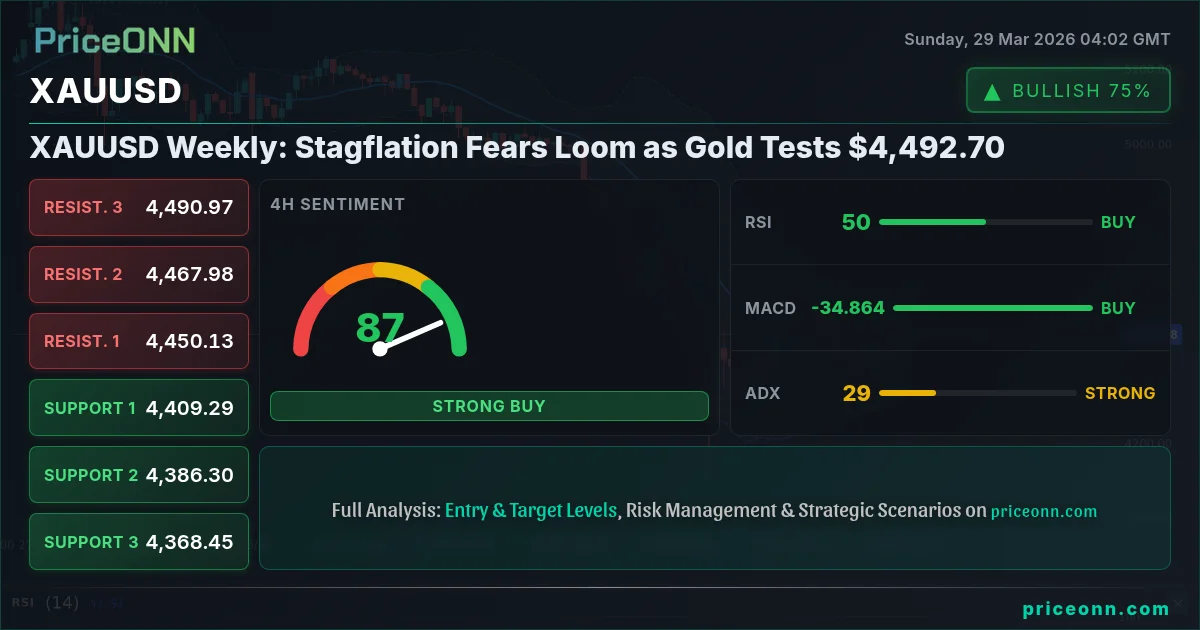
XAUUSD Weekly: Stagflation Fears Loom as Gold Tests $4,492.70
Gold faces headwinds with stagflation fears rising, testing $4,492.70. Key levels and market correlations analyzed for the week ahead.
As the weekend closes, the precious metals market finds itself at a critical juncture. Gold, or XAUUSD as it's known in trading circles, finished last week hovering around the significant $4,492.70 mark. This level, while seemingly just a number, represents a key battleground where the tug-of-war between persistent inflation fears and the growing specter of stagflation is playing out. The past week was marked by considerable volatility, driven by a confluence of geopolitical tensions, shifting central bank expectations, and a renewed focus on the potential for economic stagnation coupled with rising prices. For seasoned analysts like myself, this environment is a stark reminder of the complex interplay between macroeconomics, geopolitical risk, and the fundamental role of gold as both a hedge and a store of value. We are witnessing a market environment that calls for careful observation, a deep understanding of historical precedents, and a disciplined approach to risk management. The current price action, coupled with a dense economic calendar and ongoing geopolitical flare-ups, suggests that the coming week will be far from quiet.
- RSI at 56.12 on the 1H chart suggests neutral momentum with a slight upward bias, while the 1D RSI at 36.2 indicates a bearish trend.
- Critical support for XAUUSD sits at $4,492.65 on the 1H chart, tested multiple times, while the 1D support is further down at $4,304.96.
- The ADX is showing a strong trend on the 4H (28.83) and 1D (30.99) charts, indicating directional conviction despite mixed signals across timeframes.
- The dollar index (DXY) at 99.79 is showing a strong upward trend on 1D, potentially pressuring gold prices if this continues.
Navigating the Crosscurrents: Gold's Dance with Stagflation
The narrative dominating financial markets as we head into this new trading week is the chilling possibility of stagflation. This economic ailment, characterized by stagnant growth, high unemployment, and persistent inflation, is a scenario that investors and central bankers alike dread. The recent surge in oil prices, with Brent crude soaring past $100 and WTI topping $90, is a significant catalyst. This isn't just about higher energy costs at the pump; it's about the ripple effect across the entire global economy. Increased energy prices translate to higher transportation costs, impacting supply chains and pushing up the price of nearly every good and service. We saw this reflected in the recent economic data, where the USD release for an unspecified indicator came in at 210 against a forecast of 211, a slight miss that, in a fragile economic environment, can be interpreted negatively, signaling a potential slowdown. This inflationary pressure, combined with concerns about slowing economic activity, creates a complex environment for monetary policy. Central banks are caught in a bind: tightening policy too aggressively could choke off growth, while easing too much could exacerbate inflation. This dilemma inherently supports gold's appeal as a hedge against both currency debasement and economic uncertainty.
The correlation between gold and the US Dollar Index (DXY) is always a crucial factor to monitor. Last week, the DXY showed a strengthening trend, particularly on the daily chart with an ADX of 31.93, indicating a robust upward move. Currently trading around 99.79, a higher dollar typically puts pressure on gold, as it makes the metal more expensive for holders of other currencies. However, the stagflation narrative can complicate this relationship. If the dollar is seen as a safe haven amidst global economic turmoil, it might rise even as gold does, creating a less inverse correlation than usual. This is a critical nuance to watch. The S&P 500 and Nasdaq also experienced significant downturns last week, with the S&P 500 dropping 2.03% to 6355.66 and the Nasdaq 100 falling 2.3% to 23076.09. This risk-off sentiment in the equity markets naturally boosts demand for safe-haven assets, and gold is traditionally at the top of that list. The question, however, is whether the dollar's strength will override gold's safe-haven appeal.
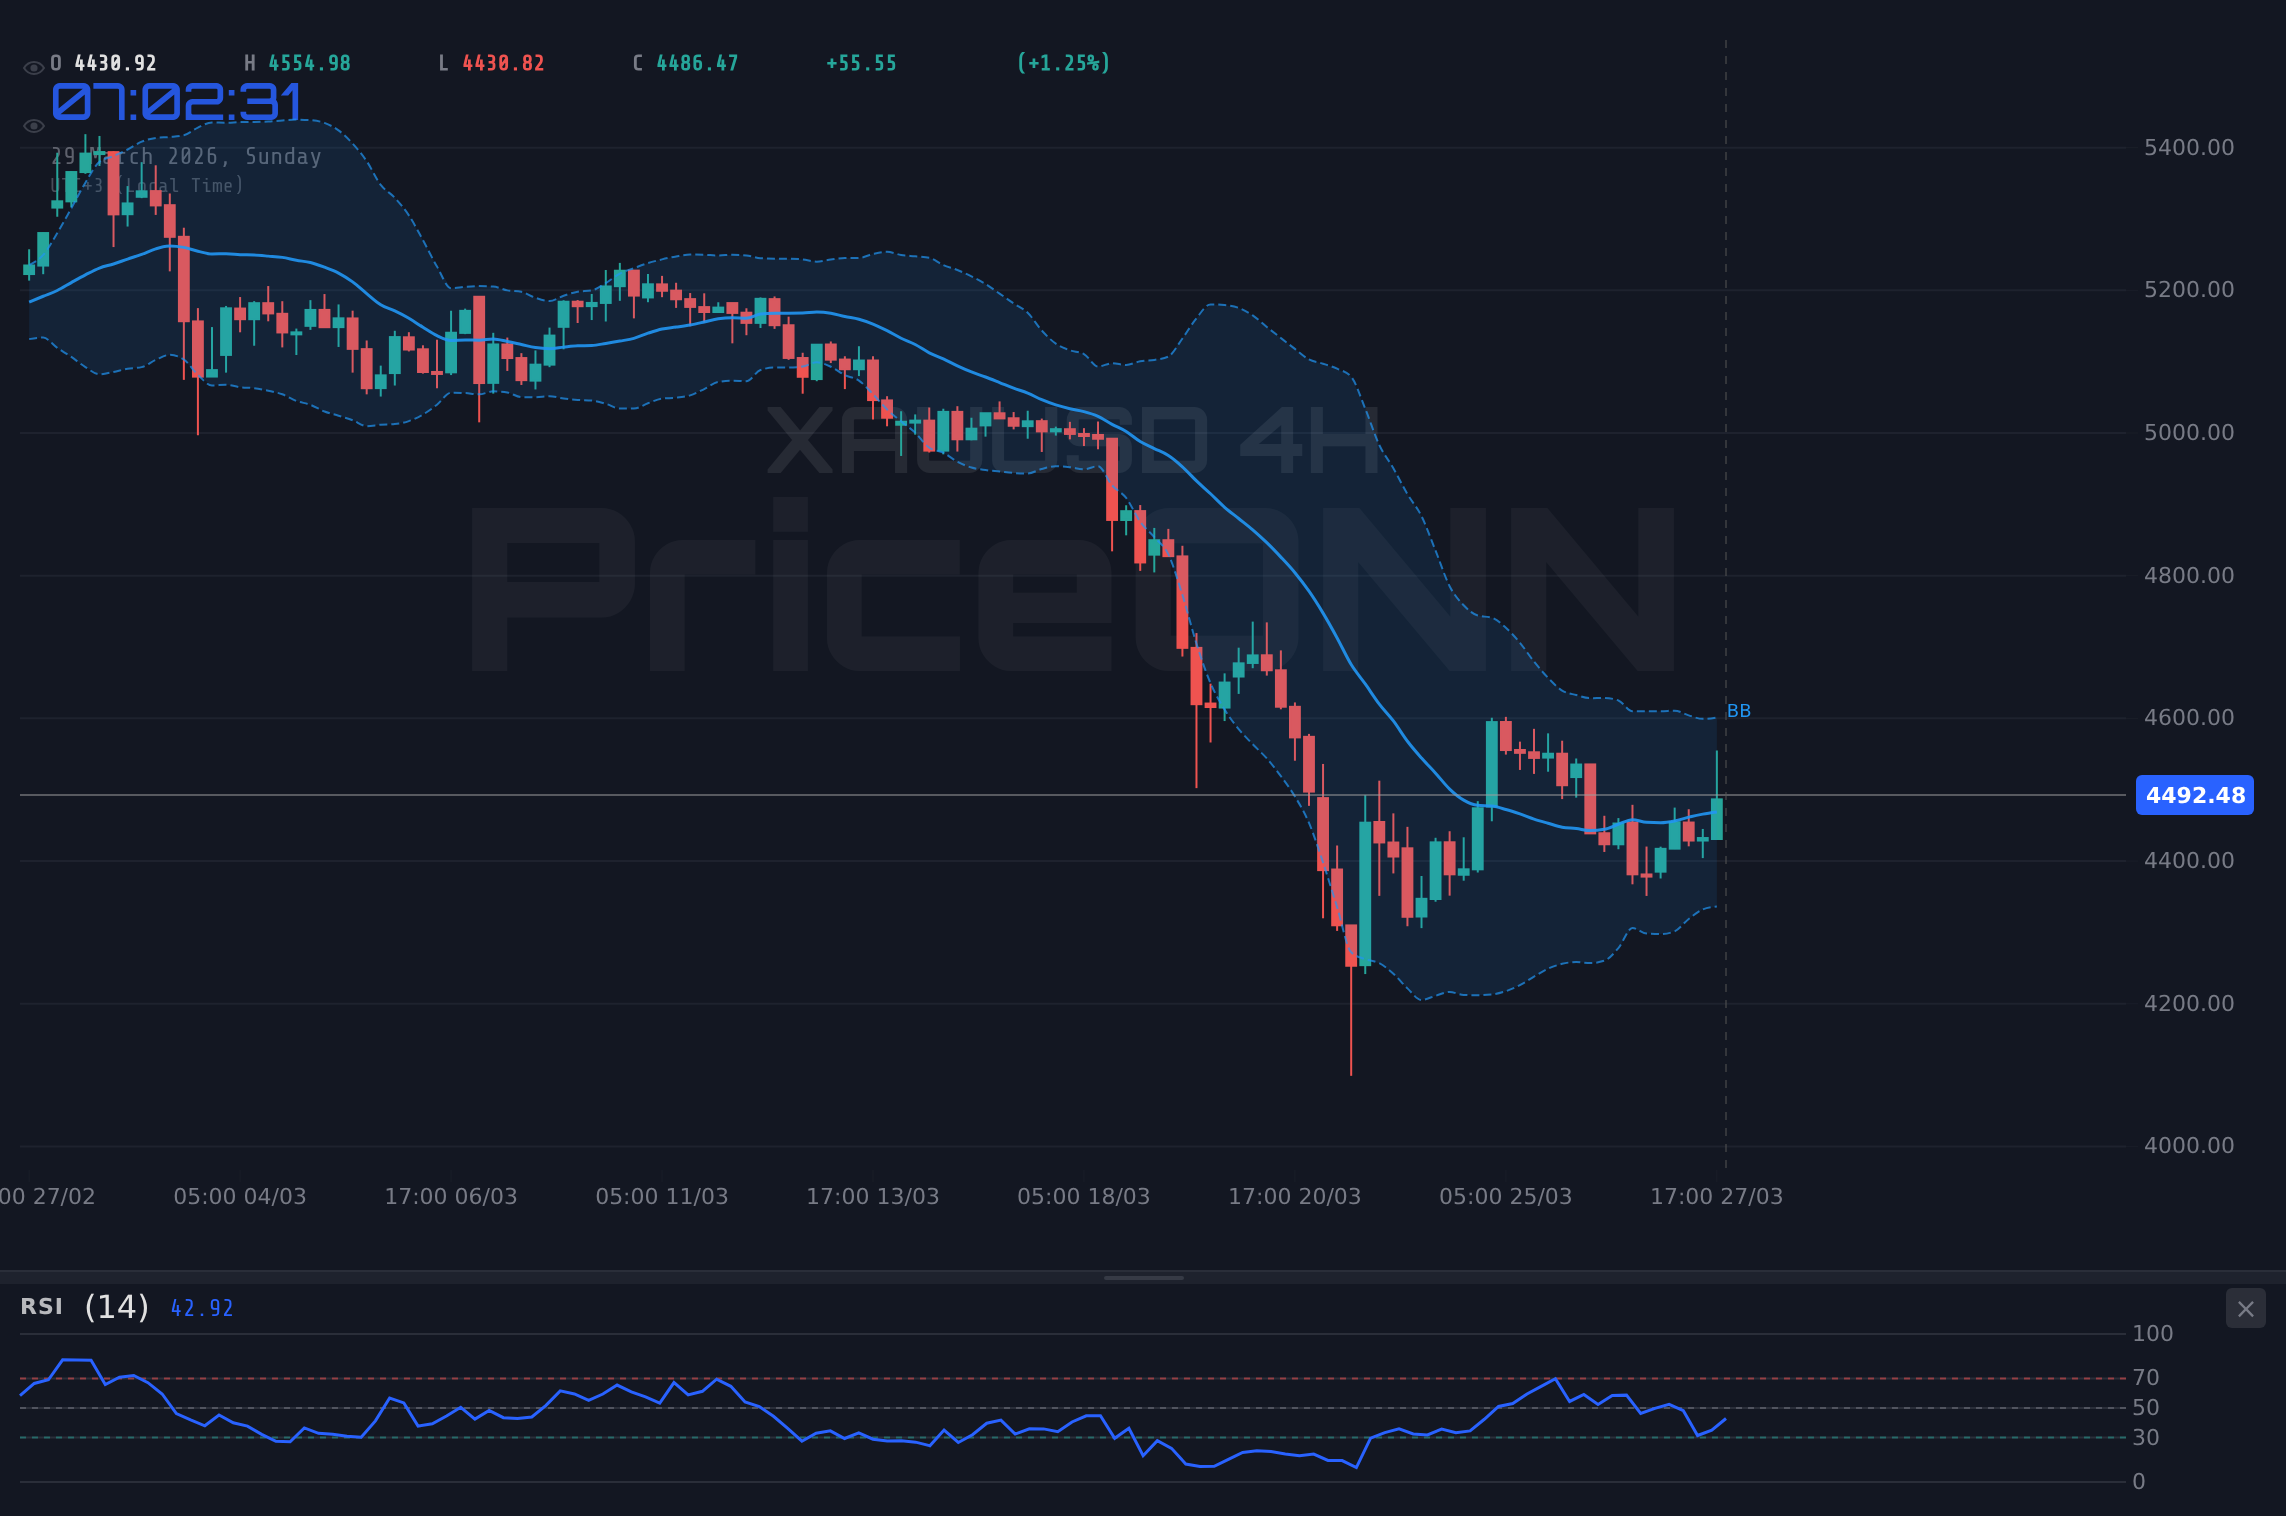
Looking at the technicals for XAUUSD across different timeframes, we see a fascinating divergence. The 1-hour chart presents a neutral trend with a 50% strength, an RSI of 56.12, and a general buy signal from technical indicators. This suggests short-term traders might be looking for opportunities on the upside, perhaps anticipating a bounce from recent lows. The support level at $4,492.65 is clearly being watched. However, as we zoom out to the 4-hour chart, the trend shifts to bearish with 84% strength, an RSI of 50.32, and a strong ADX of 28.83. This indicates that while intraday traders might see some upside, the medium-term picture is leaning towards a decline. The daily chart reinforces this bearish sentiment even further, with a 90% trend strength, an RSI of 36.2, and a powerful ADX of 30.99. This daily timeframe paints a picture of a market under considerable selling pressure, with key support at $4,304.96. This multi-timeframe analysis is crucial: it highlights the battle between short-term tactical plays and the prevailing longer-term trend. Understanding these divergences is key to navigating the current choppy market conditions.
The Geopolitical Undercurrents and Their Impact on Gold
Beyond the immediate economic indicators, the geopolitical landscape continues to cast a long shadow over precious metals. The ongoing conflicts and tensions in key regions are not merely headlines; they are potent drivers of market sentiment and safe-haven demand. Reports of Iran shutting the Strait of Hormuz, even amidst peace talks, inject a significant dose of uncertainty into global energy markets. This event, if it escalates, could lead to a sharp spike in oil prices, further fueling inflation concerns and potentially forcing a return to energy rationing, as some analyses suggest. The price of Brent crude already surpassed $100 last week, and WTI followed suit, breaking above $90. This surge in energy costs is a direct contributor to the stagflationary fears we are observing. It impacts not only the cost of transportation and manufacturing but also influences consumer confidence and corporate spending. The fact that US oil producers are hesitant to expand production despite soaring prices is also telling; it suggests a cautious outlook or perhaps an anticipation of future demand destruction due to high costs.
The market's reaction to these geopolitical events is often swift and decisive. Gold, traditionally the ultimate safe-haven asset, tends to benefit from heightened global uncertainty. When fear pervades the markets, investors often flock to gold, seeking refuge from potential economic fallout or currency devaluation. We saw evidence of this with reports of gold jumping past $4,500 amid escalating geopolitical tensions, even as peace talks were mentioned. This highlights the delicate balance: while diplomatic efforts aim to de-escalate, the mere *possibility* of conflict is enough to trigger haven buying. This dynamic is further complicated by central bank activity. Despite the hawkish rhetoric from some central banks, many, particularly in emerging markets like Russia and China, have continued to accumulate gold reserves. This consistent, large-scale buying provides a structural floor for gold prices, irrespective of short-term market sentiment. It underscores the long-term view many nations are taking on gold as a reserve asset, diversifying away from traditional currencies.
The interplay between these geopolitical factors and economic data is what makes the current market so complex. For instance, the recent economic news about Spain's electricity prices being cheaper than its neighbors, despite Europe's energy crisis, is a fascinating anomaly. While it might offer some regional relief, it doesn't negate the broader global trend of rising energy costs driven by supply constraints and geopolitical risks. Similarly, the US administration's reported offer to halt offshore wind projects, while seemingly counterintuitive in the fight against climate change, speaks to the immediate and pressing concerns surrounding energy security and cost. These are not isolated events; they are pieces of a larger puzzle that directly influence inflation expectations, interest rate policies, and ultimately, the demand for assets like gold. The market is constantly trying to price in these evolving risks, leading to the kind of volatility we've observed across all asset classes.
Trading Scenarios: Mapping the Path Forward for XAUUSD
Given the conflicting signals across timeframes and the potent mix of economic and geopolitical factors, defining clear trading scenarios is paramount. The technical indicators offer a mixed bag, but the daily chart's bearish trend, supported by a strong ADX of 30.99, suggests that sellers have the upper hand in the longer term. However, the 1-hour chart's buy signal and the 4-hour chart's positive momentum cannot be ignored, especially for short-term traders. The key lies in identifying confirmation levels and managing risk effectively.
Bearish Scenario: The Downside Momentum Continues
65% ProbabilityNeutral Scenario: Consolidation Around Key Levels
25% ProbabilityBullish Scenario: Short-Term Rebound Gains Traction
10% ProbabilityThe bearish scenario appears most probable given the daily trend strength and ADX readings. A break below the $4,492.65 support level would likely trigger further selling, targeting $4,468.70 and then $4,450.80. This aligns with the longer-term bearish trend indicated by the daily RSI at 36.2. The neutral scenario anticipates a period of consolidation, likely within the $4,492.65 to $4,534.50 range, as the market digests recent news and awaits clearer direction. This could present opportunities for range-bound trading strategies, but the risk of a breakout in either direction remains. The bullish scenario, while less probable in the current context, would require a strong surge above $4,534.50, potentially targeting $4,552.40 and higher. Confirmation would be key, especially given the broader bearish trend.
It's vital to remember that these scenarios are based on current technical readings and market sentiment. Unexpected geopolitical events or significant economic data releases could rapidly shift the outlook. For instance, a surprisingly dovish turn from the Federal Reserve, or a de-escalation of Middle East tensions, could quickly invalidate the bearish thesis. Conversely, further escalation or dire economic data could accelerate a move lower. The ADX values on the daily charts (30.99 for XAUUSD) suggest that when a trend does form, it tends to be strong, meaning that a decisive move in either direction could be quite impactful. Therefore, risk management, including the use of stop-losses and position sizing, is absolutely critical for any trader operating in this environment.
The Bigger Picture: Central Banks, ETFs, and Long-Term Gold Demand
While short-term price action and technical signals grab immediate attention, the long-term demand drivers for gold remain robust, providing a foundational support that often gets overlooked amidst the daily noise. Central bank buying, for example, has been a significant structural factor supporting gold prices. Reports indicate that central banks, particularly those in emerging economies, have been accumulating gold at record or near-record levels in recent years. This diversification away from traditional fiat currencies and US dollar holdings is a strategic move, reflecting a desire for stability and a hedge against potential currency debasement. While specific weekly purchase numbers fluctuate, the consistent trend of net accumulation by global central banks provides a strong, underlying demand for the yellow metal. This institutional demand is a powerful counterweight to speculative selling or short-term market fears.
Exchange-Traded Funds (ETFs) also play a critical role in gold's demand dynamics, though their behavior can be more volatile. We've seen periods where ETF outflows, particularly from Western investors, have weighed on prices, as these investors reduce their exposure during times of market stress or shifting investment strategies. Conversely, strong inflows into gold ETFs can signal increasing institutional and retail interest, acting as a catalyst for price appreciation. The data on ETF flows, when available, provides a crucial snapshot of sentiment among a key segment of the investment community. Analyzing these flows in conjunction with central bank activity and jewelry/industrial demand gives a more complete picture of the gold market's fundamental health. Currently, the narrative around rising yields and a strengthening dollar might contribute to some caution among ETF investors, but the overarching stagflationary concerns could also draw them back.
The long-term perspective is crucial when assessing gold's role in a portfolio. It is not merely a commodity subject to the whims of industrial demand or speculative trading; it is also a form of money and a hedge against systemic risk. In an environment where inflation is proving stubborn and economic growth is faltering, gold's traditional role as a store of value becomes increasingly important. Real interest rates, which are nominal rates adjusted for inflation, remain a key determinant of gold's attractiveness. When real rates are low or negative, the opportunity cost of holding non-yielding gold diminishes, making it a more appealing alternative to interest-bearing assets. As central banks grapple with the stagflationary dilemma, the path of real interest rates will be a critical factor to watch. The continued accumulation by central banks, coupled with the potential for negative real rates, suggests that gold's long-term appeal remains intact, even if short-term price action is turbulent.
Market Correlations and Intermarket Analysis
Understanding how XAUUSD moves in relation to other major markets is fundamental to developing a comprehensive trading strategy. The US Dollar Index (DXY) is perhaps the most closely watched correlation. Last week, the DXY exhibited a strong daily uptrend (ADX 31.93), trading near 99.79. Typically, a stronger dollar exerts downward pressure on gold, as it increases the cost for holders of other currencies. However, in a 'risk-off' environment driven by stagflation fears, the dollar can sometimes act as a safe-haven asset itself, rising alongside gold. This complex relationship means we must watch the DXY's behavior not just in isolation, but in conjunction with global risk sentiment. If the dollar continues its ascent while equities plunge, it suggests a broad flight to safety, where gold might also find buyers, albeit potentially at a slower pace than if the dollar were weakening.
Equity markets, represented by the S&P 500 and Nasdaq, are also critical to monitor. Last week saw significant declines in both indices, with the S&P 500 closing down 2.03% at 6355.66 and the Nasdaq 100 falling 2.3% to 23076.09. This broad market sell-off indicates a decrease in risk appetite. When investors become fearful, they tend to divest from riskier assets like stocks and move towards perceived safer havens. Gold typically benefits from such a shift. The fact that these indices are showing strong bearish trends on their daily charts (S&P 500 ADX at 47.68, Nasdaq ADX at 45.07) reinforces the notion that risk aversion is a dominant theme. This environment generally supports gold, provided the dollar doesn't strengthen excessively.
Energy markets, particularly oil, are intrinsically linked to gold's performance, primarily through the inflation channel. The surge in Brent crude past $100 and WTI above $90 is a significant inflationary signal. Higher oil prices directly contribute to increased costs across the economy, fueling inflation and raising concerns about stagflation. Gold, often seen as an inflation hedge, tends to perform well in such environments. The strong upward momentum in oil prices, especially evident in the daily WTI chart with an ADX of 57.34, suggests that energy costs are likely to remain elevated, providing a supportive backdrop for gold. However, the potential for demand destruction if prices rise too high, or geopolitical de-escalation, could temper this effect. The key is to watch for confirmation of sustained inflationary pressures that could prompt further central bank tightening or, conversely, signal the onset of a more severe economic slowdown.
Understanding the Technical Signals: A Deeper Look
Delving deeper into the technical indicators for XAUUSD reveals a nuanced picture that requires careful interpretation. On the 1-hour chart, the trend is classified as neutral with 50% strength, and the RSI at 56.12 suggests a slight upward bias, indicating potential short-term buying interest. The MACD is showing positive momentum, and the Stochastic oscillator, while K=62.62 and D=69.19, presents a slight pullback signal (%K < %D). However, the ADX at 24.26 points to a moderate uptrend. This timeframe suggests that intraday traders might be looking for opportunities to buy dips, anticipating a short-term bounce. The support level at $4,492.65 is a critical pivot point on this timeframe.
Moving to the 4-hour chart, the trend shifts decisively to bearish with 84% strength. The RSI at 50.32 is hovering around the neutral line, showing little conviction, but the MACD is positive, and the Stochastic is showing a bullish signal (%K > %D). The ADX, however, strengthens to 28.83, indicating a solid uptrend on this timeframe. This creates a conflict: bearish trend on the time frame, but strong uptrend signal from ADX. This divergence between trend direction and trend strength indicators on the 4H chart highlights the current indecision in the market. While the overall trend might be considered down, the momentum indicators suggest a potential for short-term reversals or consolidation. The resistance level at $4,450.13 is a key hurdle to overcome for any sustained move higher on this timeframe.
The daily chart paints the most significant picture, confirming a bearish trend with 90% strength. The RSI at 36.2 is firmly in the lower half of the neutral zone, suggesting that sellers are in control and there is room for further downside before reaching oversold territory. The MACD is showing negative momentum, and the Bollinger Bands are positioned below the middle band, indicating a bearish bias. The Stochastic oscillator, with K=36.92 and D=25.3, is showing a bullish signal (%K > %D), which might suggest a potential for a short-term bounce or a divergence from the overall bearish trend. The ADX at 30.99 confirms a strong bearish trend. The daily support at $4,304.96 is the critical level to watch if the bearish momentum continues. This multi-timeframe analysis underscores the importance of context. While short-term signals might hint at a bounce, the daily trend remains bearish, suggesting that any rallies could be opportunities for sellers to re-enter the market.
The Fed's Tightrope Walk and Its Implications for Gold
The Federal Reserve's monetary policy stance remains a central theme influencing gold prices. With inflation proving persistent and the specter of stagflation looming, the Fed faces a delicate balancing act. On one hand, high inflation necessitates tighter monetary policy, potentially involving further interest rate hikes or a prolonged period of holding rates steady at elevated levels. On the other hand, aggressive tightening could tip the economy into a recession, which would be detrimental to growth and employment. The market is keenly watching every utterance from Fed officials and analyzing economic data for clues about the future path of interest rates. Fed Fund Futures and OIS data, if available, would provide precise probabilities for future rate decisions, but even without them, the general sentiment suggests a cautious, data-dependent approach.
Currently, the data presents a mixed picture for the Fed. While employment figures might show resilience, inflation data continues to be stubbornly high, particularly in components like energy and housing. This creates a dilemma: raising rates too much could trigger a recession, but not raising them enough risks entrenching inflation. This uncertainty around monetary policy is, in itself, a bullish factor for gold. Gold often thrives in environments where there is policy uncertainty, currency debasement fears, or negative real interest rates. If the Fed is forced to pause its tightening cycle due to economic weakness, while inflation remains elevated, real interest rates could turn negative, making gold a more attractive asset. Conversely, if the Fed signals a more aggressive stance to combat inflation, potentially leading to higher nominal yields, this could put pressure on gold, especially if the dollar strengthens concurrently.
The market's interpretation of Fed actions and communications is crucial. Last week's economic data, such as the USD release of 210 vs. a forecast of 211, while a minor miss, could be interpreted as a sign of economic softening, potentially influencing the Fed's calculus. If such data points become more frequent, they could lead to expectations of a Fed pivot or pause, which would likely be supportive of gold. Conversely, strong inflation prints would reinforce the case for continued monetary tightening, creating headwinds for the yellow metal. The interplay between inflation, growth, and monetary policy will be the dominant narrative driving gold prices in the coming weeks and months. Investors must remain attuned to these macro developments, understanding that they can often override short-term technical patterns.
XAUUSD Analysis: Key Levels and Trading Signals
To effectively navigate the current market conditions for XAUUSD, a clear understanding of key price levels and trading signals is essential. On the 1-hour chart, the immediate support level stands at $4,492.65. A hold above this level could encourage short-term buying, with resistance seen at $4,534.50 and $4,552.40. However, a break below $4,492.65 would likely open the door for a move towards $4,468.70 and $4,450.80. The ADX at 24.26 suggests a moderate trend, implying that breakouts from this immediate range could be sustained.
The 4-hour timeframe presents a more defined bearish trend, with support identified at $4,409.29, $4,386.30, and $4,368.45. Resistance levels on this chart are clustered around $4,450.13, $4,467.98, and $4,490.97. The ADX at 28.83 indicates a strong trend on this timeframe, suggesting that a break of either support or resistance could lead to a significant price move. The RSI at 50.32 is neutral, offering little directional conviction, but the positive MACD momentum and bullish Stochastic signal suggest that the trend could be poised for a reversal, or at least a pause in the selling pressure.
On the daily chart, the picture is predominantly bearish. The key support level is located at $4,304.96, with further levels at $4,231.70 and $4,112.30. Resistance is found at $4,497.62, $4,617.02, and $4,690.28. The daily RSI at 36.2 indicates room for further downside before oversold conditions are met. The ADX at 30.99 confirms a strong bearish trend. The MACD's negative momentum and the bearish positioning of the Bollinger Bands reinforce this outlook. The Stochastic's bullish signal here might be a precursor to a short-term bounce, but it needs to be viewed within the context of the overarching daily downtrend. A close above the daily resistance at $4,497.62 would be required to invalidate the bearish thesis on this timeframe.
The trading signals across the different timeframes present a challenge. The daily chart clearly indicates a bearish trend, supported by a strong ADX. However, the 1-hour chart shows potential for a short-term bounce, and the 4-hour chart has mixed signals with a strong ADX but positive momentum indicators. This suggests that while the longer-term outlook is bearish, shorter-term traders might find opportunities on the long side if key support levels hold. The critical takeaway is that any rallies should be treated with caution, and a decisive break below $4,492.65 could accelerate downward momentum towards the lower support levels.
The Long-Term Outlook: Gold as a Strategic Asset
Despite the current technical headwinds and the short-term bearish signals on the daily chart, the long-term outlook for gold remains fundamentally sound. The persistent concerns about inflation, the potential for stagflation, and the ongoing geopolitical uncertainties all contribute to gold's appeal as a strategic asset. Central bank accumulation continues to provide a steady source of demand, acting as a significant floor under prices. Furthermore, the structural shift in global monetary policy, with many nations seeking to diversify away from the US dollar, reinforces gold's role as a reserve asset. While short-term fluctuations are inevitable, the underlying macro environment appears conducive to sustained interest in gold as a hedge against economic instability and currency debasement.
The historical performance of gold during periods of economic uncertainty and high inflation cannot be ignored. While past performance is not indicative of future results, the patterns observed during previous stagflationary periods suggest that gold can outperform other assets. Its ability to retain purchasing power when fiat currencies are losing value makes it a unique and valuable component of a diversified investment portfolio. As we look ahead, the path of real interest rates will be a critical determinant of gold's performance. If inflation remains elevated and nominal rates are held steady or lowered, real rates could turn negative, which has historically been a strong tailwind for gold prices. This macro backdrop, combined with central bank buying and geopolitical risks, suggests that gold's strategic importance is likely to persist.
For investors, the current environment calls for a balanced approach. While the short-term technicals might suggest caution or even a bearish bias, the fundamental drivers for gold remain compelling for the long term. Patience and disciplined risk management will be key. Identifying key support and resistance levels, such as the $4,492.65 immediate support and the $4,497.62 daily resistance, will be crucial for tactical trading decisions. However, for those with a longer-term investment horizon, the current price levels, despite the short-term bearish trend, may represent an attractive entry point to accumulate a strategic allocation in gold, given the persistent macroeconomic and geopolitical risks that are unlikely to dissipate anytime soon.
Frequently Asked Questions: XAUUSD Analysis
What happens if XAUUSD breaks below the $4,492.65 support level on the 1H chart?
A break below $4,492.65 on the 1-hour chart would likely trigger further selling pressure, potentially targeting the next support levels at $4,468.70 and $4,450.80. This would align with the prevailing bearish trend indicated on the daily chart.
Should I consider buying XAUUSD at current levels around $4,492.70 given the mixed technical signals?
Buying at current levels carries risk due to the bearish daily trend. However, if you are a short-term trader, a hold above $4,492.65 with confirmation could offer a tactical long opportunity targeting $4,534.50, but with a tight stop-loss below this level.
Is the RSI at 36.2 on the daily chart a sell signal for XAUUSD?
An RSI of 36.2 on the daily chart is not yet in oversold territory, but it indicates bearish momentum and room for further downside. It suggests that sellers are in control and any rallies might be met with resistance.
How might the rising DXY (99.79) and oil prices (Brent > $100) impact XAUUSD this week?
The rising DXY could pressure gold downwards, but the surge in oil prices fuels stagflation fears, which typically supports gold as a safe-haven and inflation hedge. The net effect will depend on which factor dominates market sentiment.
| Indicator | Value | Signal | Interpretation |
|---|---|---|---|
| RSI (14) | 56.12 | Neutral | Slight upward bias on 1H, bearish on 1D |
| MACD Histogram | Positive | Bullish | Positive momentum on 1H/4H, negative on 1D |
| Stochastic | K=62.62, D=69.19 | Bearish | Pullback signal on 1H, bullish on 4H |
| ADX | 24.26 | Bullish | Moderate trend strength on 1H, strong on 4H/1D |
| Bollinger | Middle Band | Watch | Above on 1H/4H, below on 1D |
Track markets in real-time
AI-powered analysis, technical indicators and real-time price data.
Join Our Telegram Channel
Breaking market news, AI analysis and trading signals instantly.
Join Channel