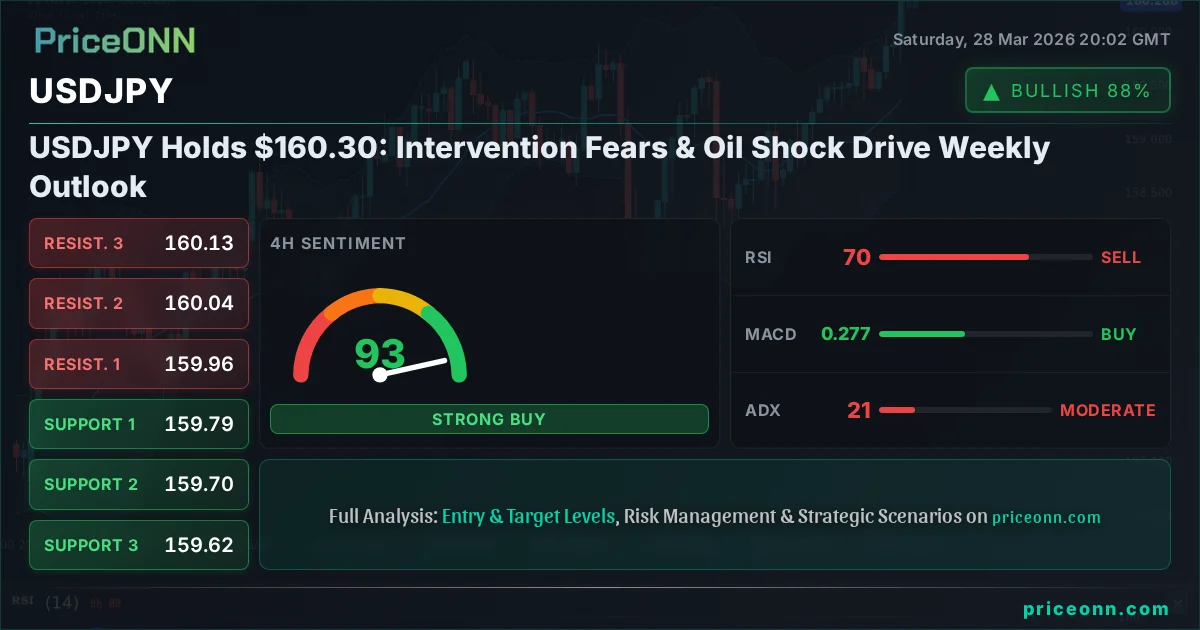
USDJPY Holds $160.30: Intervention Fears & Oil Shock Drive Weekly Outlook
USD/JPY hovers around $160.30 as geopolitical tensions and oil price surges create volatility. Key levels and scenarios to watch this week.
The USD/JPY pair is currently navigating a critical juncture, trading around the psychologically significant $160.30 level. Last week was a rollercoaster for the pair, marked by intensifying geopolitical tensions in the Middle East, a sharp surge in oil prices past $100 a barrel, and persistent fears of Japanese Yen intervention. These factors have created a complex tapestry of market dynamics, leaving traders questioning the next move. As we step into a new trading week, the interplay between a strengthening US Dollar, driven by safe-haven demand and sticky inflation concerns, and the embattled Japanese Yen, which faces its own domestic economic pressures and potential central bank action, will be paramount. This analysis delves into the technical underpinnings, fundamental drivers, and intermarket correlations shaping the USD/JPY's trajectory, exploring potential scenarios and key levels to monitor.
- USD/JPY is trading around $160.30, a critical psychological level.
- Last week saw significant volatility driven by Middle East tensions, oil price spikes, and intervention fears for the Yen.
- The US Dollar Index (DXY) is showing strength, currently at 99.79, correlating with USD/JPY's upward pressure.
- Technical indicators present a mixed picture across different timeframes, suggesting caution and a need for confirmation.
- Key levels to watch this week are support at $159.33 and resistance near $160.45.
The past week has been anything but quiet for USD/JPY. The pair flirted with multi-month highs, relentlessly testing the $160.00 mark. This persistent upward pressure is largely a function of a broader risk-off sentiment gripping global markets. Escalating geopolitical tensions, particularly in the Middle East, have spurred a flight to safety, bolstering the US Dollar. The Dollar Index (DXY), currently hovering around 99.79, has demonstrated a clear upward trend on the daily chart (ADX 31.93), reflecting this risk aversion. When the DXY strengthens, it typically exerts downward pressure on major currency pairs like EUR/USD and GBP/USD, while simultaneously providing a tailwind for USD/JPY. The narrative of sticky inflation in the US also plays into the Dollar's strength, as it keeps the Federal Reserve's options open regarding future monetary policy, even amidst global uncertainty. The sheer momentum behind the dollar, as evidenced by its strong daily trend signal, cannot be ignored.
On the other side of the pair, the Japanese Yen continues to grapple with its own set of challenges. Despite the Yen's traditional safe-haven status, it has been weakening against the dollar. This is partly due to the Bank of Japan's (BoJ) divergent monetary policy stance. While other central banks have been tightening or contemplating policy normalization, the BoJ has maintained an accommodative stance, creating a significant interest rate differential that favors carry trades into USD/JPY. The recent data showing the Yen hovering near yearly lows against the US Dollar underscores this weakness. However, the relentless climb towards $160.00 has amplified intervention fears. Japanese officials have repeatedly warned that they are monitoring currency movements and are prepared to take action if excessive speculation or volatility occurs. These warnings, while not yet leading to direct intervention, create a nervous undertone in the market, potentially capping further aggressive upside for USD/JPY and keeping traders on edge.
The surge in oil prices, with Brent crude futures climbing significantly and WTI surpassing $101.00, adds another layer of complexity. Higher energy costs can exacerbate inflation concerns, potentially strengthening the dollar further. For Japan, a net energy importer, rising oil prices translate to a wider trade deficit and increased inflationary pressure, which can further weaken the Yen. This creates a feedback loop where geopolitical events impacting oil prices directly influence the USD/JPY dynamic. The strength seen in energy markets, with WTI showing a very strong daily trend (ADX 57.34), suggests that this factor will remain a key driver for currency markets in the short to medium term. The market's reaction to these oil price spikes, particularly the way it fuels broader inflation narratives, will be crucial.
Navigating the Technical Landscape: A Multi-Timeframe View
The technical picture for USD/JPY presents a fascinating, albeit complex, set of signals across different timeframes. On the 1-hour chart, the trend is neutral with moderate strength (ADX 28.65), but the signals are predominantly bullish (6 buy, 2 sell). The RSI at 70.41 is firmly in overbought territory, hinting at potential short-term pullbacks or consolidation as buyers might pause to take profits. Similarly, the Stochastic Oscillator is in the extreme overbought zone (K=83.85, D=83.43), also signaling a potential for a pause or minor correction. The MACD, however, continues to show positive momentum, with the MACD line above its signal line, suggesting the underlying upward pressure hasn't entirely dissipated. Bollinger Bands are showing the price above the middle band, indicating a bullish inclination in this very short-term view.
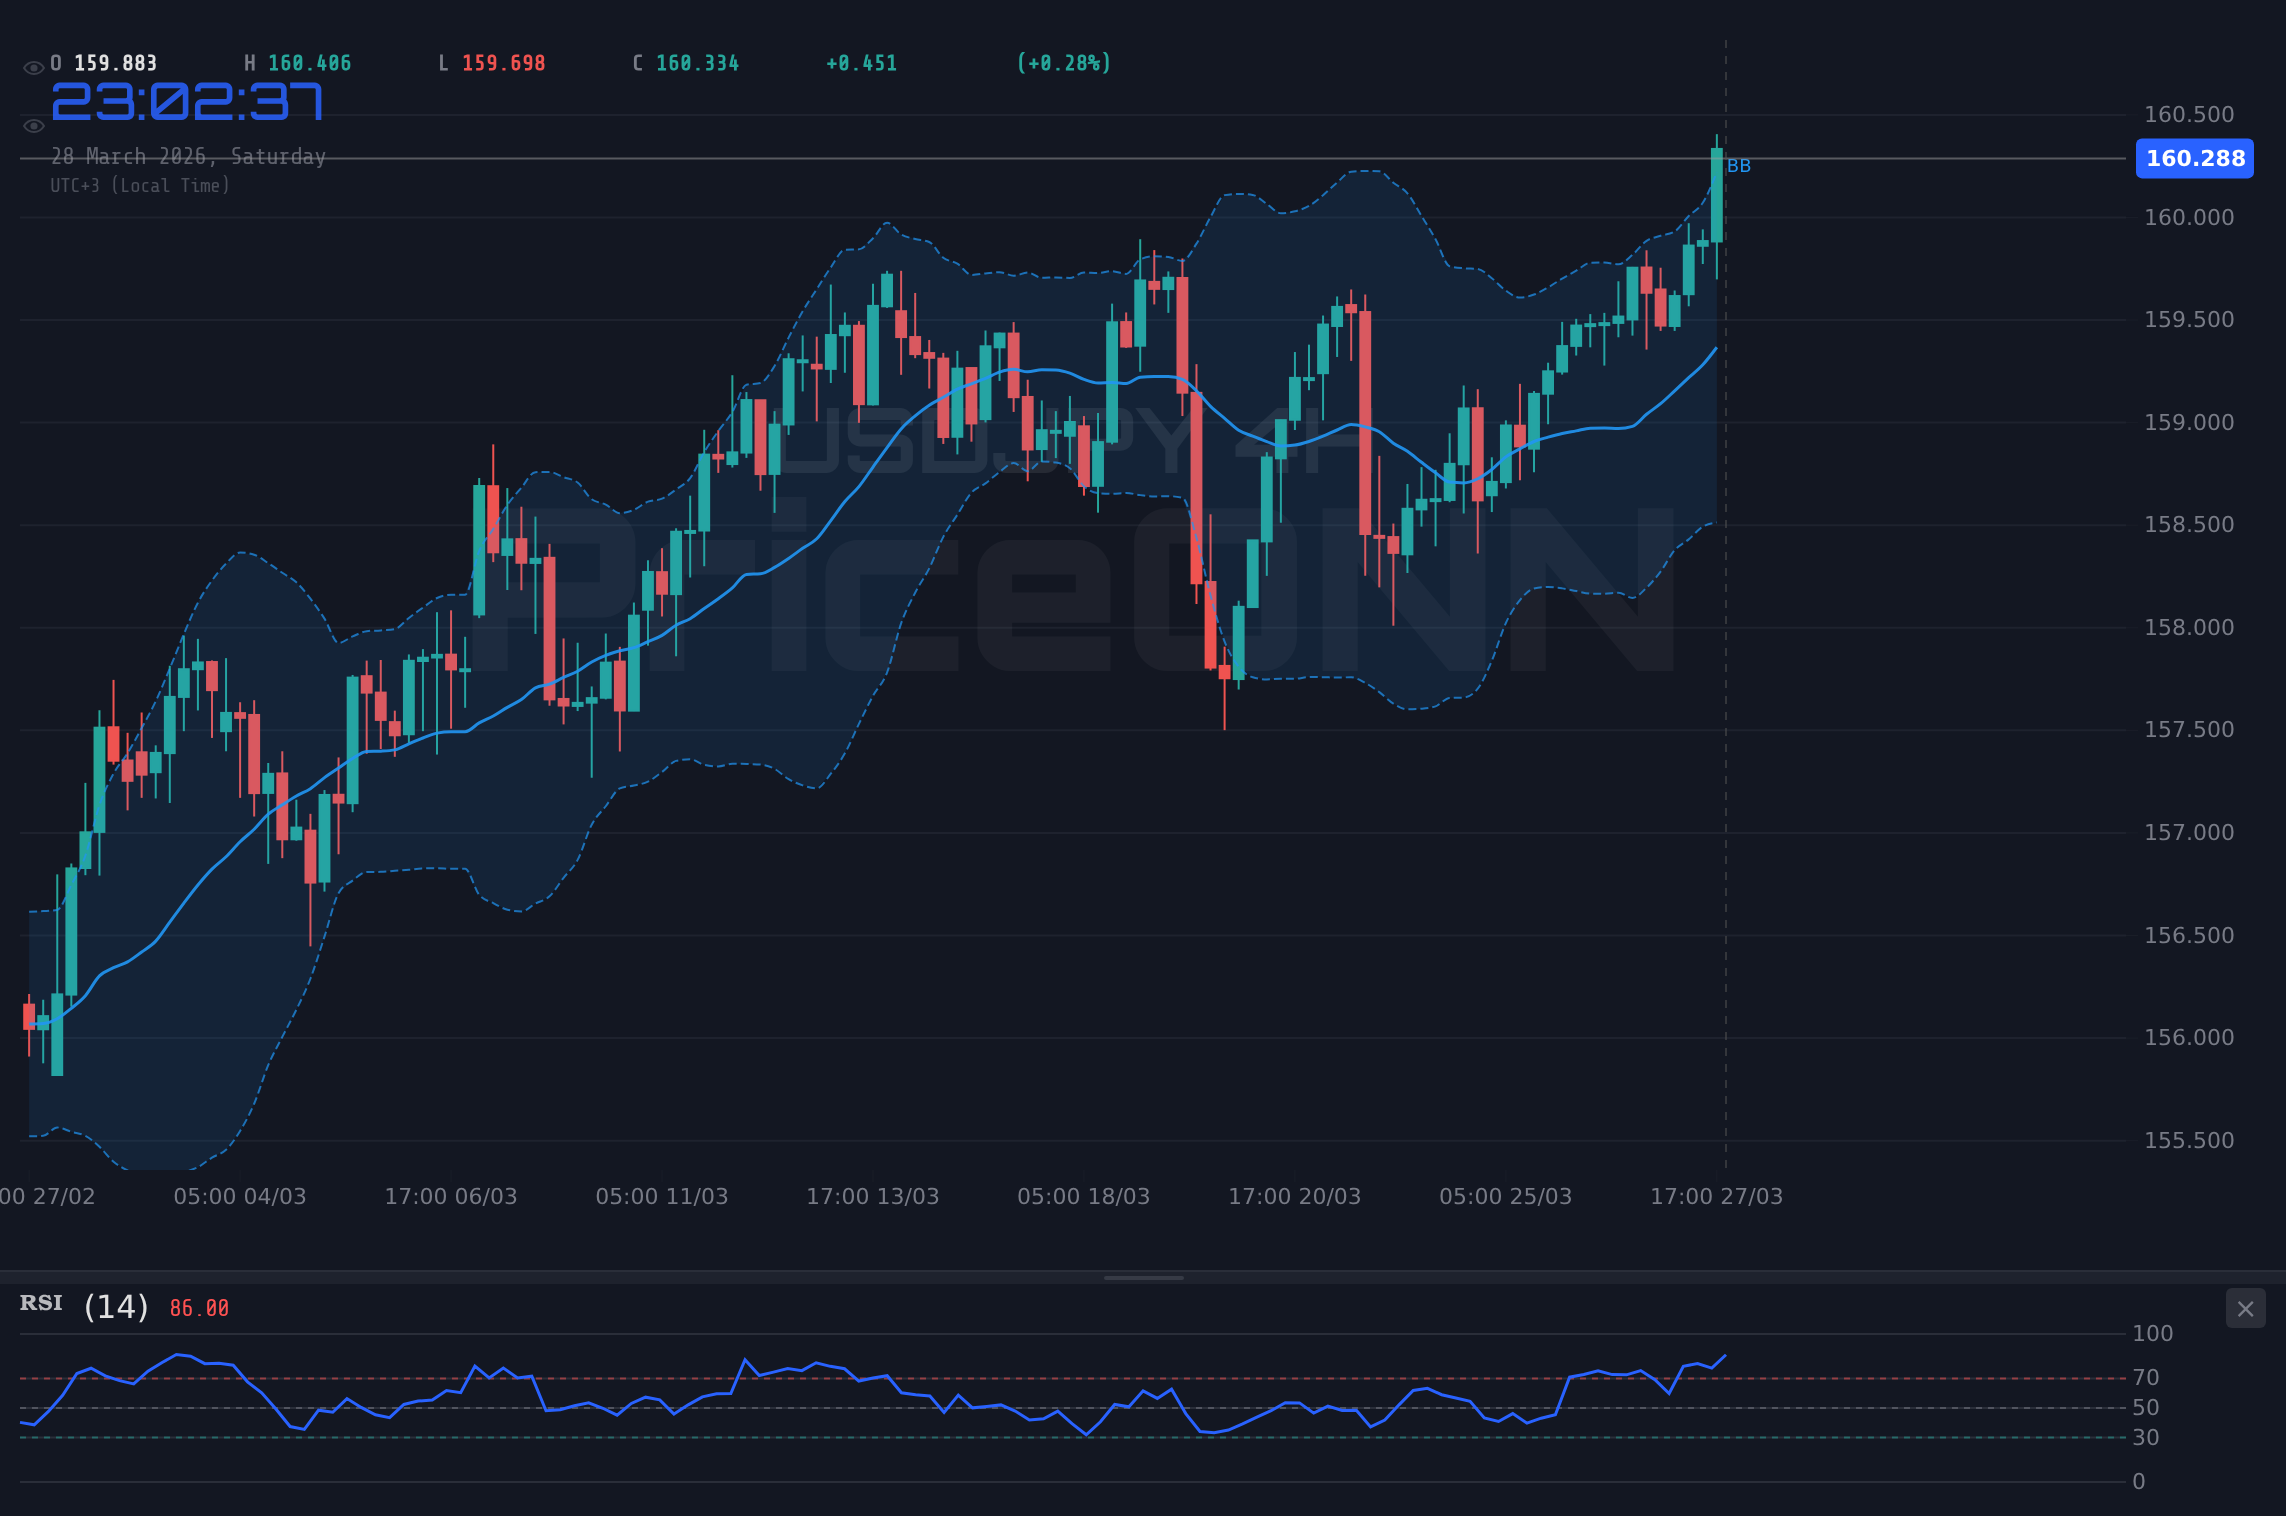
Stepping out to the 4-hour chart, the picture shifts slightly. Here, the trend is clearly defined as bullish (91% strength), with a strong ADX reading of 21.13. The RSI remains elevated at 70.04, still in the overbought zone, reinforcing the idea that the immediate upside might be limited without a period of consolidation. Stochastic is also in overbought territory (K=87.36, D=77.93), showing a strong upward bias. The MACD continues to display positive momentum, staying above its signal line. The Bollinger Bands are hugging the upper band, indicating strong bullish momentum but also highlighting the potential for a reversion to the mean or a pullback if the momentum falters. The overall signal leans heavily towards a buy (7 buy, 1 sell), reflecting the dominant trend on this timeframe.
The daily chart provides the most significant context for the longer-term trend. Here, the trend is also bullish (86% strength), supported by a robust ADX of 22.78. The RSI is at 63.12, sitting comfortably in the neutral-to-bullish zone, suggesting there is still room for upside before becoming significantly overbought. The MACD is displaying positive momentum, with the MACD line above its signal line, confirming the bullish trend. Stochastic is in overbought territory (K=87.75, D=61.64), which, on a daily basis, suggests that the upward move has been substantial and a pullback is statistically more probable. However, the ADX reading indicates a well-established trend, meaning that pullbacks might be shallow and the overall upward trajectory could resume. The strong buy signal (7 buy, 0 neutral) on this timeframe underscores the dominant bullish sentiment.
It's crucial to acknowledge the conflicting signals, particularly between the shorter-term overbought conditions on RSI and Stochastic, and the strong underlying bullish trend indicated by MACD and ADX across multiple timeframes. This divergence suggests that while the bulls are in control, the market might be due for a period of consolidation or a shallow pullback before the next significant move. The fact that the 1-hour chart shows overbought conditions while the daily chart still has room to run indicates potential chop in the very short term. Traders will need to watch for confirmation on breakouts or breakdowns from consolidation ranges.
Intermarket Correlations: DXY, Oil, and Equities
Understanding the USD/JPY's movement requires looking beyond the pair itself and examining its correlations with other key markets. The US Dollar Index (DXY) serves as a primary barometer for the greenback's strength against a basket of major currencies. As noted, the DXY is currently trading at 99.79 and showing a strong upward trend on the daily chart. This inverse correlation is a significant factor for USD/JPY. When the DXY rises, it often implies strength in the US Dollar, which typically translates to higher USD/JPY levels, assuming the Yen's own weakness persists. The current DXY momentum, with its RSI at 60.77 and a bullish signal across all timeframes, reinforces the idea that dollar strength is a key theme.
The surge in oil prices presents a dual-edged sword. On one hand, rising oil prices often correlate with increased inflation expectations, which can benefit the US Dollar by keeping the Federal Reserve in a hawkish or at least a 'higher for longer' interest rate stance. This scenario is bullish for USD/JPY. On the other hand, for commodity-importing nations like Japan, surging energy costs can negatively impact their trade balance and economic outlook, potentially weakening the Yen. This dual effect means that the market's interpretation of oil price movements - whether viewed through the lens of inflation or geopolitical risk - will be critical. The strong bullish trend in both Brent (ADX 62.64) and WTI (ADX 57.34) crude oil suggests this is not a fleeting factor.
Equity markets, particularly the S&P 500 (currently at 6357.55) and Nasdaq 100 (at 23092.5), have experienced a significant sell-off, down 2% and 2.23% respectively on Friday. This sharp decline signals a clear risk-off sentiment. In such environments, safe-haven assets typically perform well. While the US Dollar is benefiting from this risk aversion, the Japanese Yen, despite its safe-haven status, has been weakening due to domestic policy divergences and carry trade dynamics. This unusual dynamic - risk-off favoring the dollar but not the yen - is a key factor contributing to USD/JPY's resilience. If equities continue to fall, we might see increased pressure on the Yen, even as the dollar gains. The ADX readings for both S&P 500 and Nasdaq 100 on the daily chart are above 40, indicating strong downward trends, which reinforces the risk-off narrative.
Fundamental Drivers: Beyond the Charts
The fundamental backdrop for USD/JPY remains heavily influenced by monetary policy divergence and geopolitical risks. The Federal Reserve is navigating a delicate path, balancing the need to control inflation with concerns about economic growth. While recent data suggests inflation might be 'sticky', the Fed has signaled a data-dependent approach. Market participants are closely watching Fed Fund Futures and OIS rates for clues on future rate cuts. However, any hint of continued hawkishness or a delay in expected rate cuts due to inflation would likely support the US Dollar. Conversely, signs of economic weakening could lead to expectations of earlier cuts, potentially pressuring the dollar.
The Bank of Japan, however, is in a different position. While there's increasing speculation about policy normalization, including potential interest rate hikes and adjustments to its yield curve control (YCC) policy, the BoJ has been cautious. The recent PriceONN market news highlights this ongoing debate, with titles like "Will the Yen Reclaim Strength as Japan Continues Policy Normalization?" and "Will USD/JPY Break 160 as Yen Weakness Intensifies?" reflecting market sentiment. The interest rate differential between the US and Japan remains a powerful driver. As long as this gap persists, and particularly if the BoJ remains accommodative while the Fed holds steady or signals a 'higher for longer' stance on rates, the fundamental bias for USD/JPY will likely remain upward, despite intervention fears.
Geopolitical events, especially those impacting oil prices and global risk sentiment, are acting as significant catalysts. The ongoing tensions in the Middle East have not only driven oil prices higher but have also reinforced the demand for the US Dollar as a safe-haven currency. This aligns with the broader risk-off sentiment observed in equity markets. The market's reaction to future geopolitical developments will be crucial. Any further escalation could lead to sustained dollar strength and continued pressure on the Yen, especially if it coincides with a less dovish stance from the Fed or a continued accommodative policy from the BoJ. The fact that the USD is on track for its strongest monthly gain since July 2025, fueled by these tensions, underscores the prevailing macro environment.
Economic calendar data also plays a vital role. Last week's US data, such as the Personal Consumption Expenditures (PCE) price index, showed inflation at 6.926%, higher than the forecast of -1.3% and previous reading of 6.156%. This higher-than-expected inflation reading reinforces the narrative that the Fed may need to maintain a tighter monetary policy for longer, which is bullish for the dollar and consequently for USD/JPY. Upcoming data releases will be critical for confirming or challenging these trends. The market will be particularly focused on any further indicators of inflation or employment strength that could influence Fed policy expectations.
Trade Scenarios: Charting the Path Forward
The Bear's Path: Yen Strength and Dollar Weakness
25% ProbabilityThe Waiting Game: Consolidation Around $160.30
50% ProbabilityThe Bull's Roadmap: Breaking Higher
25% ProbabilityGiven the current technical confluence across multiple timeframes and the prevailing fundamental backdrop, the most likely scenario for USD/JPY in the short term appears to be a period of consolidation or a shallow pullback before potentially resuming its upward trend, IF key support levels hold. The bullish trend on the daily chart (ADX 22.78, RSI 63.12) remains intact, but the overbought conditions on shorter timeframes, coupled with intervention fears, suggest that a clear, sustained breakout above $160.45 might be challenging without a significant catalyst or a period of digestion. The Neutral/Waiting Game scenario (50% probability) seems most plausible for the immediate week ahead. This anticipates price action remaining somewhat range-bound, potentially oscillating between the 1-hour resistance of $160.341 and support of $160.194, or even wider between the daily key levels. Traders should look for confirmation from a decisive break of these boundaries.
The bullish scenario (25% probability) hinges on the pair decisively breaking above the daily resistance at $160.451 and holding there. This would likely require a combination of continued dollar strength, a dovish BoJ stance, and perhaps a pause in the oil price surge or a de-escalation of geopolitical tensions. Such a move could target higher levels, potentially towards $161.49 (assuming this is a logical next resistance zone based on broader market context, although not explicitly provided). Conversely, the bearish scenario (25% probability) would be triggered by a clear breakdown below the 4-hour support at $159.791. This could be fueled by direct intervention signals from Japan, a significant shift in Fed policy expectations, or a sharp reversal in risk sentiment. If this occurs, the pair could fall towards the daily support levels at $159.330 and then $159.022.
What I'm Watching This Week
As we head into the new trading week, several key catalysts will dictate the direction of USD/JPY. Firstly, intervention fears remain at the forefront. Any official statements or actions from Japanese authorities will be closely monitored and could lead to sharp, albeit potentially temporary, reversals. Secondly, US economic data, particularly any further inflation or employment figures, will be crucial in shaping Federal Reserve policy expectations. Stronger-than-expected data will likely bolster the dollar, while weaker data could introduce dollar weakness. Lastly, the ongoing geopolitical situation and its impact on oil prices and overall market sentiment cannot be overstated. Any significant escalation or de-escalation in the Middle East will have ripple effects across global markets.
From a technical standpoint, the key levels to watch are the immediate 1-hour resistance at $160.341 and support at $160.194. A decisive break above $160.341, confirmed by a hold above the daily resistance at $160.451, would strengthen the bullish case. Conversely, a break below the 4-hour support at $159.791 would signal a potential bearish turn. The daily chart remains the ultimate arbiter of the longer-term trend, and as long as it holds its bullish posture (ADX 22.78, RSI 63.12), any pullbacks could be seen as opportunities to re-enter long positions, provided risk management is strictly adhered to.
| Indicator | Value | Signal | Interpretation |
|---|---|---|---|
| RSI (14) | 63.12 | Neutral | Suggests room for upside on daily, but watch for overbought on shorter timeframes. |
| MACD Histogram | +0.664 | Bullish | Positive momentum confirms the overall uptrend on daily. |
| Stochastic | 87.75 / 61.64 | Bearish | Overbought on daily, suggesting potential for pullback or consolidation. |
| ADX | 22.78 | Bullish | Indicates a well-established trend on the daily chart. |
| Bollinger | Middle Band | Bullish | Price is trading above the middle band on daily, confirming bullish bias. |
Frequently Asked Questions: USDJPY Analysis
What happens if USD/JPY breaks decisively above the $160.45 resistance level?
A sustained move above $160.45, particularly if confirmed above the daily resistance at $160.451, would strengthen the bullish case. This could open the door for targets around $160.90 and potentially $161.15, assuming dollar strength continues and intervention fears subside.
Should I consider buying USD/JPY at current levels around $160.30 given the overbought signals?
Caution is advised. While the daily trend is bullish, shorter-term charts show overbought conditions. A 25% probability bullish scenario exists if price holds support, but a 50% probability neutral scenario suggests range-bound trading. Wait for confirmation of a breakout or a clear pullback to support before entering long positions.
Is the Stochastic Oscillator at 87.75 a strong sell signal for USD/JPY right now?
The Stochastic Oscillator at 87.75 on the daily chart indicates extreme overbought conditions, which historically suggests a potential pullback or consolidation. However, in a strong trend, overbought signals can persist. It's a warning sign rather than a direct sell signal, especially with the ADX at 22.78 indicating a firm trend.
How will the higher-than-expected US inflation data affect USD/JPY this week?
The higher US inflation reading (6.926%) reinforces the narrative of sticky inflation, potentially keeping the Federal Reserve on a 'higher for longer' interest rate path. This is generally supportive of the US Dollar and thus bullish for USD/JPY, especially if the Bank of Japan maintains its accommodative stance.
Track markets in real-time
AI-powered analysis, technical indicators and real-time price data.
Join Our Telegram Channel
Breaking market news, AI analysis and trading signals instantly.
Join Channel