WTI Weekly: Bull Run Continues at $101.19 - Outlook Ahead
WTI crude oil holds firm near $101.19 despite geopolitical tensions, as strong demand and supply constraints fuel a bullish outlook. Analysis of key levels and market drivers.
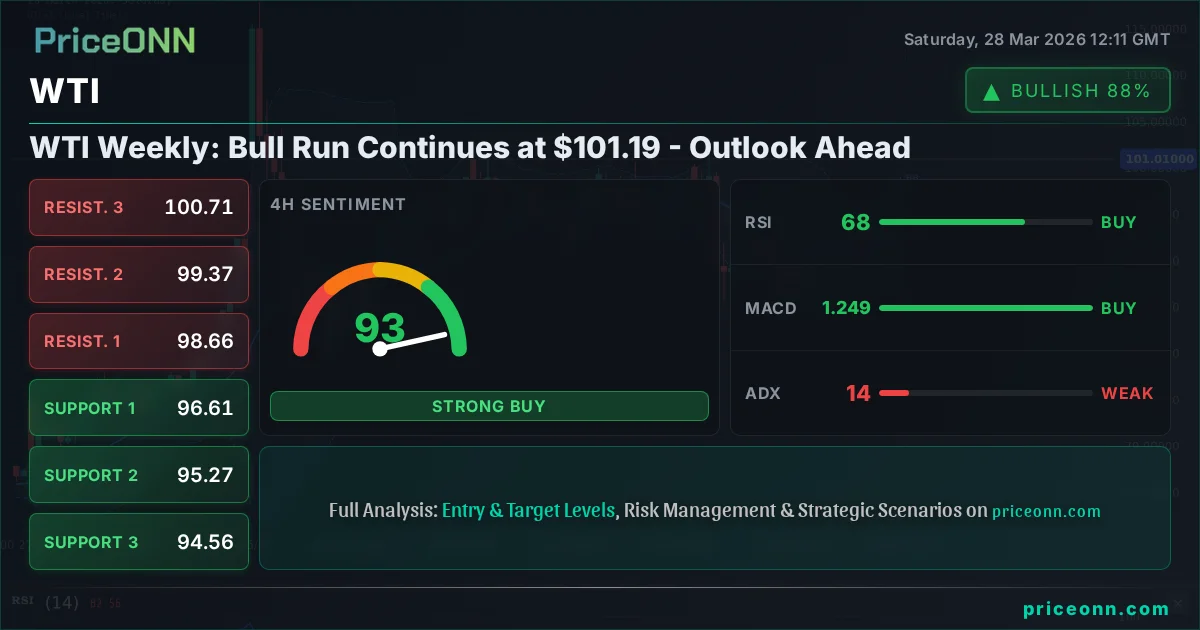
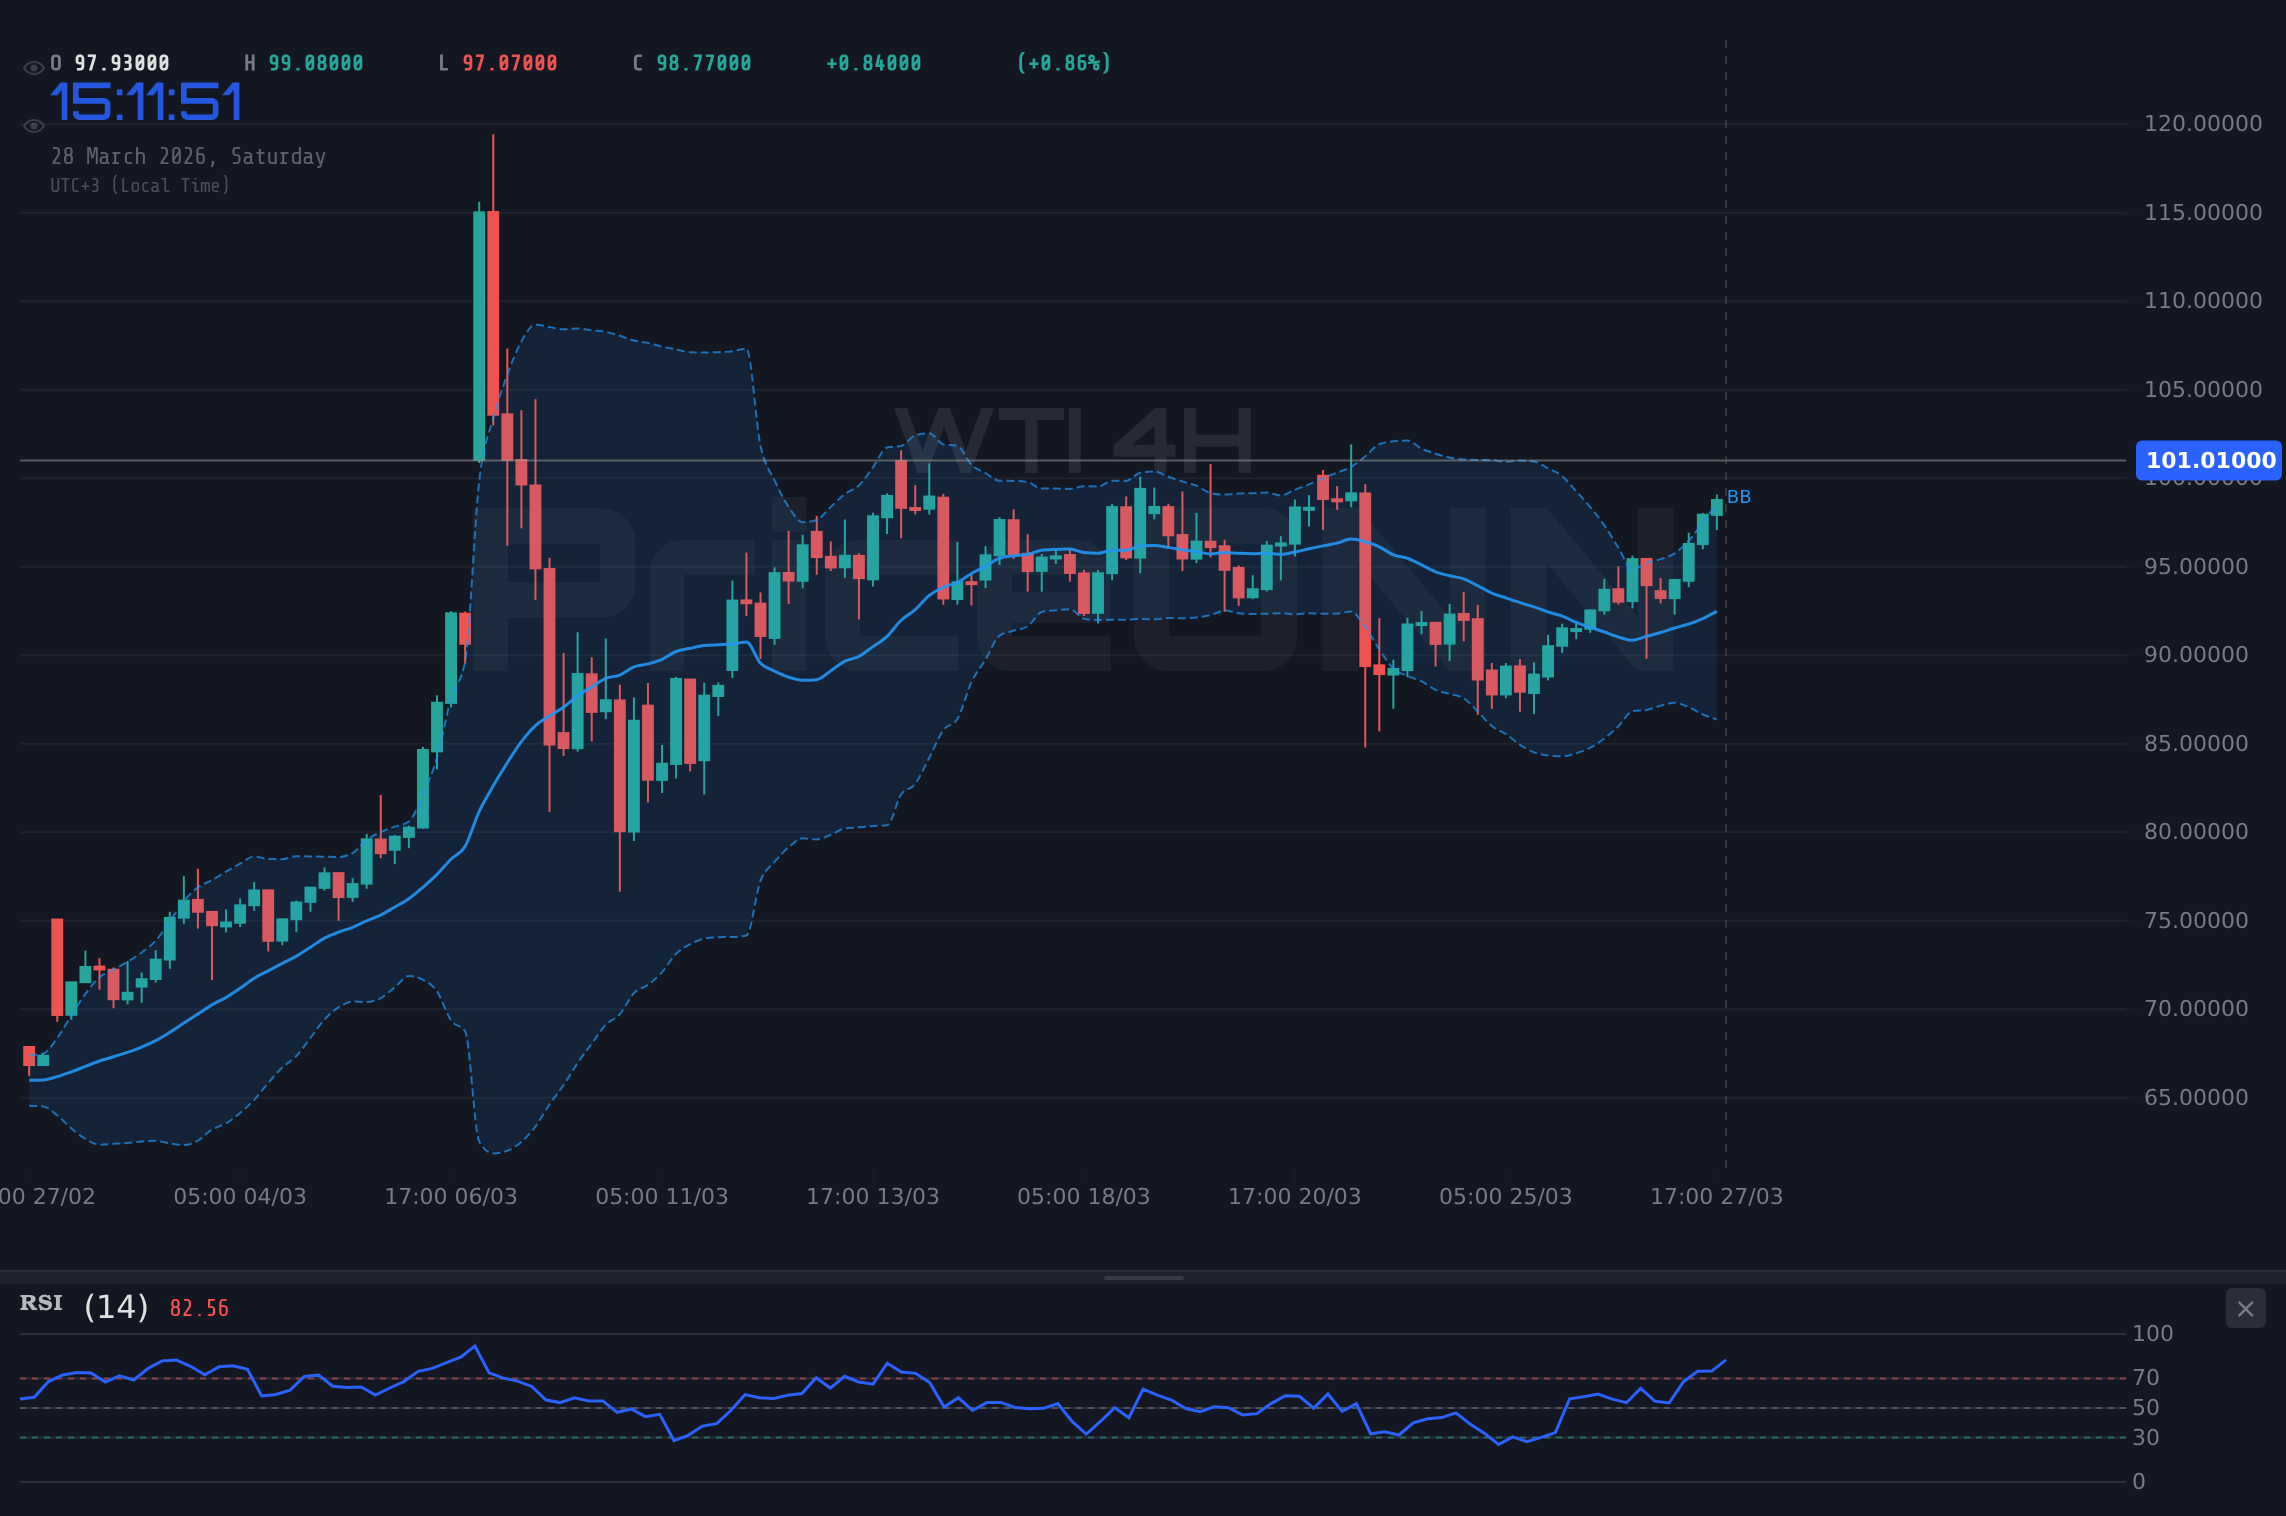
WTI crude oil's robust performance continues, closing last Friday near the critical $101.19 mark. This surge, driven by a confluence of escalating geopolitical tensions in the Middle East and persistent supply-side constraints, paints a bullish picture for the commodity. However, as always in the energy markets, the path forward is rarely a straight line. This week's analysis delves into the competing forces at play, examining the arguments for both the bulls and the bears as they battle for control at these elevated price levels. We will dissect the technical indicators, fundamental drivers, and the broader market correlations that are shaping the outlook for WTI in the coming week.
- WTI crude oil closed last Friday near $101.19, showing strong bullish momentum with an ADX of 57.34 indicating a very strong uptrend.
- Critical resistance is eyed at $111.91, while support remains robust around $100.77, tested multiple times this week.
- RSI at 67.27 suggests room for further upside, but traders should watch for potential overbought conditions if it approaches 70.
- Geopolitical tensions in the Middle East, particularly the conflict impacting Russian oil exports and Iran's actions, are a primary driver for WTI's current price action and outlook.
The Bull Case: Geopolitical Storms and Supply Squeeze
The narrative for the bulls in the WTI crude oil market remains compelling, anchored by significant geopolitical developments and underlying supply dynamics. Last Friday, WTI settled near $101.19, a testament to the sustained buying pressure that has characterized the recent trading sessions. The daily chart paints a picture of a very strong uptrend, with the ADX indicator at a formidable 62.64, signaling that the current market momentum is robust and the trend is firmly established. This is not a market characterized by indecision; rather, it's a clear directional move that has captured the attention of traders and investors alike.
At the forefront of the bullish argument are the escalating geopolitical tensions, particularly those emanating from the Middle East. Recent news reports, including those from Reuters and Bloomberg, have highlighted Iran's actions and the ongoing conflict, which have directly impacted oil supply routes. The Strait of Hormuz, a critical chokepoint for global oil trade, has been a focal point of these tensions. Any disruption, or even the threat of disruption, in this region sends immediate shockwaves through the oil market, driving prices higher due to fears of supply shortages. The DailyFX analysis on March 28th explicitly linked gold's surge past $4,500 to Iran shutting the Strait of Hormuz, underscoring how such events can catalyze broader commodity price increases. While gold is a different asset class, the underlying driver - geopolitical risk premium - is identical for crude oil.
Furthermore, the ongoing conflict in Ukraine continues to cast a shadow over Russian oil exports. Reports of Ukrainian drone strikes crippling key export terminals in the Baltic Sea, as highlighted by energy news outlets, add another layer of uncertainty to global oil supply. This directly impacts the available supply of crude oil on the international market, tightening balances and providing fundamental support for WTI prices. The Aker BP earnings report, while focused on a different region, indirectly speaks to the capital expenditure and investment decisions being made in the energy sector, which can influence future supply capabilities. When major producers face operational challenges or geopolitical risks, the market tends to price in a scarcity premium.
On the demand side, while global economic growth remains a watchpoint, the reopening of economies and resilient consumer behavior in certain regions are providing a baseline of support. China's economic activities, though sometimes showing mixed signals, remain a crucial factor for global oil demand. The potential for a resurgence in Chinese demand, especially if stimulus measures prove effective, could further tighten the market. Coupled with the supply-side disruptions, this creates a scenario where demand may outstrip available supply, pushing prices upward. The bullish case is further bolstered by the fact that producers are maintaining production cuts, either voluntarily or due to external pressures. OPEC+ decisions, or the lack thereof, play a significant role here. While specific OPEC+ meeting outcomes aren't provided in the immediate data, the general sentiment from producers has been to manage supply carefully to support price levels.
Technically, the daily chart indicators offer a strong bullish confirmation. The RSI(14) stands at 67.27, which, while not yet in extreme overbought territory, clearly indicates strong upward momentum and room for further gains. It suggests that the buying pressure is significant and has not yet exhausted itself. The MACD is also showing positive momentum, with its histogram above the signal line, reinforcing the strength of the current uptrend. The Bollinger Bands are trading above the middle band, indicating an upward bias, and the ADX at 62.64 is exceptionally high, confirming a powerful and established trend. This confluence of technical signals provides a solid foundation for the bullish argument, suggesting that the rally may have further to run.
Why $101.19 is a Critical Juncture
The $101.19 level, where WTI closed last Friday, is more than just a price point; it represents a psychologically important barrier and a level that has seen significant trading activity. For the bulls, holding and consolidating above this level is crucial for maintaining upward momentum. It signifies market acceptance of higher prices and provides a base for further advances. The immediate support level identified at $100.77, and further down at $100.77, $97.91, and $95.20, are key to validating this bullish thesis. As long as WTI stays above these levels, the narrative of a sustained bull run remains intact. The strength of the ADX at 62.64 on the daily chart suggests that any pullbacks are likely to be met with buying interest, reinforcing these support zones.
The 1-hour and 4-hour charts, while showing some mixed signals in terms of Stochastic indicators, largely align with the broader bullish trend on the daily timeframe. The 4-hour ADX at 14.41 indicates a weaker trend in this shorter timeframe, suggesting consolidation might occur. However, the daily trend strength of 100% and ADX of 62.64 on the daily chart overpower these shorter-term fluctuations. The RSI(14) on the 1-hour chart is at 79.21, firmly in overbought territory, suggesting a potential for a short-term pullback or consolidation around current levels before the next leg up. This is where the nuanced interpretation of technical indicators becomes vital. While the daily trend is strongly bullish, shorter-term overbought conditions can lead to temporary price retracements, which often present buying opportunities for those looking to enter the trend.
The presence of strong resistance levels ahead, notably at $106.34, $109.05, and $111.91, indicates that the path to significantly higher prices is not without its hurdles. However, the current market sentiment, fueled by geopolitical risk premiums and supply concerns, suggests that these resistance levels might be tested sooner rather than later. The fact that WTI has managed to climb this high despite a strengthening US Dollar, as indicated by the DXY at 99.91, further emphasizes the strength of the underlying bullish forces in the oil market. Typically, a stronger dollar exerts downward pressure on dollar-denominated commodities like WTI. The fact that oil is defying this correlation suggests that the fundamental drivers for oil are currently overriding the currency effect.
With the DXY at 99.91, demonstrating a 0.34% daily increase and a strong bullish trend on the daily chart (ADX 31.98), WTI's ability to rally significantly is a testament to the overwhelming fundamental factors driving oil prices. This inverse correlation is being overshadowed by supply risks and geopolitical premiums.
The bullish argument is robust and well-supported by both fundamental supply-demand imbalances and strong technical indicators on the daily timeframe. The geopolitical landscape continues to provide a powerful tailwind, creating a risk premium that is unlikely to dissipate quickly. As long as these factors remain in play, the bulls are likely to remain in control, pushing WTI towards higher price targets.
The Bear Case: Overbought Conditions and Economic Headwinds
Despite the seemingly unshakeable bullish momentum, a closer examination reveals potential vulnerabilities in the WTI crude oil rally, presenting a case for caution among traders. While the daily charts scream 'uptrend,' shorter-term indicators and broader economic concerns offer a counter-narrative. The immediate concern for bears lies in the 'overbought' signals appearing on shorter timeframes, which could precede a significant price correction. On the 1-hour chart, the RSI(14) is soaring at 79.21, a level typically associated with exhaustion in the immediate buying pressure. Similarly, the Stochastic oscillator on the 1-hour timeframe is in extreme overbought territory, with K at 91.38 and D at 86.18, indicating that the market may be due for a pullback. This suggests that the rapid ascent might be unsustainable in the very short term.
While the daily ADX at 62.64 indicates a very strong trend, it's crucial to remember that trends do not move in straight lines. Even the strongest uptrends experience pullbacks. Bears will be looking for the RSI to cross below 70 on the daily chart as an initial sign of weakening momentum, followed by a potential dip below the 50-day moving average. The MACD on the daily chart, while currently positive, could see its histogram begin to shrink or cross below the signal line, indicating a loss of bullish steam. The Stochastic on the daily chart, currently at K=39.82 and D=46.48, is showing a bearish crossover (K < D), which, if it persists, could signal a rotation downwards. While this is a daily signal and may take time to play out, it represents a divergence from the overwhelming bullish trend signals elsewhere.
Beyond the immediate technicals, broader economic concerns present a significant headwind for oil prices. While current demand is robust, any signs of a global economic slowdown could drastically alter the supply-demand balance. High inflation, persistent interest rate hikes by central banks (though the Fed's immediate future path is debated), and the potential for recession in major economies like Europe or even the US, could dampen oil consumption. The recent sharp decline in major equity indices like the SP500 (down 2% to 6357.55) and Nasdaq 100 (down 2.23% to 23092.5) on Friday reflects a growing risk-off sentiment in the markets. When equity markets fall significantly, it often signals a reduction in risk appetite, which can translate into lower demand for riskier assets and commodities like oil. A prolonged stock market downturn could easily spill over into the energy complex, negating the current bullish narrative.
The strengthening US Dollar, currently at 99.91 and showing a strong bullish trend, also poses a challenge. As mentioned, a stronger dollar typically makes dollar-denominated commodities more expensive for holders of other currencies, potentially dampening demand. While WTI has shown resilience against the dollar recently, a sustained period of dollar strength, perhaps driven by further hawkish signals from the Federal Reserve or safe-haven flows into the greenback, could eventually cap oil prices. The correlation between the DXY and WTI, though currently strained by geopolitical factors, is a fundamental relationship that cannot be ignored indefinitely. If the DXY continues its climb towards the 100 mark and beyond, it will inevitably exert more downward pressure on WTI.
Furthermore, the narrative around supply is not entirely one-sided. While geopolitical events are disrupting supply, advancements in US shale production could, over time, provide a counterbalancing force. If US producers can overcome current challenges and increase output significantly, it could alleviate some of the supply tightness. While the current ADX of 57.34 on the daily chart for WTI suggests a very strong trend that is difficult to reverse, any unexpected increase in non-OPEC+ supply could shift market sentiment. Bears will be watching inventory reports closely for signs of unexpected builds, which could signal a loosening of the supply/demand balance.
The bears' argument hinges on the idea that the market has become excessively optimistic, pricing in an ever-worsening geopolitical scenario without fully accounting for the potential economic fallout or the possibility of de-escalation. They believe that the current price levels are unsustainable and that a correction is not only possible but probable, especially if economic data deteriorates or if diplomatic efforts manage to ease tensions in key regions. The overbought conditions on shorter timeframes, coupled with the broader risk-off sentiment in equities and the persistent strength of the US dollar, provide fertile ground for a bearish reversal.
While the trend is strongly bullish, the RSI at 79.21 on the 1-hour chart suggests the market is overextended in the short term. A pullback towards the $100.77 support level is a distinct possibility, even if the longer-term trend remains intact.
Technical Battleground: $101.19 as a Pivot Point
The battle between bulls and bears is vividly illustrated by the technicals surrounding WTI crude oil, with the $101.19 level acting as a crucial pivot. On the daily chart, WTI is exhibiting a very strong uptrend, evidenced by the ADX reading of 62.64. This suggests that the market is in a strong directional move, and any pullbacks are likely to be short-lived unless significant reversal signals emerge. The RSI(14) at 67.27 on the daily chart indicates healthy upward momentum, with room to run before reaching overbought territory (typically considered above 70).
However, when we zoom into the shorter timeframes, the picture becomes more complex. The 1-hour chart shows an RSI of 79.21, firmly in overbought territory. This divergence between the daily and hourly timeframes is critical. It suggests that while the long-term trend remains bullish, the immediate upward momentum may be exhausted, increasing the probability of a short-term correction. The Stochastic on the 1-hour chart confirms this, showing a bearish crossover with K (83.85) below D (86.18) in the overbought zone. This is a classic signal for a potential short-term reversal or consolidation.
The 4-hour chart presents a more mixed picture. The ADX of 14.41 here suggests a weaker trend in this timeframe, indicating a period of consolidation or range-bound trading might be occurring. However, the daily trend strength remains paramount. The daily Stochastic, while showing a bearish crossover (K=39.82, D=46.48), is not yet in overbought territory, suggesting that a pullback might not be immediate or severe. It's important to interpret these conflicting signals not as a reason to abandon the primary trend, but as indicators of potential short-term fluctuations and opportunities for risk management.
The key levels provided offer a roadmap for navigating these technical dynamics. The immediate support at $100.77 and the subsequent levels at $97.91 and $95.20 are crucial for the bulls. A decisive break below $100.77 would challenge the bullish thesis and could signal a deeper correction. Conversely, the resistance levels at $106.34, $109.05, and $111.91 represent the next targets for the bulls. Breaking through $111.91 would signal a significant continuation of the uptrend, potentially opening the door to much higher prices.
The interplay between these indicators and price levels highlights the current market tension. The strong daily trend (ADX 62.64) suggests that dips are likely to be bought, especially if they find support at the $100.77 level. However, the overbought conditions on the 1-hour chart (RSI 79.21) warn of potential short-term selling pressure, which could lead to a retest of these support levels. Traders must be aware of this divergence and manage their positions accordingly, perhaps by waiting for confirmation on shorter timeframes after a pullback or by scaling into positions on dips towards key support.
The discrepancy between the daily trend strength (ADX 62.64) and the short-term overbought RSI (79.21 on 1H) creates a 'choppy' environment for intraday traders. Patience is key; wait for the market to resolve this tension. A break above $101.19 with conviction, supported by declining RSI on the hourly, could signal a healthy continuation rather than a blow-off top.
Ultimately, the technical picture, while showing strong bullish conviction on the daily timeframe, also presents clear warnings about short-term overextension. The $101.19 closing price serves as a critical reference point. A hold above this level reinforces the bullish narrative, while a break below could signal the beginning of a more significant correction, especially if it breaches the $100.77 support. The market is essentially at a crossroads where the prevailing trend is strong, but the immediate conditions suggest caution is warranted before chasing further upside.
Market Context and Correlation Analysis
Understanding WTI's price action requires looking beyond the oil market itself and examining its correlations with other key financial assets. The current environment is characterized by a strong US Dollar (DXY), significant volatility in equity markets, and persistent geopolitical risks. These factors weave a complex tapestry that influences oil prices, sometimes in expected ways and sometimes in surprising divergences.
The US Dollar Index (DXY) is a critical component of this analysis. Currently trading around 99.91, the DXY exhibits a strong bullish trend on the daily chart (ADX 31.98) and is showing bullish signals across multiple timeframes. Historically, a strengthening dollar tends to put downward pressure on dollar-denominated commodities like WTI, as they become more expensive for foreign buyers. However, in the current geopolitical climate, this inverse correlation appears to be weakening. WTI has managed to rally significantly despite the dollar's strength, suggesting that the geopolitical risk premium and supply concerns are currently overriding the currency effect. This resilience highlights the potency of the factors driving oil prices higher. If the DXY were to break decisively above the 100 psychological level, it could eventually exert more pressure, but for now, oil seems to be charting its own course.
Equity markets, represented by the SP500 and Nasdaq 100, are flashing warning signs. The SP500 closed down 2% at 6357.55, and the Nasdaq 100 fell 2.23% to 23092.5. This sharp sell-off indicates a decline in risk appetite among investors. Typically, a 'risk-off' environment leads to reduced demand for commodities and other riskier assets, potentially capping oil prices. The fact that WTI has managed to rally strongly even as equities tumble suggests that oil is being driven by factors distinct from general market sentiment, primarily the supply-side disruptions and geopolitical risk. However, a sustained and deeper sell-off in equities could eventually drag oil prices down with it, as investors liquidate positions across the board.
The correlation between oil prices and inflation expectations remains a fundamental consideration. Higher oil prices directly contribute to inflation, particularly at the pump and in transportation costs. This can create a feedback loop, where rising oil prices fuel inflation, which in turn might prompt central banks to maintain or even increase interest rates. While the Fed's current stance is data-dependent, persistent high energy prices could complicate their efforts to control inflation. This dynamic adds another layer of complexity, as the very factors pushing oil prices up could, in the long run, lead to economic conditions that dampen oil demand.
Geopolitical events, as previously discussed, are a primary driver and are inherently unpredictable. The situation involving Iran, the Strait of Hormuz, and the conflict in Ukraine creates a substantial risk premium in oil prices. Any de-escalation in these regions could lead to a sharp correction in WTI, while further escalation would likely solidify the bullish trend. Market participants are closely monitoring headlines from these areas, and any shift in the geopolitical landscape can trigger rapid price movements. The news of potential force majeure on Russian oil exports due to drone strikes is a significant development that directly impacts supply and supports higher prices.
Looking at other commodities, gold's performance provides some context. Gold surged past $4,500, driven by similar geopolitical tensions. This broad-based strength in precious metals and energy commodities suggests a flight to real assets amid uncertainty. Silver, however, struggled below $70, which might indicate that not all commodities are benefiting equally from the current risk-off sentiment, or that specific supply/demand factors for silver are at play. The divergence between gold and silver can sometimes offer clues about market sentiment and the underlying drivers of commodity strength.
Understanding these correlations is crucial for a comprehensive market outlook. While WTI is currently demonstrating a strong independent bullish trend driven by supply shocks, it remains susceptible to broader market forces. A significant shift in the US Dollar's trajectory, a severe global economic downturn impacting equity markets, or a sudden de-escalation of geopolitical conflicts could all serve as catalysts for a reversal in WTI prices. For now, however, the immediate drivers appear to be strongly in favor of the bulls.
The strong correlation between WTI and gold prices, both reacting to geopolitical risk, highlights a broader flight to tangible assets. However, WTI's current strength, despite headwinds from a rising DXY and falling equities, indicates that oil's supply-driven narrative is currently dominant.
Navigating the Week Ahead: Key Levels and Scenarios
As we look ahead to the coming week, WTI crude oil finds itself at a critical juncture, trading near the $101.19 level established at the end of last week. The prevailing sentiment is bullish, supported by strong daily technicals and persistent geopolitical supply risks. However, the market is not without its potential pitfalls, and understanding the key levels and scenarios will be crucial for traders seeking to navigate this volatile landscape.
The bullish scenario remains the primary outlook, contingent on WTI holding its ground above the immediate support at $100.77. This level, along with subsequent supports at $97.91 and $95.20, represents the floor that needs to hold for the uptrend to continue. If WTI successfully consolidates above $101.19 and then breaks through the initial resistance at $106.34, the next targets would be $109.05 and potentially the all-time high resistance zone around $111.91. The strong daily ADX (62.64) supports this view, suggesting that dips are likely to be shallow and bought. The RSI at 67.27 on the daily chart also indicates room for further upside, although traders should remain vigilant for signs of overbought conditions on shorter timeframes, which could lead to temporary consolidation.
The bearish scenario gains traction if WTI fails to hold the $100.77 support. A decisive break below this level, especially if accompanied by increasing volume and negative news flow, could trigger a more significant correction. Invalidation of the bullish trend would occur on a close below $100.77, opening the door to test the next support at $97.91. Further downside could then target $95.20. This scenario becomes more probable if geopolitical tensions ease unexpectedly, if global economic data deteriorates sharply, or if the US Dollar stages a significant rally. The overbought conditions on the 1-hour chart (RSI 79.21) serve as an early warning sign for this possibility, suggesting that a short-term reversal could be brewing.
A neutral or consolidation scenario is also possible, particularly if WTI struggles to decisively break through resistance or support levels. This could manifest as a period of sideways trading around the $101.19 mark, potentially between the $100.77 support and the $106.34 resistance. Such consolidation might occur if conflicting signals emerge – for example, if geopolitical news remains tense but economic data starts to show signs of weakness. In this scenario, shorter-term indicators might fluctuate, with RSI hovering around 50 and MACD showing choppy momentum. This phase could be a period of digestion before the market makes its next directional move, driven by a clearer fundamental catalyst or a resolution to current geopolitical uncertainties.
Looking at the economic calendar, the upcoming week holds several high-impact events that could influence WTI. While the specific dates are not provided, the mention of key releases for USD, GBP, and EUR suggests that macroeconomic data will be a significant factor. For instance, US Non-Farm Payrolls (NFP) data, if released and showing strong employment growth, could strengthen the dollar and potentially dampen oil prices, depending on the Fed's reaction. Conversely, weaker employment data might signal economic weakness, also potentially pressuring oil, unless it's interpreted as increasing the likelihood of Fed rate cuts, which could indirectly support risk assets. The Sterling (GBP) data releases will be important for EUR/USD and GBP/USD, and by extension, for the broader risk sentiment that can impact oil.
The market will also be keenly watching any developments regarding the geopolitical situation. News from the Middle East, particularly concerning the Strait of Hormuz and Iran's actions, remains paramount. Any signs of de-escalation could lead to a rapid unwinding of the geopolitical risk premium, while further escalation would likely reinforce the bullish trend. Similarly, updates on the conflict in Ukraine and its impact on Russian oil exports will be closely monitored.
From a technical perspective, traders will be focused on price action around the key support at $100.77 and resistance at $106.34. A clear break and hold above $106.34 would be a strong bullish signal, targeting $109.05 and $111.91. Conversely, a decisive move below $100.77 could signal a deeper correction, with $97.91 and $95.20 as potential downside targets. The high ADX on the daily chart suggests that these moves, when they occur, could be swift and significant.
The primary scenario favors continued upside, provided WTI holds above $100.77. Key resistance levels to watch are $106.34 and $111.91. The strong daily trend and geopolitical factors support this outlook.
FAQ Section
What happens if WTI breaks below $100.77 support this week?
If WTI breaks decisively below the $100.77 support level, it would invalidate the immediate bullish thesis. This could trigger a sell-off targeting the next support at $97.91, and potentially extend down to $95.20 as bears attempt to capitalize on renewed selling pressure.
Should I buy WTI at current levels near $101.19 given the RSI at 67.27?
Buying at current levels near $101.19 requires careful risk management. While the daily RSI at 67.27 suggests room for upside, the 1-hour RSI at 79.21 indicates short-term overbought conditions. A more prudent approach might be to wait for a pullback towards $100.77 support or confirmation of a breakout above $101.19 with sustained volume.
Is the RSI at 67.27 a sell signal for WTI right now?
An RSI of 67.27 on the daily chart is not typically considered a sell signal; it indicates strong bullish momentum. However, it suggests that the market is approaching, but has not yet reached, overbought territory. Traders should watch for divergence or a cross below 70 as a warning, especially in conjunction with shorter-term overbought indicators.
How will escalating Middle East tensions affect WTI prices this week?
Escalating Middle East tensions, particularly concerning the Strait of Hormuz and Russian oil exports, are likely to add a geopolitical risk premium to WTI prices. This could reinforce the bullish trend and potentially push WTI towards resistance levels like $106.34 and $111.91, as supply disruption fears mount.
Conclusion: The Path Forward for WTI
WTI crude oil closed last Friday near $101.19, firmly entrenched in a powerful uptrend characterized by a very strong daily ADX of 62.64. The bullish case is compelling, fueled by significant geopolitical risks in the Middle East, particularly concerning Iran and the Strait of Hormuz, alongside disruptions to Russian oil exports. These supply-side concerns are creating a substantial risk premium, pushing prices higher despite headwinds from a strengthening US Dollar and a risk-off sentiment in equity markets. The daily RSI at 67.27 suggests there is still room for upward momentum, reinforcing the primary bullish outlook.
However, the market is not without its complexities. Shorter-term technical indicators, such as the 1-hour RSI at 79.21, signal overbought conditions, hinting at potential short-term pullbacks or consolidation. Bears are watching closely for any failure to hold key support levels, particularly the $100.77 mark. A break below this could signal a reversal, targeting lower levels like $97.91 and $95.20. The broader economic outlook and the trajectory of central bank policies, while currently secondary to geopolitical drivers, remain underlying factors that could influence demand in the medium to long term.
The coming week will be critical for WTI. Key support at $100.77 and resistance at $106.34 will dictate the immediate direction. A hold above support could pave the way for a test of higher targets, while a break below could signal a significant correction. Traders must remain vigilant, managing risk carefully and looking for confirmation signals across multiple timeframes. The market's ability to digest current geopolitical tensions while navigating potential economic slowdowns will be the key determinant of WTI's path forward. Ultimately, while volatility is guaranteed, the current fundamental backdrop suggests that the path of least resistance for WTI remains to the upside, provided key support levels hold.
Technical Outlook Summary
| Indicator | Value | Signal | Interpretation |
|---|---|---|---|
| RSI (14) | 67.27 | Neutral | Strong momentum, nearing overbought on daily. Watch for divergence. |
| MACD Histogram | +0.89 | Bullish | Positive momentum confirmed on daily chart. |
| Stochastic | 39.82 / 46.48 | Bearish | Bearish crossover on daily, but not in overbought zone yet. |
| ADX | 62.64 | Bullish | Very strong uptrend identified on daily chart. |
| Bollinger | Above Mid Band | Bullish | Price trading above the middle band indicates upward bias. |
Key Levels
Support Levels
Resistance Levels
Bearish Reversal: Correction Looms
30% ProbabilityBullish Continuation: Upward Momentum Builds
60% ProbabilityConsolidation Phase: Range-Bound Indecision
10% ProbabilityTrack markets in real-time
AI-powered analysis, technical indicators and real-time price data.
Join Our Telegram Channel
Breaking market news, AI analysis and trading signals instantly.
Join Channel