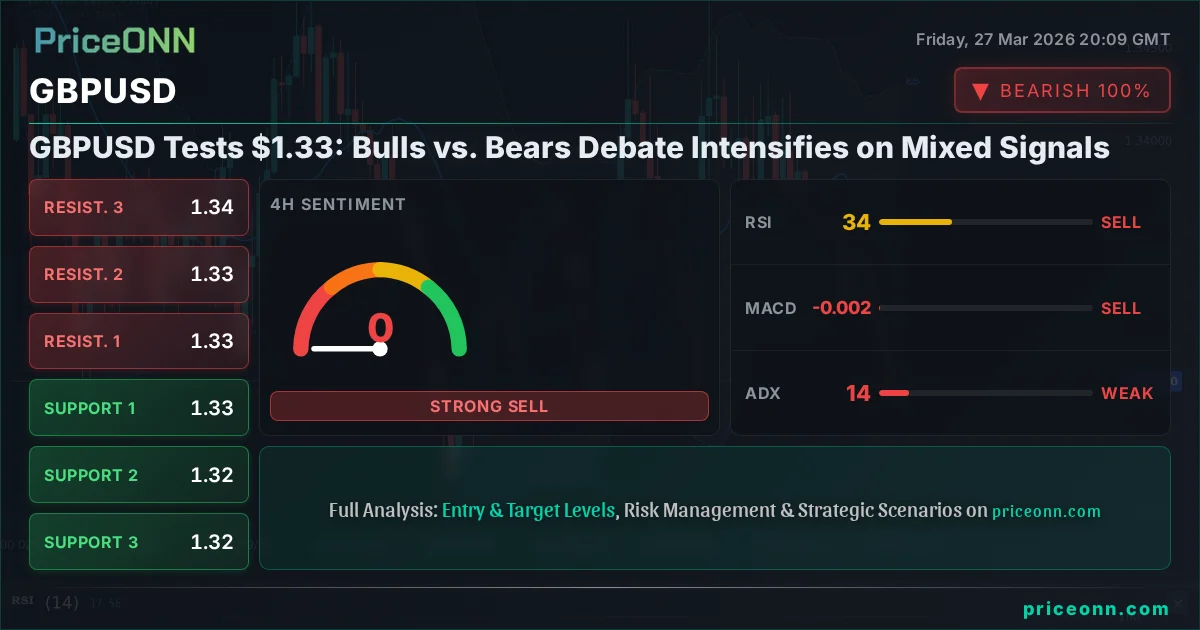
GBPUSD Tests $1.33: Bulls vs. Bears Debate Intensifies on Mixed Signals
GBPUSD hovers around $1.33 as mixed technical indicators and global risk sentiment create a tug-of-war. Is a breakout imminent or consolidation ahead?
The GBPUSD pair is currently locked in a fierce battleground around the critical $1.33 mark. This level, acting as a pivotal point, is where the bulls and bears are clashing, with a flurry of mixed signals from technical indicators and a backdrop of shifting global economic sentiment. Having seen significant intraday volatility, the question on every trader's mind is whether this price action is a precursor to a decisive move or merely a pause before further consolidation. Understanding the interplay between the Pound's own economic drivers and the broader market forces, particularly the strength of the US Dollar Index (DXY) and global risk appetite, is crucial for navigating this complex forex landscape. This analysis delves into the arguments for both sides, examining the technical underpinnings and fundamental catalysts that could dictate GBPUSD's next significant move.
- The RSI at 33.58 on the 1H chart signals potential oversold conditions, but the ADX at 16.17 indicates a weak trend, suggesting caution.
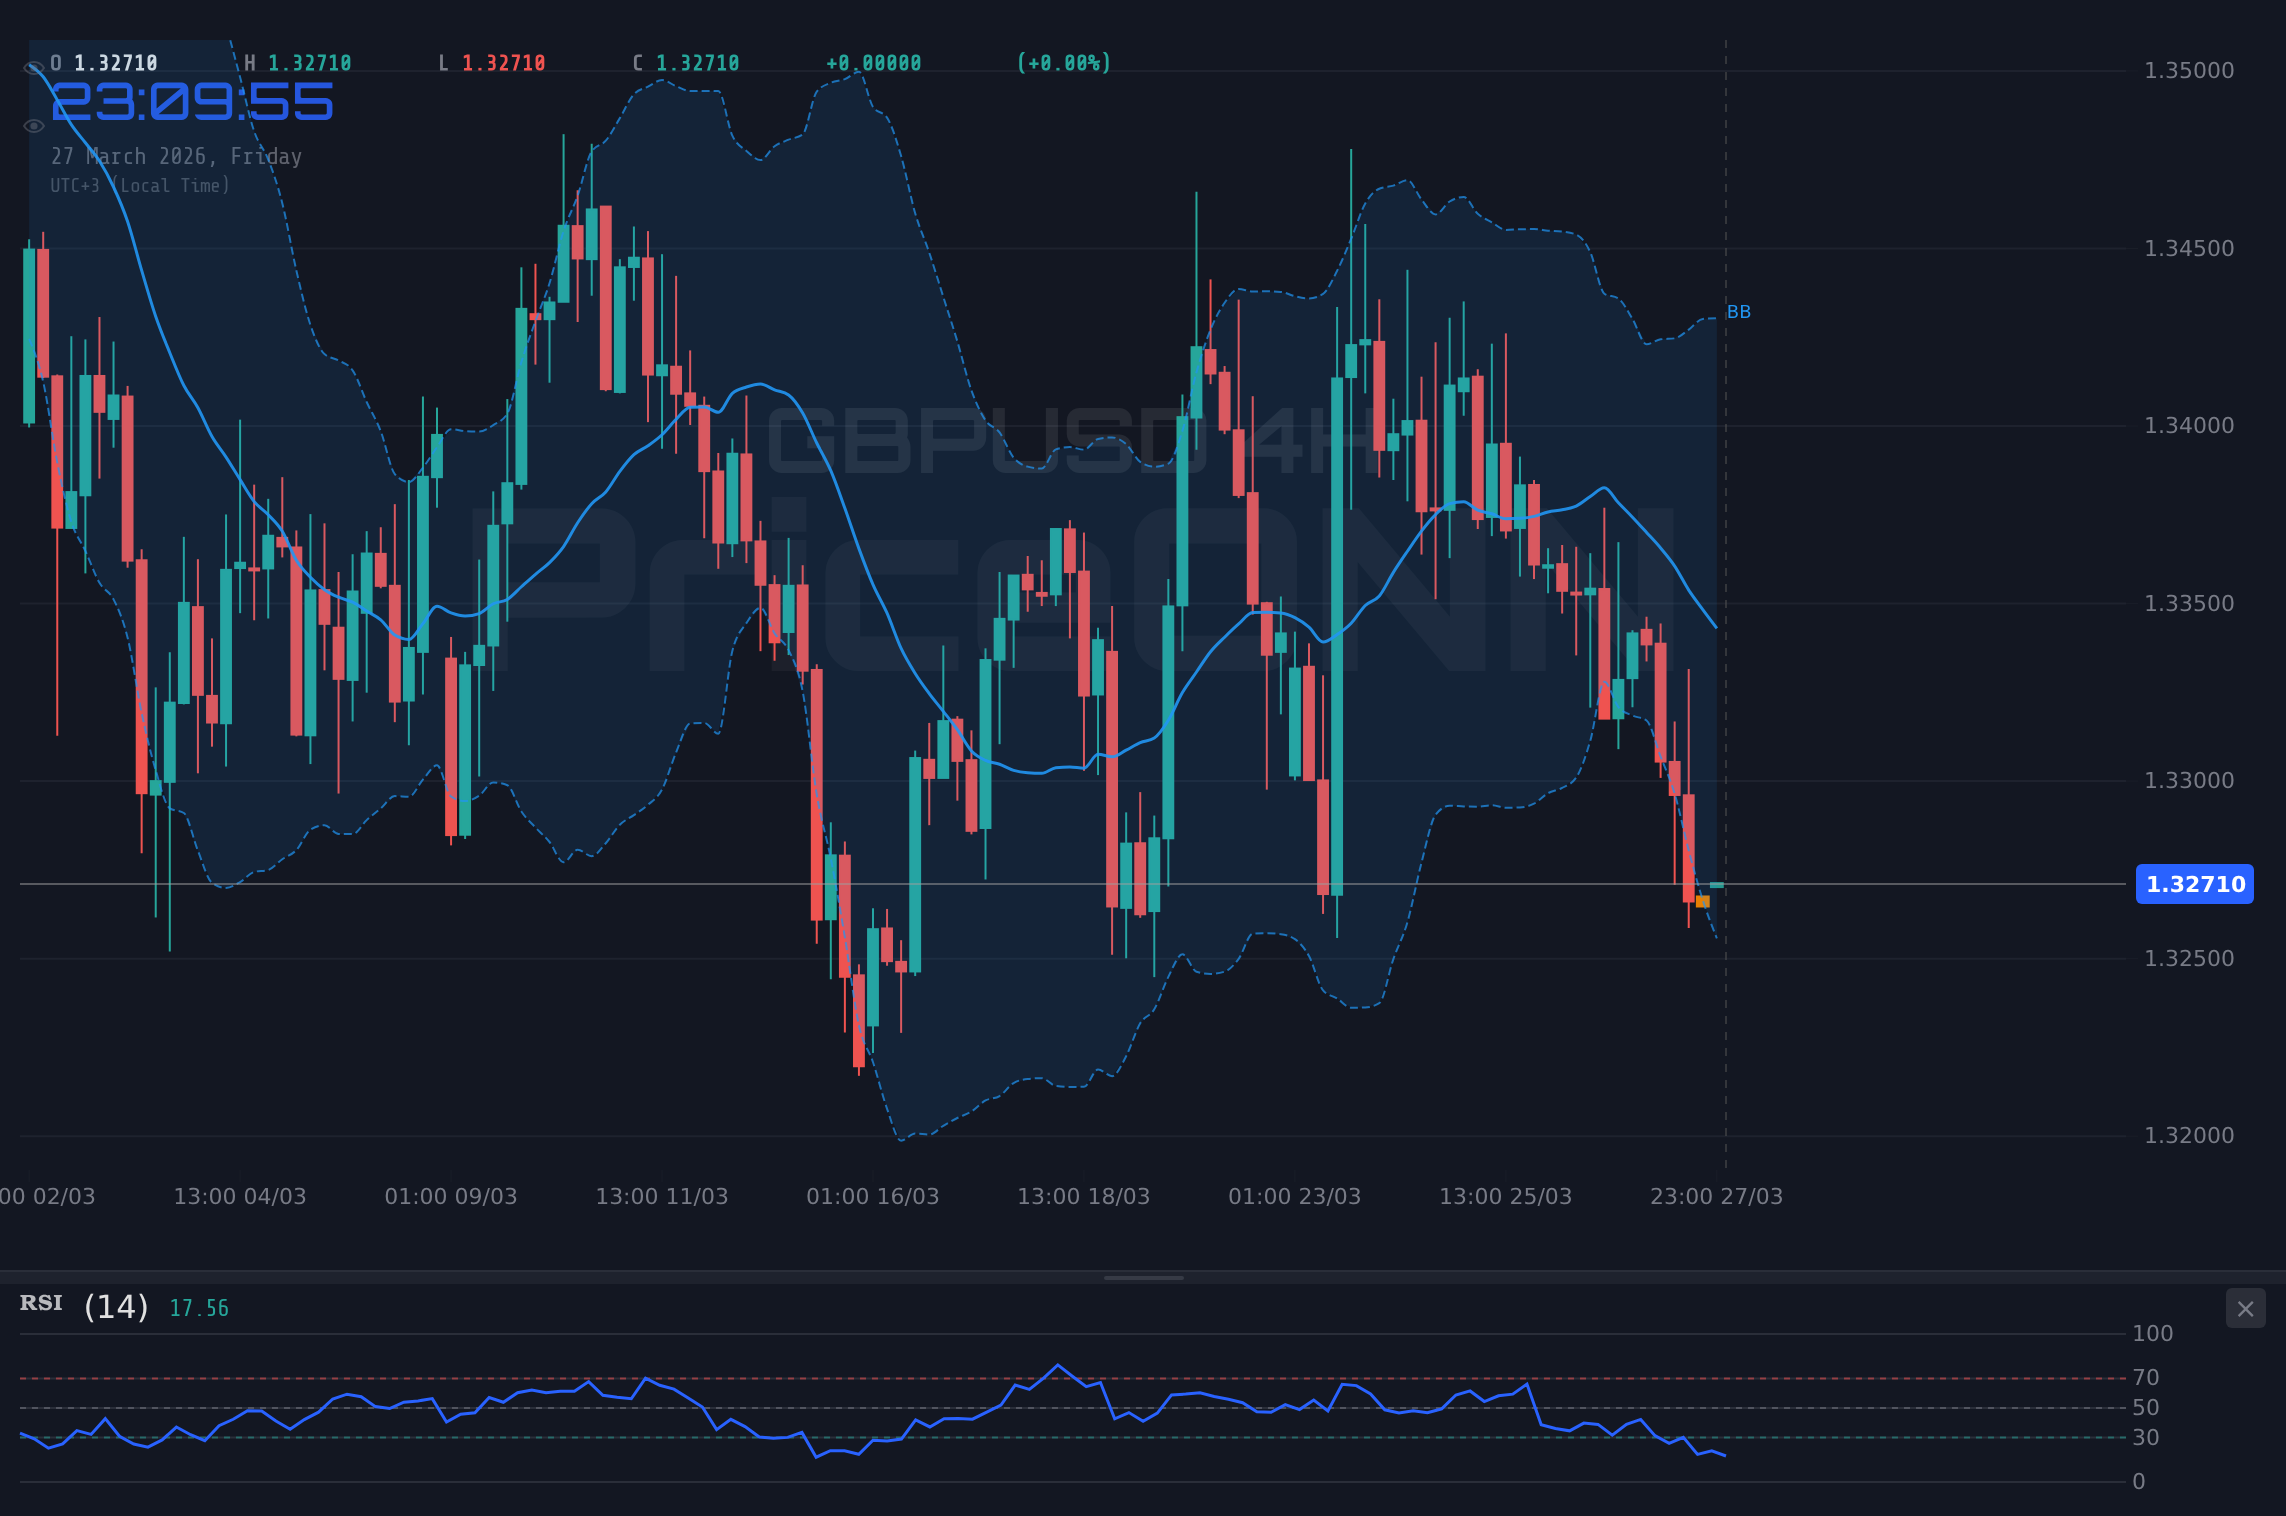
- Critical support for GBPUSD sits at $1.32723 on the 4H chart, tested multiple times this week, while resistance looms at $1.33643.
- MACD histogram shows negative momentum on the 4H chart, but the 1D chart MACD has turned positive, creating conflicting signals for trend direction.
- Fed rate hike probabilities and broader risk-off sentiment are currently driving DXY strength, impacting GBPUSD's correlation and overall direction.
The current market environment for GBPUSD is a classic example of indecision, where short-term technical readings often contradict longer-term trends. On the 1-hour timeframe, the pair is battling to hold the $1.33 level, with the RSI at 33.58 pointing towards oversold territory. This might suggest a potential for a short-term bounce. However, the ADX reading of 16.17 on the same timeframe paints a different picture, indicating a lack of strong trend momentum. This suggests that any upward movement might lack conviction and could be easily reversed. The Stochastic oscillator, with %K at 13.7 and %D at 23.9, also flashes a bearish signal, reinforcing the idea that the immediate pressure might be downwards, yet the weak ADX implies a lack of commitment from sellers.
Further complicating the short-term outlook, the MACD on the 1-hour chart shows negative momentum, with the histogram below the signal line. This aligns with the bearish leanings suggested by the Stochastic. However, when we zoom out to the 4-hour chart, the picture becomes more nuanced. The ADX here strengthens slightly to 13.78, still indicating a weak trend, but the RSI at 33.57 remains in oversold territory. The MACD on this timeframe is also negative, suggesting a bearish bias, yet the overall signal count across the 1H and 4H charts leans heavily towards selling. This divergence in short-term signals highlights the choppy nature of the current market, where scalping for quick profits might be possible, but a sustained directional trade remains elusive without clearer confirmation.
The daily chart presents an even more complex narrative. While the 1H and 4H timeframes show bearish leanings, the 1D MACD has actually turned positive, albeit with a weak histogram reading. This could be an early sign of a potential shift in momentum, or it could be a lagging indicator failing to capture the prevailing downward pressure. The daily RSI stands at 41.5, still in neutral territory but trending downwards, indicating that sellers still have the upper hand. The ADX on the daily chart is a notable 29.89, suggesting a strong downward trend is in place, which contradicts the nascent positive MACD signal. This conflicting information underscores the challenge for traders trying to establish a clear directional bias for GBPUSD at these levels. The market appears to be caught between the immediate oversold conditions on lower timeframes and the persistent bearish trend on the daily chart, all while global macro factors add another layer of uncertainty.
The 4-hour chart highlights key support levels that are crucial for GBPUSD's near-term trajectory. The primary support is identified at $1.32723. This level has been tested multiple times recently, and a decisive break below it could trigger further downside momentum, potentially targeting the subsequent support at $1.32486. Conversely, holding this level could provide a foundation for a short-term rebound, but the prevailing bearish sentiment suggests that any rallies might be met with selling pressure.
On the resistance side, the 1-hour chart shows immediate resistance at $1.32753, a level that has been a battleground throughout the recent trading sessions. A break above this could lead to a test of $1.32814 and then $1.32879. However, these are relatively minor levels compared to the significant resistance identified on the 4-hour chart at $1.33183. This level, along with subsequent resistance at $1.33406 and $1.33643, represents a more substantial hurdle for any bullish recovery. A sustained move above these resistance points would be necessary to challenge the prevailing bearish trend and suggest a more significant reversal is underway. The current price of $1.33 sits precariously between these immediate support and resistance zones, making it a critical junction.
The broader market context, particularly the strength of the US Dollar Index (DXY), plays a crucial role in GBPUSD's price action. With the DXY currently at 99.91 and showing a strong upward trend across all timeframes (1H, 4H, 1D), the dollar is exhibiting robust momentum. A rising DXY typically exerts downward pressure on currency pairs like GBPUSD, as it reflects a general preference for dollar-denominated assets. The DXY's strong bullish signals, with RSI at 69.84 on the 1H chart and ADX at 22.17, indicate that the dollar is likely to remain supported in the short to medium term. This correlation cannot be overstated; any significant move in the DXY will likely have a direct and inverse impact on GBPUSD.
The current market setup for GBPUSD is characterized by a weak trend (ADX below 20 on lower timeframes) coupled with conflicting momentum signals. This often leads to choppy price action and false breakouts. For swing traders, waiting for clearer directional signals on the daily chart or a confirmed break of key support/resistance levels is paramount. Scalpers might find opportunities in the intraday volatility, but risk management is key.
Furthermore, global risk sentiment is a significant driver. The S&P 500 is down 1.96% at 6360.4, and the Nasdaq 100 has fallen 2.17% to 23106.73. This risk-off environment typically favors safe-haven assets like the US dollar, further bolstering the DXY and adding pressure on riskier currencies or those perceived as less stable, like the Pound Sterling in certain contexts. The sharp decline in major US equity indices suggests that investors are becoming more risk-averse, potentially pulling capital away from assets perceived as higher-risk, which includes many emerging market currencies and could indirectly impact developed market pairs like GBPUSD.
The implications of this risk-off sentiment extend to commodity markets as well. Brent crude is trading at $109.67, showing a significant 5.83% daily gain, and WTI crude is up 6.76% to $100.31. Rising oil prices can have a dual effect: they can fuel inflation, potentially leading to tighter monetary policy and a stronger dollar, but they can also signal robust global demand or geopolitical supply disruptions. In the current context, with inflation already a concern, rising energy prices exacerbate those worries. This can contribute to a 'stagflationary' environment, where economic growth stagnates while inflation rises, a scenario that typically weighs on risk assets and supports currencies of countries perceived as having stronger economic resilience or more stable inflation outlooks.
For GBPUSD specifically, the Bank of England's (BoE) monetary policy stance remains a critical factor. While the market is currently pricing in a certain path for interest rates, any deviation from expectations or dovish commentary from BoE officials could weaken the Pound. Conversely, hawkish signals could offer some support. The current data shows a 3% reading for an unspecified GBP economic event, which has been consistent. Without further details on this event (e.g., if it's CPI, employment, or retail sales), its precise impact is hard to gauge, but consistency can sometimes be interpreted as stability, or conversely, a lack of progress if inflation remains sticky.
The correlation between GBPUSD and AUDUSD is also worth noting. AUDUSD is trading at $0.68718, down 0.22% on the day, and showing a strong downtrend across multiple timeframes. Both pairs are sensitive to global risk sentiment, and the weakness in the Australian dollar, often seen as a proxy for Asian economic health and commodity demand, reinforces the broader risk-off narrative. Similarly, NZDUSD is trading at $0.57442, also experiencing a decline and showing strong bearish signals on daily charts. The synchronized weakness across these commodity-linked currencies and GBPUSD suggests that the primary driver is indeed a global aversion to risk, leading investors to seek the perceived safety of the US dollar.
"The market is currently caught in a tug-of-war between oversold conditions on shorter timeframes and a persistent bearish trend on the daily chart. Navigating this requires patience and a focus on risk management."
Technically, the confluence of indicators presents a challenging picture. On the 1-hour chart, the Stochastic oscillator is in oversold territory, hinting at a potential bounce. However, the MACD histogram is negative, and the ADX at 16.17 suggests a lack of trend strength, making any bounce suspect. The 4-hour chart offers a similar conflict: Stochastic is rising from oversold, but the MACD remains negative, and the ADX, while slightly higher at 13.78, still signals a weak trend. It's on the daily chart where the bearish trend appears more established, with a strong ADX of 29.89 and a negative MACD, despite a recent turn to positive momentum. This daily trend strength is a significant factor, suggesting that short-term bounces may be opportunities for sellers to re-enter the market at better prices.
The recent economic data releases provide context for the current market dynamics. The USD saw its ISM Manufacturing PMI come in at 52.4, slightly above the forecast of 51.5, indicating continued expansion in the manufacturing sector, albeit at a slower pace than the previous month's 51.7. This data point supports the strength of the dollar. Simultaneously, the final reading for US Services PMI was 51.1, missing the forecast of 52 but still above the crucial 50 mark, suggesting ongoing service sector activity. The GBP saw its final services PMI remain steady at 3, which is consistent with previous readings, offering neither a strong bullish nor bearish signal for the Pound. The US Initial Jobless Claims figure came in at 6.926 million, a staggering number that reflects significant economic disruption, likely due to unforeseen events not detailed in the provided data. This surge in claims, while negative for the US economy, paradoxically supports the dollar in a risk-off environment as it reinforces safe-haven demand.
Considering the conflicting signals and the prevailing risk-off sentiment, the GBPUSD pair faces significant headwinds. The strong upward momentum in the DXY, coupled with declining equity markets and rising oil prices, creates an environment where the US dollar is likely to be favored. While oversold conditions on lower timeframes might offer temporary relief for GBPUSD, the underlying bearish trend on the daily chart, supported by a strong ADX, suggests that any rallies are likely to be sold into. The key levels to watch remain the support at $1.32723 and resistance around $1.33183-$1.33643. A decisive break below the support could accelerate the decline, while a sustained move above resistance would be needed to signal a potential trend change.
Bearish Scenario: Downside Pressure Mounts
65% ProbabilityNeutral Scenario: Range-Bound Consolidation
25% ProbabilityBullish Scenario: Short-Term Rebound Potential
10% ProbabilityFrequently Asked Questions: GBPUSD Analysis
What happens if GBPUSD breaks below the $1.32723 support level on the 4-hour chart?
A close below $1.32723 on the 4-hour chart would invalidate any immediate bullish hopes and likely trigger further downside. The bearish scenario suggests a potential move towards $1.32486, as this level represents significant support and a psychological barrier.
Should I consider buying GBPUSD at current levels around $1.33 given the oversold RSI on the 1H chart?
Buying at current levels carries significant risk due to the weak trend indicated by the ADX (16.17) and the bearish daily trend. While the 1H RSI is oversold, confirmation such as a break above resistance or a clear shift in daily momentum is needed before considering a long position.
Is the RSI at 33.58 a strong sell signal for GBPUSD right now?
An RSI of 33.58 indicates oversold conditions, which is typically a signal for potential buying or a pause in selling, not a direct sell signal. However, in the context of a strong daily downtrend (ADX 29.89), oversold conditions can persist, and any bounce might be an opportunity for sellers to re-enter.
How will the strong DXY trend at 99.91 affect GBPUSD this week?
The robust upward trend in the DXY at 99.91 suggests continued dollar strength, which typically exerts downward pressure on GBPUSD. Unless there's a significant shift in Fed policy expectations or a major geopolitical event favoring the Pound, the strong DXY is likely to cap any potential rallies in GBPUSD.
Track markets in real-time
AI-powered analysis, technical indicators and real-time price data.
Join Our Telegram Channel
Breaking market news, AI analysis and trading signals instantly.
Join Channel