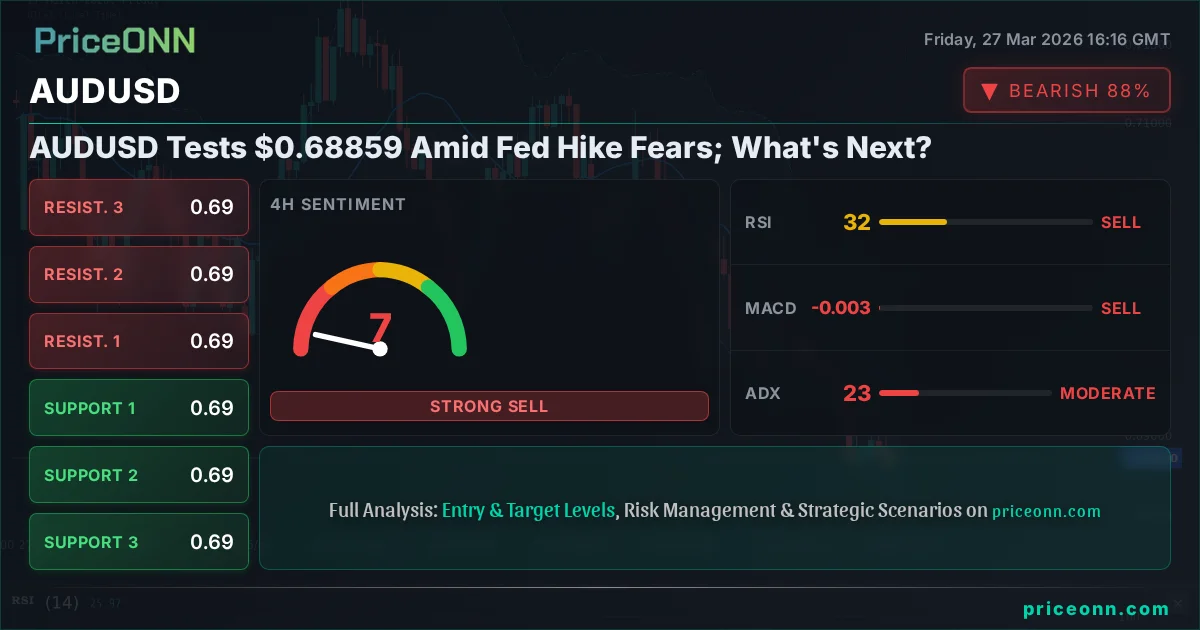
AUDUSD Tests $0.68859 Amid Fed Hike Fears; What's Next?
AUDUSD hovers near $0.68859 as renewed inflation concerns fuel Fed rate hike speculation. Is a deeper correction or a bounce in play? Analysis inside.
The narrative around the Fed is shifting, and it's casting a long shadow over currencies like the AUDUSD. As traders digest fresh inflation data that seems to defy the central bank's efforts, the Aussie dollar finds itself teetering near the $0.68859 mark. This isn't just another day of forex trading; it's a critical juncture where the market is reassessing its expectations for monetary policy, and by extension, the future path of risk assets. The question on everyone's mind is: are we looking at a sustained downtrend for AUDUSD, or is this a setup for a potential rebound as the market digests the latest economic signals?
- RSI at 42.79 on the 1H chart signals bearish pressure, suggesting room for further downside.
- Critical support for AUDUSD sits at $0.68819, a level tested multiple times this week.
- The ADX at 20.69 indicates a weak trend, meaning a breakout could be imminent but lacks strong directional conviction.
- Fed rate hike expectations are driving AUDUSD correlation with DXY, which is currently strong at 99.87.
The recent surge in inflation figures, with the latest USD release showing an actual of 52.4 against a forecast of 51.5, has thrown a spanner in the works for those anticipating a dovish Federal Reserve. This unexpected uptick suggests that the fight against inflation is far from over, and crucially, it's forcing traders to price in a higher probability of further tightening. The market is now pricing in a 52% chance of a Fed rate hike by year-end, a stark contrast to just weeks ago when cuts were the dominant theme. This shift in sentiment is a major driver for the US Dollar Index (DXY), which has climbed to 99.87, reflecting renewed greenback strength. When the DXY strengthens, it typically exerts downward pressure on currency pairs like AUDUSD, given the inverse relationship, and the current data supports this dynamic.
Why the Aussie is Feeling the Pinch
The Australian dollar, often seen as a barometer for global risk appetite due to its sensitivity to commodity prices and China's economic health, is facing a multi-pronged assault. On the domestic front, while the latest GBP print showed stable inflation at 3%, the overall economic picture for Australia, as suggested by the AUD/JPY pair's tumble to 103 amid stagflation fears, is becoming increasingly concerning. The idea of stagflation – a toxic mix of stagnant economic growth and high inflation – is a red flag for any commodity-linked currency. The Reserve Bank of Australia (RBA) finds itself in a precarious position, caught between the need to control inflation and the risk of choking off an already fragile economic recovery. This delicate balancing act creates uncertainty, which is anathema to currency strength.
Furthermore, the global risk-off sentiment, amplified by the surge in oil prices (Brent crude at $108.41 and WTI at $98.63, both showing strong upward momentum), adds another layer of complexity. In times of heightened geopolitical tension and inflation worries, investors tend to flee to perceived safe-haven assets. While the US dollar is acting as a safe haven, the Australian dollar, being more sensitive to global growth prospects, often suffers. The S&P 500's sharp decline of 1.07% to 6417.85 and the Nasdaq's 1.27% drop to 23319.3 are clear indicators of this risk aversion. This broad market selloff creates headwinds for the AUDUSD, pushing it closer to its support levels.
Navigating the Technical Landscape
Looking at the AUDUSD chart, the technical picture paints a cautious, if not bearish, short-term outlook. On the 1-hour timeframe, the Relative Strength Index (RSI) sits at 42.79, indicating that while not deeply oversold, there's still room for momentum to the downside before reaching oversold territory. The Moving Average Convergence Divergence (MACD) histogram shows positive momentum, but this is within the context of a downtrend, suggesting that upward price action might be short-lived or part of a corrective move rather than a sustained reversal. The Average Directional Index (ADX) at 20.69 points to a moderately trending market, but the lack of strong conviction means that any breakout could be prone to false signals. This is a market where patience is key; jumping in too early could lead to being caught on the wrong side of a volatile move.
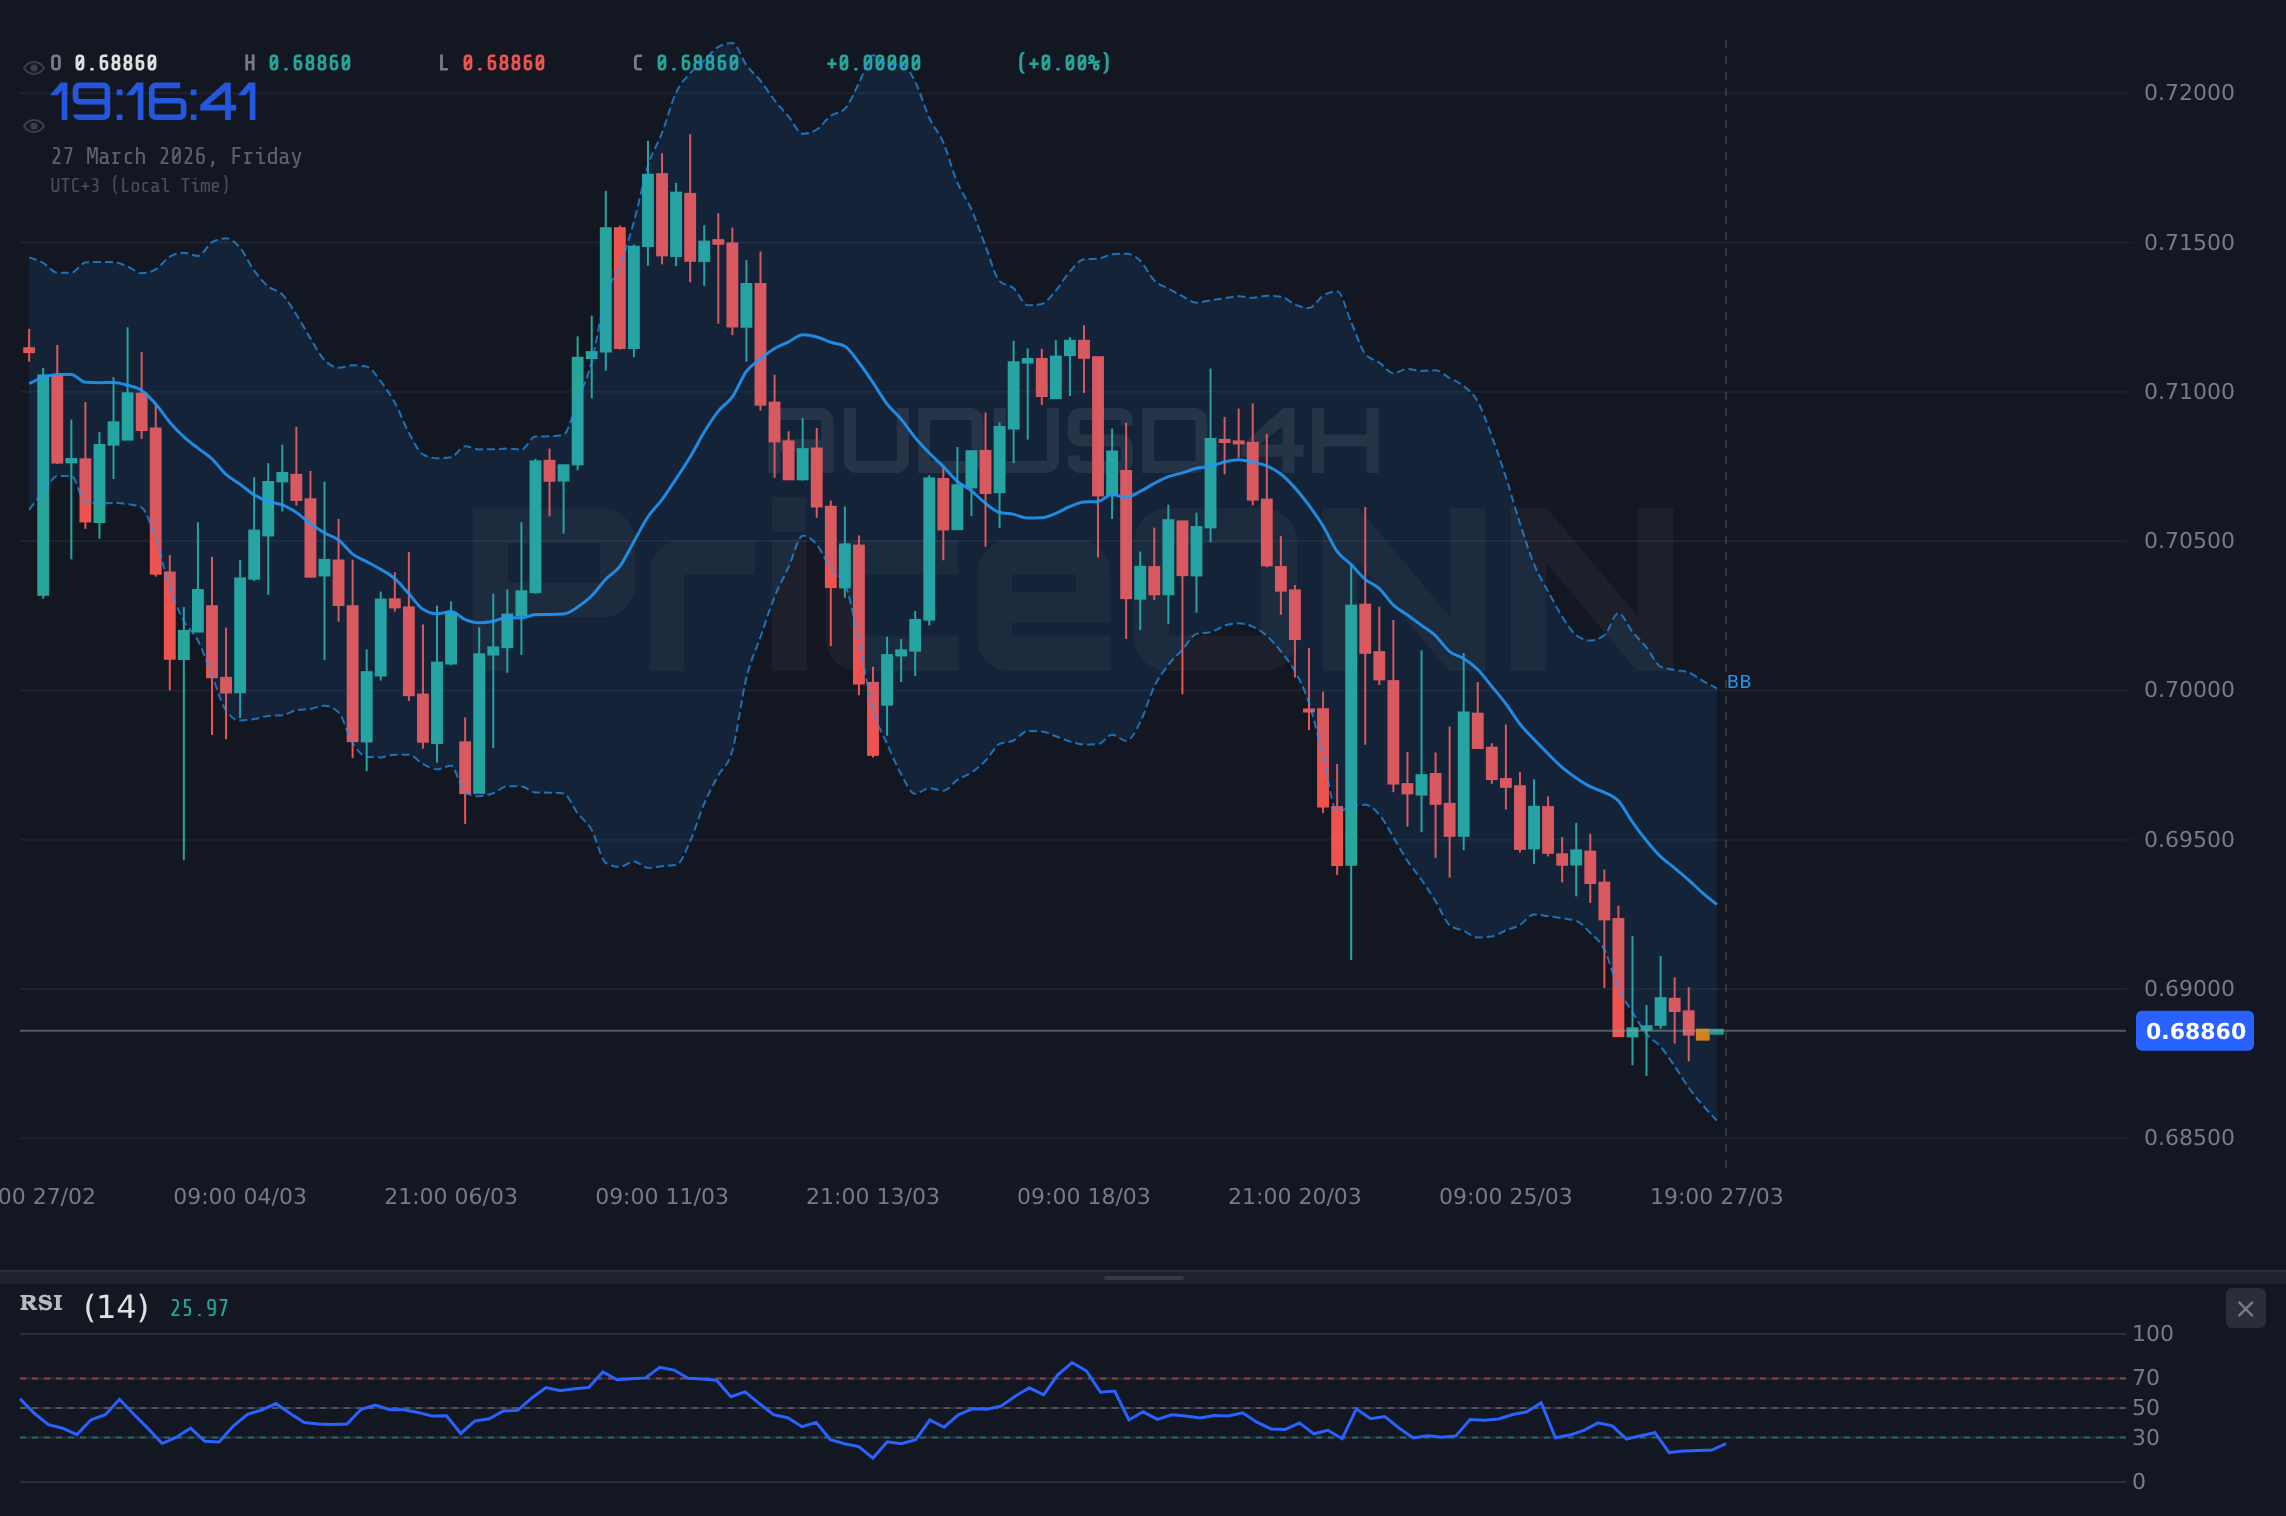
The 4-hour chart offers a slightly different, yet still cautionary, perspective. The RSI is at 32.15, moving closer to oversold territory but still not quite there. The MACD is firmly in negative territory, reinforcing the bearish sentiment on this timeframe. The ADX here is at 22.95, indicating a somewhat stronger downtrend than on the 1-hour chart. The Stochastic Oscillator, with %K at 23.23 and %D at 16.67, shows a potential for a bounce as the %K line is above the %D line, but this is happening from extremely low levels, suggesting any rally might be shallow. The proximity to the support level at $0.68816 is significant. A decisive break below this could open the floodgates towards the next major support at $0.68705.
On the daily chart, the situation becomes even more telling. The RSI is languishing at 38.48, firmly in the bearish camp and showing a clear downward trend. The MACD histogram is negative, confirming the prevailing bearish momentum. The ADX at 24.69 suggests a consolidating downtrend, where price action can be choppy. The Stochastic Oscillator (%K=9.21, %D=26.06) is deeply oversold and showing a bearish crossover (%K < %D), which, while often a leading indicator of a potential reversal, can also persist in strong downtrends. Given these readings, the immediate path of least resistance for AUDUSD appears to be lower, especially if the broader risk-off sentiment continues to dominate global markets.
The Macroeconomic Crosscurrents
The recent economic calendar highlights the delicate balance the market is trying to strike. The USD figures for the Manufacturing PMI (Actual: 52.4 vs. Forecast: 51.5) and ISM Services PMI (Actual: 51.1 vs. Forecast: 52) paint a mixed picture of the US economy. While manufacturing showed surprising strength, the services sector indicated a slight cooling. However, the market seems to be latching onto the inflation data as the dominant narrative, overshadowing these mixed signals. The fact that the Fed is reportedly shifting focus back to inflation concerns, viewing the labor market as balanced, is a critical development. This suggests that any hopes for an imminent pivot to rate cuts are likely premature, and the possibility of a hike, however small, is now a tangible risk.
This renewed focus on inflation and potential rate hikes by the Fed directly impacts the DXY. With the index currently at 99.87 and showing a strong upward trend on the daily chart (ADX: 31.92), the dollar is poised to remain strong in the short to medium term. This strength in the dollar creates a headwind for AUDUSD. The correlation between AUDUSD and the DXY is typically inverse, and with the DXY showing robust upward momentum, AUDUSD is likely to face continued pressure. The fact that AUDUSD has an ADX of 20.69 on the 1H chart suggests a weak trend, making it susceptible to the broader dollar strength.
Looking ahead, the upcoming economic data releases will be crucial. Any further signs of persistent inflation in the US could solidify the hawkish stance of the Fed, further boosting the dollar and pressuring AUDUSD. Conversely, a significant cooling in inflation or a sharp deterioration in the US labor market could shift sentiment back towards a more dovish outlook, offering some relief to the Aussie. For now, the market appears to be pricing in the former, with the DXY showing strength and AUDUSD trading near its support levels. The ongoing geopolitical tensions, particularly those affecting oil prices, also play a role, as higher energy costs can contribute to inflationary pressures globally, complicating central bank decisions.
Trading Scenarios and Risk Management
Given the current technical and fundamental backdrop, several scenarios are plausible for AUDUSD. The prevailing sentiment leans bearish, but the weak trend strength indicated by the ADX suggests that volatility could lead to sharp reversals. Therefore, a nuanced approach is required, focusing on clear triggers and invalidation levels.
Bearish Scenario: Downside Momentum Continues
65% ProbabilityNeutral Scenario: Range-Bound Consolidation
25% ProbabilityBullish Scenario: Surprise Rebound
10% ProbabilityRisk management is paramount in this environment. For those considering a bearish position, a close below the $0.68819 support level on the 1-hour chart would be a key trigger. The invalidation point for this trade would be a decisive close above the $0.69091 resistance. Initial targets would be set at $0.68705, followed by $0.68594. Conversely, a bullish scenario would require a convincing breakout above $0.69091, ideally with increasing volume, invalidating the bearish thesis if price closes back below $0.68819. The targets in this case would be $0.69260 and potentially higher towards $0.69368. A neutral scenario anticipates continued choppiness within the current range, with price oscillating between the immediate support and resistance levels.
The Importance of DXY and Risk Sentiment
The current market sentiment is heavily influenced by the DXY's strength, currently at 99.87. This strength is a direct consequence of the renewed fears surrounding Fed policy. As the DXY pushes higher, it puts natural pressure on AUDUSD. The fact that the ADX on the 1-hour chart is relatively low at 20.69 suggests that the trend, while bearish, lacks strong conviction. This means that the market is susceptible to shifts in sentiment. If, for instance, upcoming US data surprises to the downside or geopolitical tensions ease, we could see a swift reversal. However, based on the current data, the path of least resistance remains downwards.
The correlation with broader risk sentiment cannot be overstated. With the S&P 500 down 1.07% and the Nasdaq down 1.27%, the 'risk-off' mood is palpable. This environment typically favors the US dollar and puts pressure on commodity-linked currencies like the Australian dollar. While gold prices have surged 3.36% to $4525.31, indicating a flight to safety in some asset classes, the broader equity markets are signaling caution. This mixed picture requires traders to be vigilant. The AUDUSD's own ADX on the daily chart at 24.69 confirms a trend is in place, but its moderate strength implies that significant catalysts are needed to drive sustained momentum in either direction. For now, the Fed narrative appears to be the dominant force.
When to Watch for a Shift
A potential shift in the AUDUSD's trajectory would likely be signaled by a combination of factors. Firstly, a sustained break above the immediate resistance at $0.69091, coupled with strong volume, would challenge the bearish outlook. Secondly, a significant change in the Fed's tone or US inflation data showing a clear and sustained downtrend could alter market expectations and support a recovery. On the flip side, any further escalation in geopolitical risks or a surprise hawkish move from the Fed would likely reinforce the current downtrend. The AUDUSD fundamentals analysis remains key, but in the short term, the Fed's policy path and the resulting dollar strength are the primary determinants of price action.
Frequently Asked Questions: AUDUSD Analysis
What happens if AUDUSD breaks below the $0.68819 support level?
If AUDUSD decisively breaks below $0.68819, the bearish scenario gains traction. The next target would be $0.68705, followed by $0.68594. This move would be invalidated if price closes back above $0.69091.
Should I consider buying AUDUSD at current levels of $0.68859 given the RSI is at 42.79?
Buying at $0.68859 is risky with the RSI at 42.79 and a bearish trend on multiple timeframes. A more prudent approach would be to wait for a confirmed bullish signal, such as a break above $0.69091 resistance, with a probability estimate favoring downside currently.
Is the RSI at 42.79 a sell signal for AUDUSD right now?
An RSI of 42.79 is not an extreme sell signal but indicates bearish momentum is present. It suggests there's room for price to fall further before reaching oversold conditions, reinforcing the cautious outlook for AUDUSD.
How will the Fed's potential rate hike affect AUDUSD this week?
If the Fed signals a higher probability of a rate hike, the US Dollar (DXY) would likely strengthen further, pushing AUDUSD lower. This outcome is currently the market's dominant expectation, suggesting continued pressure on the Aussie.
Track markets in real-time
AI-powered analysis, technical indicators and real-time price data.
Join Our Telegram Channel
Breaking market news, AI analysis and trading signals instantly.
Join Channel