SP500 Dips to $6,426.45 as Rate Hike Fears Resurface
SP500 tests critical support at $6,426.45 amid rising inflation concerns and shifting Fed policy expectations. Technicals show mixed signals with oversold conditions.
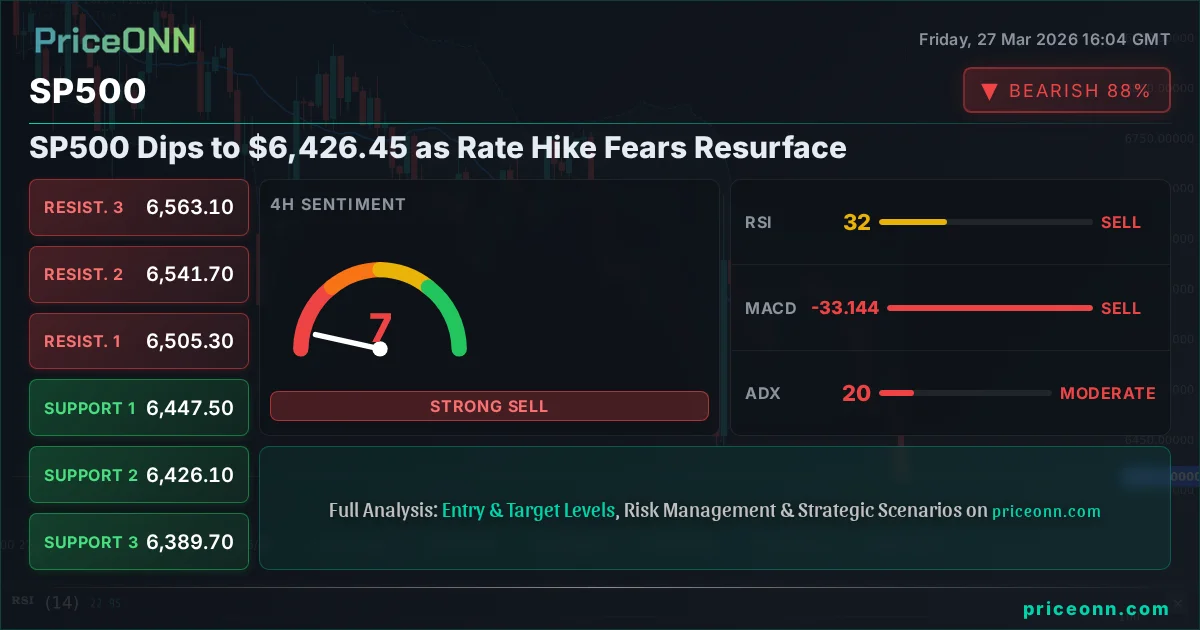
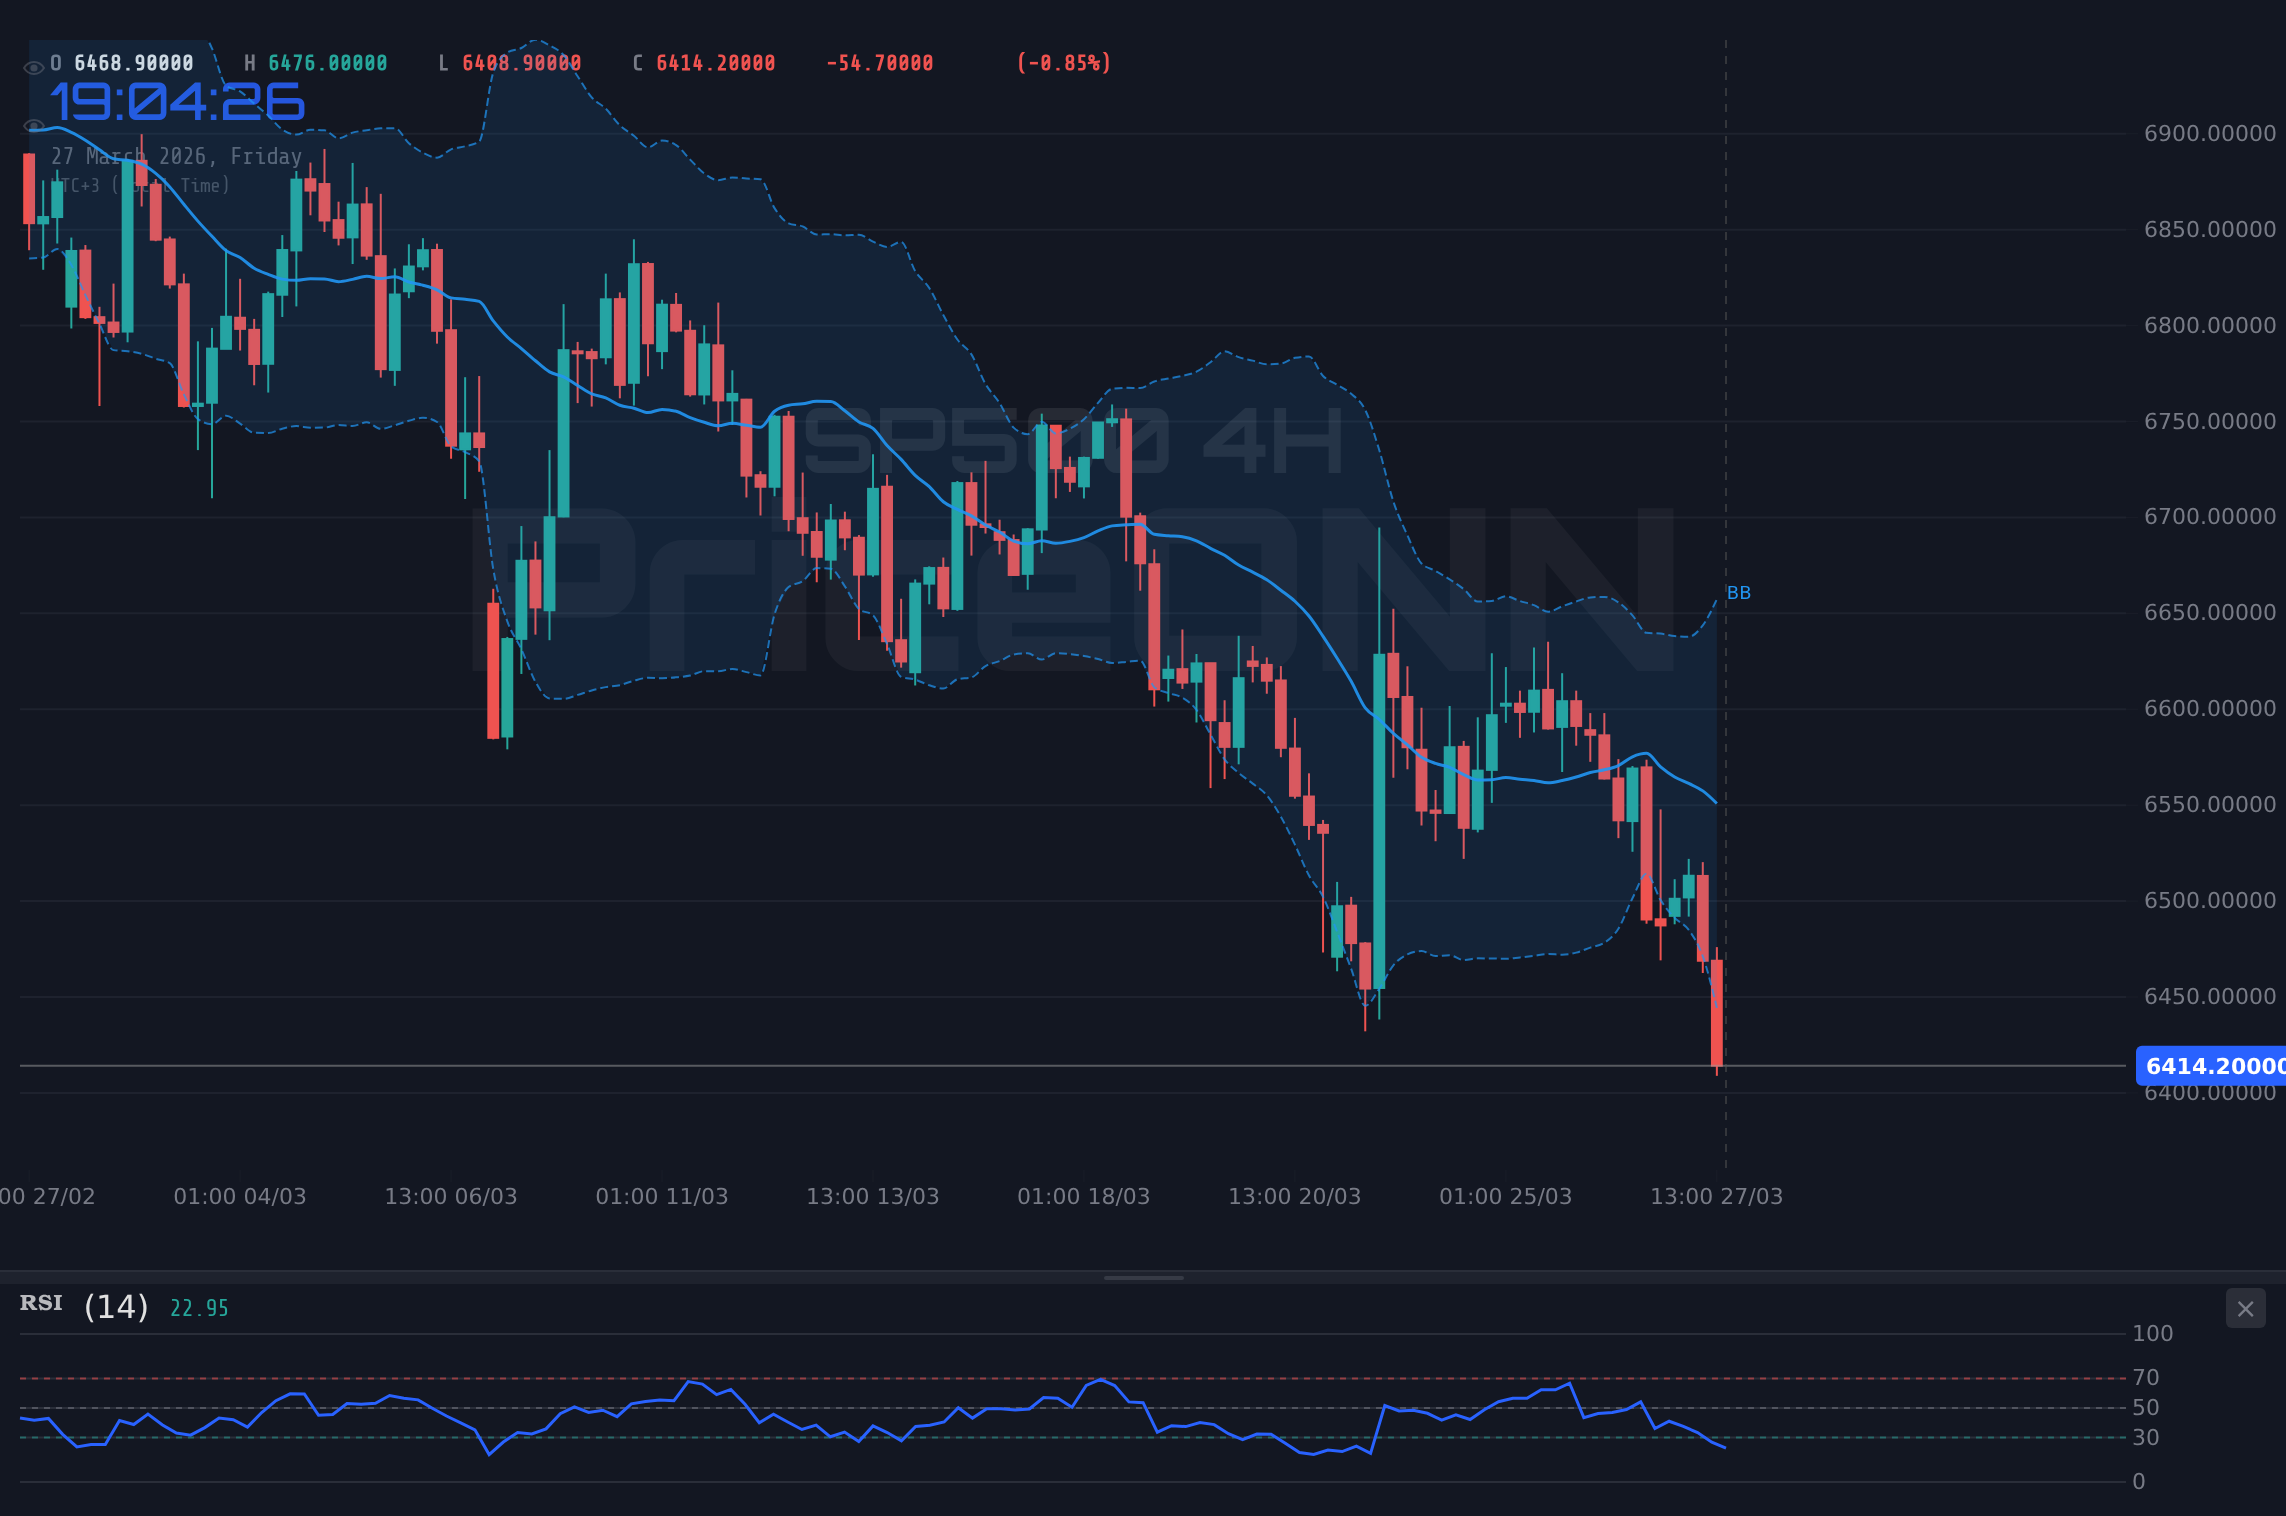
The S&P 500 (SP500) is currently trading at $6,426.45, a level that is drawing significant attention as market participants grapple with a complex interplay of resurgent inflation fears and the Federal Reserve's potential policy pivots. Today's analysis delves into the technical underpinnings of this crucial price point, examining how indicators like RSI, MACD, and Stochastic are painting a picture of caution, while also considering the broader market context, including dollar strength and equity correlations. We'll explore the key levels that traders are watching and what the current data suggests for the immediate future of the U.S. equity benchmark.
- The S&P 500 is currently testing support at $6,426.45, with the 4-hour RSI at 32.27 indicating oversold conditions.
- Key support levels are identified at $6,411.63 (S1) and $6,397.17 (S2), while immediate resistance lies at $6,436.13 (R1).
- The MACD histogram on the 1-hour chart shows negative momentum, aligning with the bearish sentiment currently gripping the index.
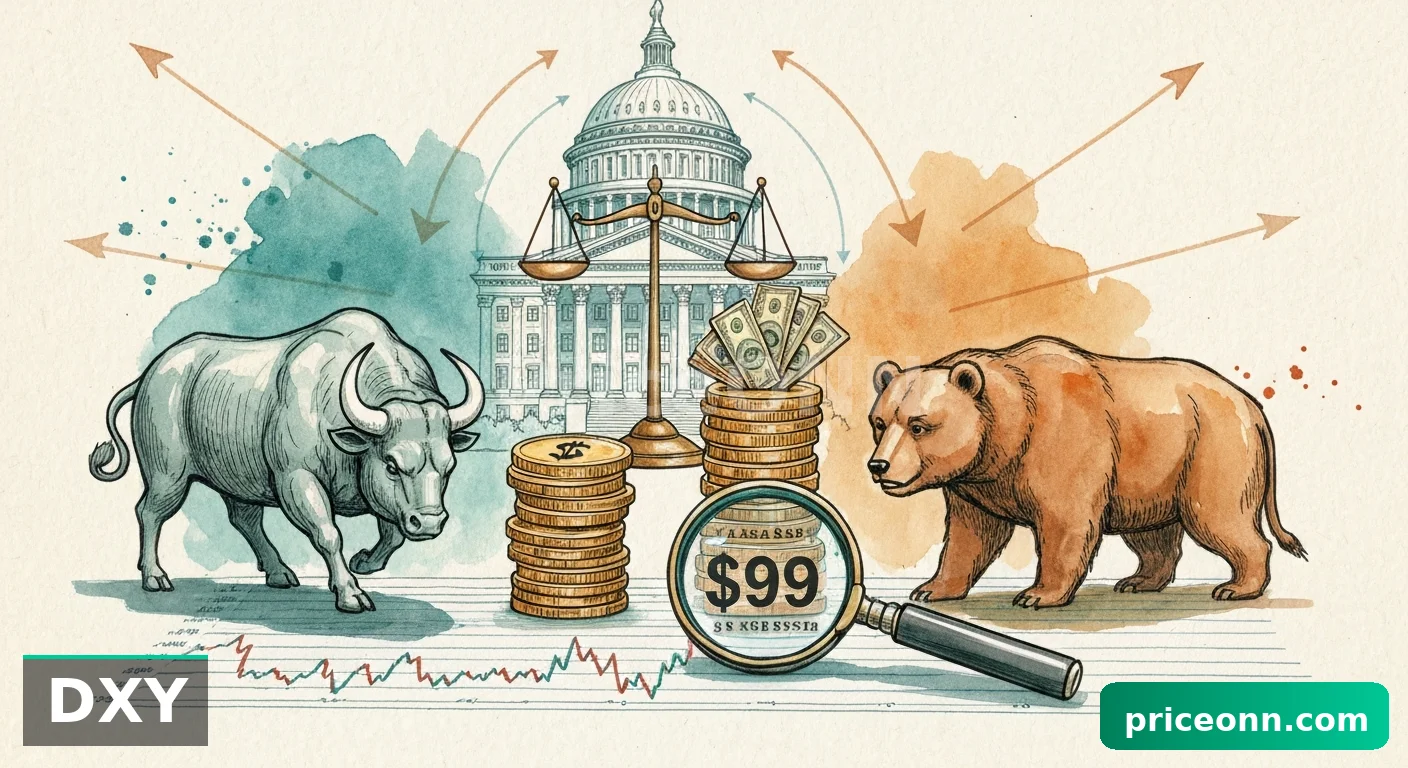
- DXY strength, currently at 99.85, is exerting pressure on risk assets like the SP500, reflecting a broader risk-off sentiment.
The market's reaction to recent economic data has been swift and decisive. The latest figures revealed a concerning uptick in inflation, with one key USD indicator showing an actual reading of 52.4 against a forecast of 51.5. This deviation from expectations has reignited concerns that the Federal Reserve might be forced to reconsider its stance on interest rates. While the labor market has shown signs of balance, as indicated by another USD release where actual figures landed at 51.1 against a forecast of 52, the persistent inflation numbers are becoming increasingly difficult to ignore. This shift in sentiment is palpable across financial markets, creating headwinds for riskier assets like equities.
The SP500's current price action at $6,426.45 is a critical juncture. On the 4-hour timeframe, the Relative Strength Index (RSI) hovers at 32.27, a level typically associated with oversold conditions. This suggests that the selling pressure might be nearing exhaustion, potentially setting the stage for a short-term bounce. However, the Moving Average Convergence Divergence (MACD) histogram on the 1-hour chart continues to print negative momentum, indicating that the bearish sentiment still holds sway in the shorter term. This divergence between the oversold RSI and the negative MACD warrants careful observation, as it often precedes a period of consolidation or a potential reversal, but confirmation is key.
Looking at the broader trend, the daily chart paints a more definitive picture. The ADX, a measure of trend strength, stands at a robust 47.43 on the daily timeframe, signaling a strong downtrend. This is further corroborated by the Bollinger Bands, which show the price trading below the middle band, a classic bearish indicator. The Stochastic Oscillator on the daily chart, with K=23.69 and D=30.72, also suggests a bearish signal, with the %K line below the %D line, reinforcing the prevailing downward momentum. Despite these bearish signals on the longer timeframe, the oversold readings on shorter timeframes (1H and 4H) suggest that any immediate push higher might face resistance from the prevailing trend.
Navigating the Dollar's Strength and Risk Sentiment
The Dollar Index (DXY) is currently showing significant strength, trading at 99.85, with a notable daily increase of 0.28%. This upward movement in the dollar is historically correlated with pressure on commodities and major currency pairs like EURUSD and GBPUSD. As the dollar strengthens, it often signals a 'risk-off' sentiment in the broader market, where investors flock to perceived safe-haven assets. This dynamic is currently playing out, with the SP500 and Nasdaq facing headwinds. The correlation is clear: as the DXY pushes higher towards the psychological 100 level, equity indices tend to struggle, especially when inflation data suggests the Fed might need to maintain a hawkish stance for longer than previously anticipated. This inverse relationship is a critical factor for any investor looking to understand the current market dynamics.
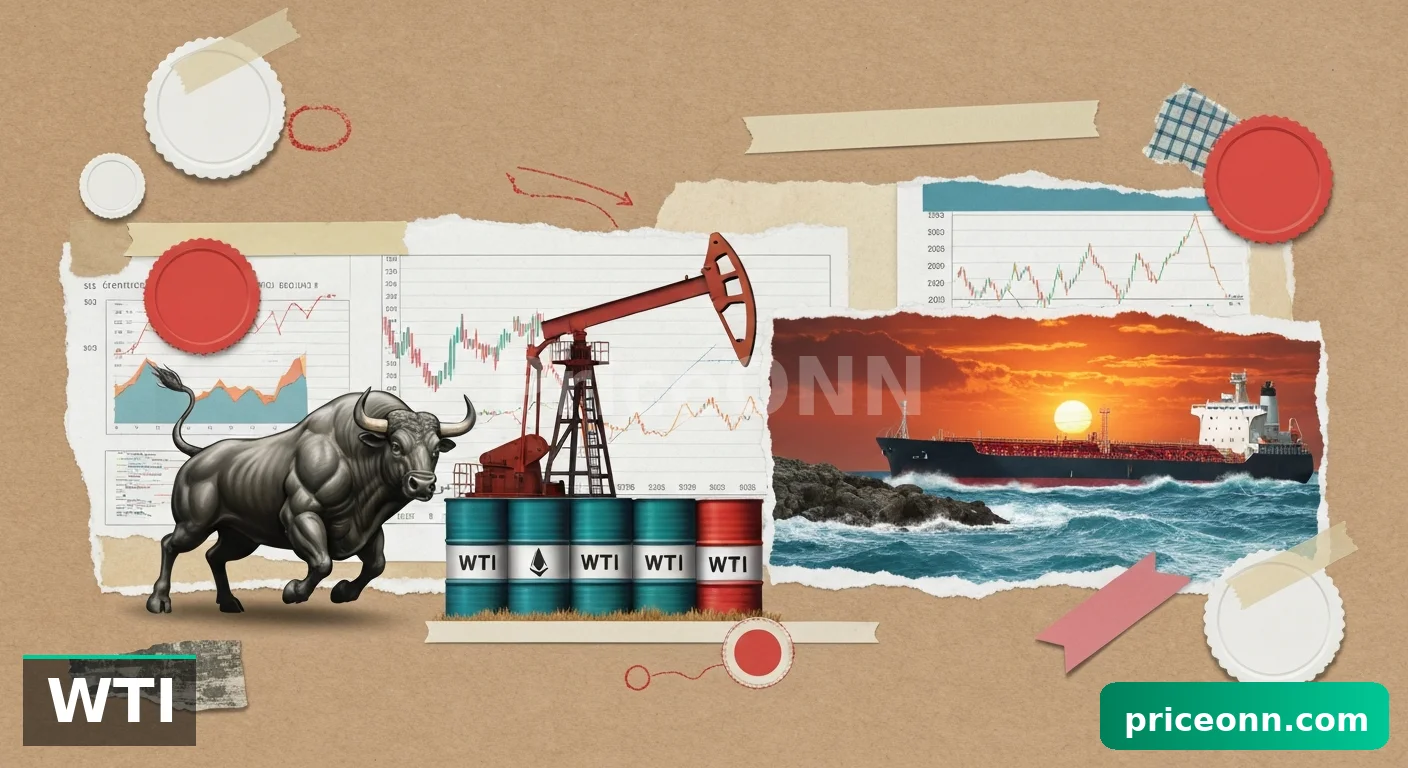
The current environment is characterized by a palpable sense of caution. The recent surge in oil prices, with Brent Crude at $107.91 and WTI at $98.12, adds another layer to the inflation narrative. Higher energy costs typically translate to increased inflation expectations, which in turn can influence central bank policy. For the Fed, this presents a delicate balancing act: combatting inflation without tipping the economy into a recession. The market is keenly watching for any signs that the Fed might be leaning towards another rate hike, a prospect that has been increasingly priced in by traders according to Fed Funds futures. This uncertainty is a primary driver of the current volatility across asset classes.
The correlation between the US equity markets and the dollar index is a significant theme. With the DXY at 99.85, we are seeing a clear inverse relationship that weighs on the SP500. The index is currently trading at $6,426.45, a critical support level. If the dollar continues its ascent, driven by renewed Fed hawkishness or global risk aversion, it is likely to exacerbate the downward pressure on the SP500. Conversely, any sign of stabilization in the dollar or a shift towards a more dovish Fed outlook could provide much-needed relief to equity markets. This cross-asset correlation is paramount for understanding the broader market sentiment and potential trading opportunities.
Key Price Levels and Technical Signals
The SP500's technical landscape reveals several crucial price points that are dictating the current market sentiment. Immediate support is observed at $6,411.63 (S1), followed by a more significant level at $6,397.17 (S2). A break below S2 would likely trigger further downside, potentially targeting the $6,387.13 level (S3). On the resistance side, the index faces immediate hurdles at $6,436.13 (R1) and $6,446.17 (R2). A sustained move above these levels would be necessary to invalidate the current bearish bias and suggest a potential short-term recovery. The 1-hour chart shows resistance at $6,436.13, a level that has acted as a pivot point in recent trading sessions.
The confluence of indicators on the 1-hour chart presents a mixed picture, which is typical during periods of heightened uncertainty. While the RSI at 29.89 suggests oversold conditions, hinting at a potential bounce, the MACD histogram remains in negative territory, indicating bearish momentum is still present. The Stochastic Oscillator, with K=13.49 and D=8.99, is deeply in oversold territory, further reinforcing the potential for a near-term rebound. However, the ADX at 25.94 on the 1-hour chart indicates a moderately strong downtrend is in play, suggesting that any bounce might be short-lived unless significant buying conviction emerges. This conflicting signal set requires traders to exercise patience and wait for clearer confirmation.
On the 4-hour timeframe, the picture remains predominantly bearish. The RSI sits at 32.27, still in oversold territory but less extreme than its 1-hour counterpart. The MACD is also negative, and the Stochastic Oscillator, with K=15.12 and D=16.83, is also deeply oversold, showing signs of potential upward crossover. The ADX here is 20.17, suggesting a moderate downtrend. This timeframe aligns with the daily view, where the strong ADX of 47.43 and bearish Bollinger Band placement underscore the dominant downtrend. The key takeaway from these technical readings is that while short-term oversold conditions might offer a temporary reprieve, the overarching trend remains down, and significant upside requires a clear break of established resistance levels.
Market Correlations and Forward-Looking Insights
The correlation between major equity indices like the SP500 and Nasdaq, and assets like gold and the dollar, is a critical aspect of market analysis. Currently, with the DXY strengthening and risk sentiment waning, we observe a notable divergence. The SP500 is down 0.94% today, while gold prices are surging by 3.4%, reaching $4,527.03. This highlights the flight to safety observed in the market. Similarly, silver (XAGUSD) is also showing strength, up 4.13% to $70.74. This behavior reinforces the narrative of investors seeking refuge in precious metals amidst economic uncertainty and potential Fed policy tightening.
The economic calendar provides crucial context for these market movements. Recent high-impact USD data showed figures for PMI at 52.4 (Actual) vs. 51.5 (Forecast), and another indicator at 51.1 (Actual) vs. 52 (Forecast). While not all indicators perfectly aligned with expectations, the overall trend suggests a resilient, albeit potentially inflationary, U.S. economy. Upcoming data releases, particularly those related to employment and inflation, will be pivotal. Any indication that inflation is proving more persistent than anticipated could solidify expectations of further Fed tightening, thereby strengthening the dollar and pressuring equities further. Conversely, signs of cooling inflation could provide a much-needed boost to risk assets.
The interplay between Fed policy expectations and market performance cannot be overstated. Current Fed Funds futures pricing indicates a significant probability of a rate hike by year-end, a sentiment amplified by the recent inflation data. This expectation is a primary driver behind the dollar's strength and the pressure on the SP500. If the Fed were to signal a pause or a pivot away from further tightening, it could trigger a substantial rally in equities. However, based on the current data, the Fed appears to be prioritizing inflation control, making a hawkish stance more probable in the short to medium term. This outlook suggests that the current headwinds for the SP500 may persist.
Trade Scenarios and Risk Management
Given the current technical and fundamental landscape, several scenarios are plausible for the SP500. The prevailing sentiment leans bearish, supported by strong downtrend signals on daily charts and a strengthening dollar. However, the oversold conditions on shorter timeframes suggest that a short-term bounce is not out of the question. Risk management remains paramount, and traders should be prepared for volatility.
Bearish Scenario: Continued Downtrend
65% ProbabilityNeutral Scenario: Consolidation Around Support
25% ProbabilityBullish Scenario: Short-Covering Rally
10% ProbabilityThe Road Ahead: Navigating Uncertainty
The path forward for the SP500 is fraught with uncertainty, heavily influenced by incoming economic data and the Fed's response. The current oversold conditions on shorter timeframes present a potential for a technical bounce, but the underlying bearish trend, supported by strong daily ADX and dollar strength, remains a significant headwind. Investors and traders must remain vigilant, closely monitoring key support levels around $6,411.63 and $6,397.17. A decisive break below these levels could signal further downside, while a sustained move above $6,436.13 might offer a glimmer of hope for a trend reversal.
The market's sensitivity to inflation data and Fed rhetoric is at an all-time high. Any deviation from the current hawkish expectations could trigger a sharp upward move in equities, while confirmation of persistent inflation could lead to further declines. The correlation with the DXY at 99.85 is a crucial relationship to watch; a continued rise in the dollar will likely keep pressure on the SP500. Ultimately, patience and disciplined risk management will be key in navigating this volatile environment. The market is presenting clear signals, but the interpretation and execution require a nuanced approach, acknowledging both the potential for a bounce and the overarching bearish trend.
Frequently Asked Questions: SP500 Analysis
What happens if SP500 breaks below the $6,397.17 support level?
A break below $6,397.17 (S2) on the SP500 would invalidate the current oversold bounce potential and confirm the strong daily downtrend. This would likely trigger further selling pressure, with the next significant support level to watch being $6,387.13 (S3). Such a move would be driven by increasing risk aversion and potentially renewed Fed hawkishness.
Is the RSI at 32.27 a buy signal for SP500 right now?
An RSI reading of 32.27 on the 4-hour chart indicates oversold conditions, which historically can precede a bounce. However, it is not a standalone buy signal, especially given the strong daily downtrend (ADX 47.43). Confirmation, such as a bullish MACD crossover or a sustained break above immediate resistance at $6,436.13, would be needed to consider a long position with higher probability.
How will the upcoming economic data releases affect SP500 this week?
Upcoming economic data, particularly inflation and employment figures, will be critical. If data suggests inflation is cooling, it could ease Fed tightening fears, potentially boosting the SP500. Conversely, hotter-than-expected inflation could reinforce hawkish Fed expectations, leading to further declines. The market is highly sensitive to these releases, and significant price swings are possible depending on the outcomes.
Should I buy SP500 at current levels of $6,426.45 given the oversold signals?
Buying at current levels of $6,426.45 carries significant risk due to the dominant bearish trend. While oversold signals on shorter timeframes suggest a potential for a short-term bounce, the overall trend strength is a major concern. A more prudent approach would be to wait for confirmation of a trend reversal or a bounce from a more significant support level, coupled with a de-escalation in Fed tightening fears.
Track markets in real-time
AI-powered analysis, technical indicators and real-time price data.
Join Our Telegram Channel
Breaking market news, AI analysis and trading signals instantly.
Join Channel