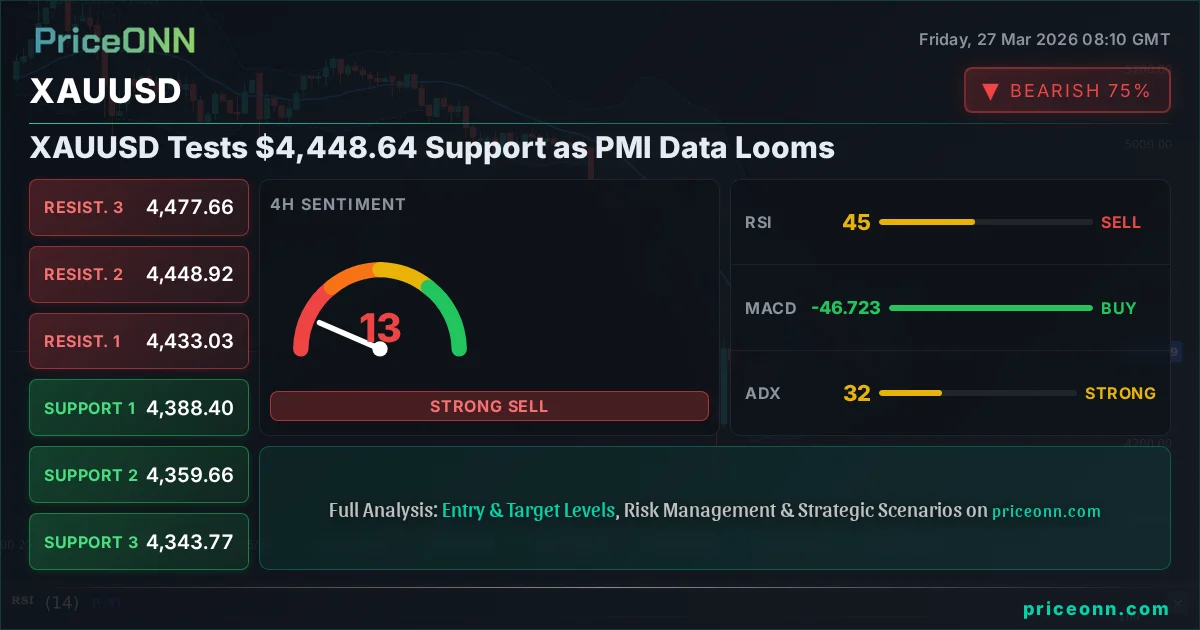
XAUUSD Tests $4,448.64 Support as PMI Data Looms
Gold holds $4,448.64 support amid rising DXY and looming PMI data. Technicals show mixed signals, demanding caution as traders await key economic releases.
The gold market is at a fascinating crossroads right now. After a period of significant upward momentum, XAUUSD has pulled back to test crucial support levels around $4,448.64. This isn't just another price fluctuation; it's a moment where the bulls and bears are locked in a fierce battle, and the outcome could set the tone for the coming weeks. We've seen gold climb impressively, but now, with key economic data on the horizon and a strengthening dollar index (DXY), the market is demanding a clearer direction. Understanding the interplay between these factors is paramount for any trader looking to navigate this volatile landscape.
- XAUUSD is currently testing critical support at $4,448.64, with the 1-hour chart showing a neutral trend and the 4-hour and daily charts indicating a stronger bearish trend.
- The Dollar Index (DXY) is showing strength, trading near 99.8, which typically exerts downward pressure on gold prices.
- Geopolitical tensions, particularly concerning oil supply stability in the Black Sea and Strait of Hormuz, are providing underlying support for gold as a safe-haven asset.
- Upcoming PMI data releases for the US and EUR will be crucial in determining the next directional move for XAUUSD, potentially influencing central bank policy expectations.
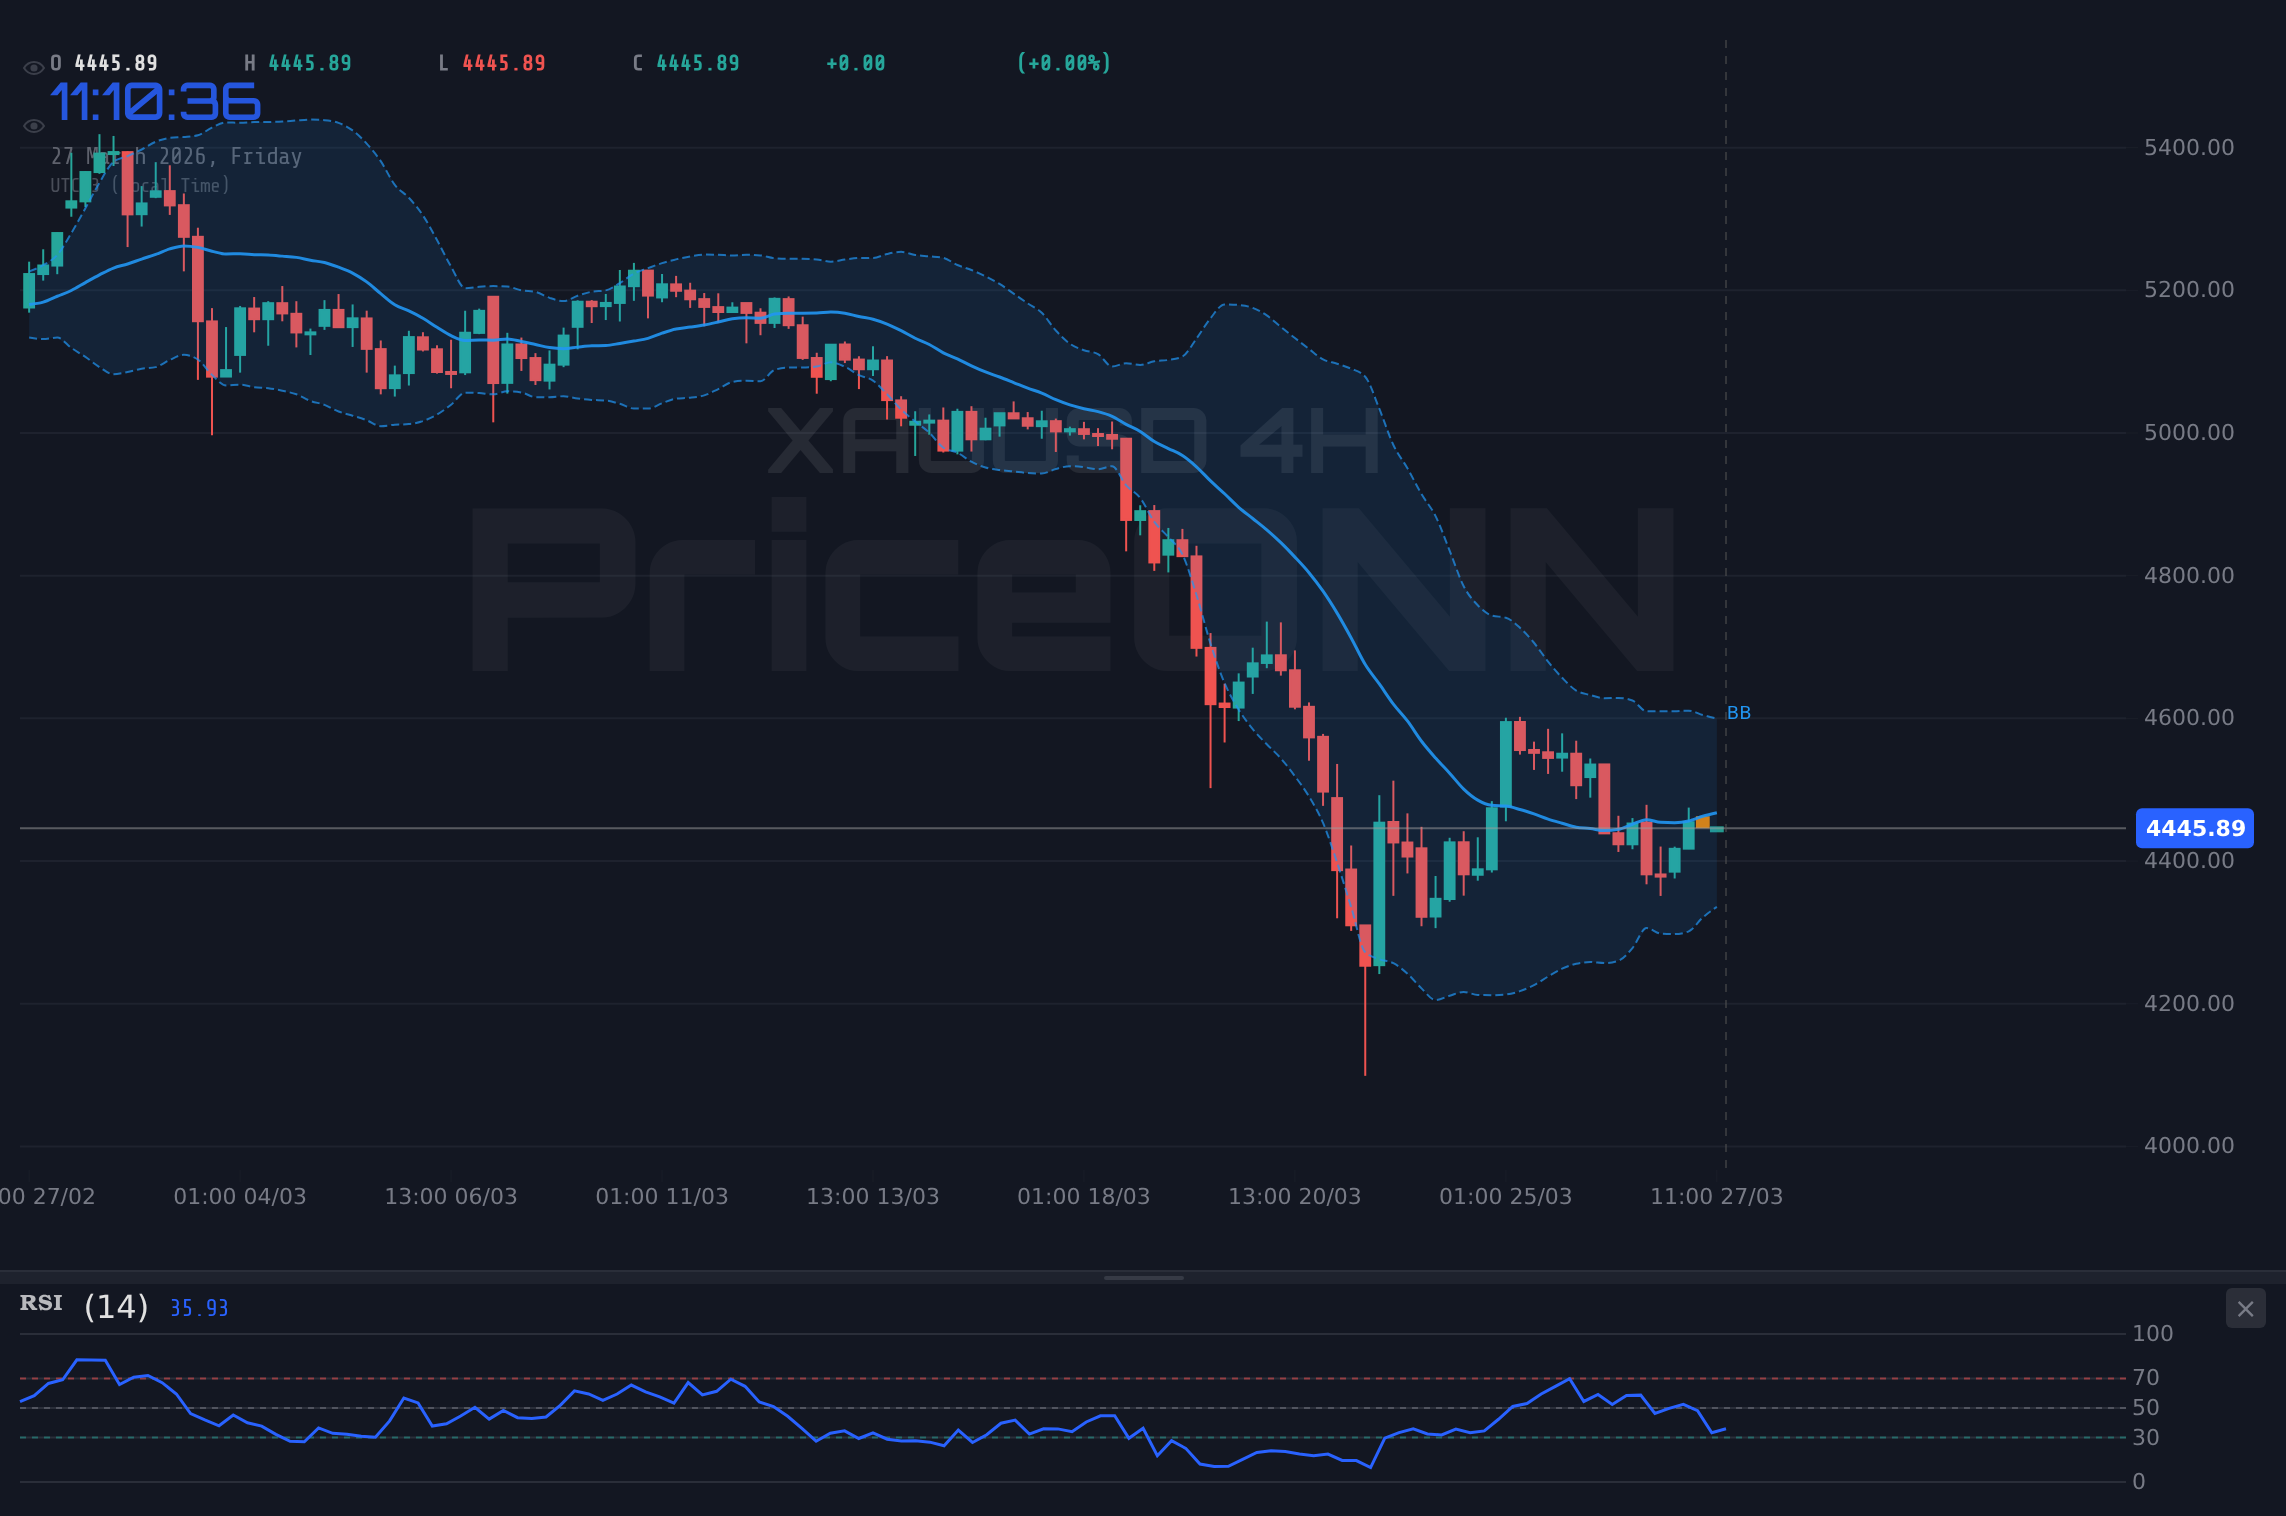
The current price action for XAUUSD presents a complex picture, heavily influenced by a confluence of technical indicators and macroeconomic forces. On the 1-hour chart, gold shows a neutral trend with RSI at 52.03, suggesting a lack of strong conviction in either direction. However, the MACD is showing positive momentum, and Stochastic is in the overbought territory (K=80.41, D=83.12), hinting at potential short-term exhaustion. This 1-hour sentiment is contradicted by the longer timeframes. The 4-hour chart reveals a strong bearish trend (91% strength) with RSI at 45.53 and ADX at 32.37, indicating a robust downtrend. Similarly, the daily chart reinforces this bearish outlook, with ADX at 31.09 and RSI at 33.88, suggesting that while the price is currently holding support, the broader sentiment leans towards further downside if key levels fail.
This divergence in signals across different timeframes is precisely why traders need to exercise caution. The immediate push higher on the 1-hour chart might be a temporary reaction, perhaps a bear-market bounce or profit-taking by short sellers. However, the persistent strength of the downtrend on the 4-hour and daily charts cannot be ignored. The ADX, measuring trend strength, is above 30 on both longer timeframes, confirming that a significant trend is in play, albeit a bearish one according to these charts. This means that any upward movement needs to be viewed with skepticism until we see sustained breaks above key resistance levels.
The Dollar's Grip and Geopolitical Undercurrents
One of the most significant external factors influencing gold is the movement of the US Dollar Index (DXY). Currently trading around 99.8 and showing a strong upward trend on the daily chart, a stronger dollar generally puts downward pressure on gold. When the dollar strengthens, it becomes more expensive for holders of other currencies to buy dollar-denominated assets like gold, potentially reducing demand. The DXY's daily trend strength of 96% and ADX at 31.82 clearly indicate that the dollar is a dominant force in the market right now, acting as a headwind for gold.
However, the relationship isn't always straightforward. Geopolitical risks can sometimes override the dollar's influence, driving demand for gold as a safe-haven asset. Recent news highlights escalating tensions, with drone strikes in the Black Sea and threats to the Strait of Hormuz potentially disrupting oil supply. This instability, coupled with broader concerns about global economic health, fuels demand for gold as a store of value. The price of Brent crude oil, currently at $106.39 and showing a very strong daily uptrend (ADX 62.39), also plays a role. Rising oil prices often correlate with inflation fears, which in turn can boost gold's appeal as an inflation hedge.
The current environment is a classic example of conflicting narratives. On one hand, a strengthening dollar and the potential for slowing economic growth could cap gold's upside. On the other hand, persistent inflation concerns, geopolitical uncertainty, and central bank actions (or inactions) can continue to support gold's safe-haven status. This push and pull creates the choppy price action we're seeing, where short-term trends can quickly reverse.
The interplay between a strong DXY and rising oil prices creates a complex risk environment. Traders must monitor both factors closely, as they can pull gold in opposite directions.
Looking at the broader market context, major indices like the SP500 and Nasdaq100 are showing significant bearish trends on their daily charts, with ADX values well above 40. This risk-off sentiment in equities typically benefits safe-haven assets like gold. However, the simultaneous strength in the DXY complicates this. If the dollar continues to rally on the back of perceived economic resilience or hawkish central bank rhetoric, it could potentially offset the safe-haven demand for gold driven by equity market weakness. This is where multi-timeframe analysis becomes critical; while equities might be falling, indicating a risk-off mood, the dollar's strength might be the more dominant factor for gold's immediate price direction.
The Looming PMI Data: A Potential Catalyst
The economic calendar is packed with high-impact events, but the upcoming Purchasing Managers' Index (PMI) data for both the US and the Eurozone will be particularly crucial for XAUUSD. These reports provide a snapshot of manufacturing and services sector activity and are closely watched by central banks and markets as indicators of economic health. The actual US PMI data released recently came in at 52.4, exceeding the forecast of 51.5, which is a positive sign for the US economy. However, another USD-related release showed a decline in its corresponding figure from 51.7 to 51.1, creating a mixed picture for the dollar's fundamental strength.
If the upcoming PMI data continues to show robust economic activity in the US, it could embolden the Federal Reserve to maintain a hawkish stance on interest rates, or at least delay any anticipated rate cuts. This would likely support the DXY further and could put additional pressure on gold. Conversely, weaker-than-expected PMI figures, especially if coupled with signs of stagflation or a significant slowdown, might lead markets to price in more aggressive rate cuts sooner, weakening the dollar and potentially providing a significant tailwind for gold.
For the Eurozone, the PMI data will be equally important. Given the current weakness in EURUSD (trading at 1.15184 with a strong daily downtrend), any positive surprise in the Eurozone's PMI could offer some relief to the single currency and, by extension, impact gold. However, the overall trend for EURUSD remains bearish, suggesting that the dollar's strength is a dominant theme. The market will be dissecting these PMI numbers not just for their headline figures but also for underlying components like employment and inflation, which can provide deeper insights into the economic trajectory.
The current stochastic readings on the 1-hour chart for XAUUSD (K=80.41, D=83.12) are in overbought territory, suggesting that the recent upward move might be due for a pause or reversal. This aligns with the idea that the market might be anticipating the PMI data, perhaps consolidating before a significant move. The 1-hour Stochastic %K is below %D, which is a bearish signal on this timeframe, even though the RSI shows a slight upward tendency. This kind of conflicting indicator setup on the shorter timeframe, when juxtaposed with the stronger bearish signals on longer timeframes, underscores the need for patience and confirmation.
Look for confirmation on the break of key levels. A close above the 1-hour resistance at $4,470.75 could signal a short-term bounce, but a sustained move below the 4-hour support at $4,388.40 would confirm the bearish trend continuation.
The Federal Reserve's policy stance remains a central theme. While recent data might show some resilience, the market is constantly trying to price in the timing and extent of potential interest rate cuts. Any hints from Fed officials or economic data that suggest a pivot towards more accommodative policy would be bullish for gold. Conversely, any indication that inflation remains stubbornly high, forcing the Fed to maintain higher rates for longer, would likely be bearish for gold and bullish for the dollar.
The ADX reading of 32.37 on the 4-hour chart and 31.09 on the daily chart for XAUUSD is particularly noteworthy. An ADX above 25 generally indicates a strong trend. Since these values are on the daily and 4-hour charts and are accompanied by bearish RSI readings, they strongly suggest that the prevailing trend is downwards. Therefore, while the price is currently hovering around $4,448.64, any bullish outlook should be tempered by the fact that the market structure on longer timeframes is decidedly bearish. This means that support levels are more likely to break than hold if the downtrend continues.
Navigating the Scenarios: What Could Happen Next?
Given the current technical and fundamental landscape, we can outline three primary scenarios for XAUUSD:
Bearish Scenario: Trend Continuation
65% ProbabilityNeutral Scenario: Consolidation Around Support
25% ProbabilityBullish Scenario: Bounce from Support
10% ProbabilityThe immediate path forward hinges on how XAUUSD reacts to the current support level at $4,448.64. The 1-hour chart's overall buy signal (5 buy, 3 sell) might suggest a temporary reprieve, but the overwhelming sell signals on the 4-hour (3 buy, 5 sell) and daily (2 buy, 6 sell) charts paint a much more bearish picture. This technical conflict implies that while a short-term bounce is possible, the larger trend remains under pressure. The ADX strength on daily and 4-hour charts further supports this, indicating that the existing bearish trend has significant momentum.
The upcoming PMI data will be the key catalyst to watch. If the US data comes in strong, reinforcing the narrative of economic resilience, it could lead to further dollar strength and a potential break of gold's support. Conversely, any signs of weakness, particularly in employment or inflation components within the PMI, could spark a reversal, weakening the dollar and bringing buyers back into gold. The market's reaction to the DXY's current strength around 99.8, and the ongoing geopolitical risks that support oil prices, will also be critical in shaping the short-to-medium term outlook for gold.
For traders, the current setup demands a high degree of patience and risk management. Chasing the immediate 1-hour bullish signals could be a trap, leading to losses if the dominant bearish trend on longer timeframes reasserts itself. Conversely, blindly shorting at current support levels might also be premature without a confirmed break. The most prudent approach would be to wait for a decisive move: either a clear break below $4,440.14, confirming the bearish trend continuation, or a strong surge above $4,470.75, signaling a potential short-term reversal. Until then, it's a market of careful observation.
Frequently Asked Questions: XAUUSD Analysis
What happens if XAUUSD breaks below the $4,440.14 support level?
If XAUUSD closes decisively below $4,440.14, it would likely confirm the bearish trend indicated by the 4-hour and daily charts. This could trigger a sell-off towards the next key support at $4,388.40, as momentum indicators suggest further downside.
Should I buy XAUUSD at current levels around $4,448.64 given the mixed signals?
Buying at current levels is risky due to conflicting signals. While the 1-hour chart shows some bullish signs, the stronger bearish trends on longer timeframes suggest caution. A confirmed break above $4,470.75 would be a more reliable buy trigger, offering a better risk-reward ratio.
Is the RSI at 52.03 on the 1-hour chart a buy signal for XAUUSD?
An RSI of 52.03 on the 1-hour chart is in the neutral zone and shows a slight upward tendency, but it is not a strong buy signal on its own. Given the bearish trend on higher timeframes and overbought Stochastic levels, this RSI reading should be interpreted with caution and requires confirmation from price action.
How will the upcoming US PMI data affect XAUUSD this week?
Stronger-than-expected US PMI data could boost the DXY and pressure XAUUSD lower, potentially breaking support at $4,440.14. Conversely, weaker data might weaken the dollar, supporting gold and possibly leading to a bounce towards $4,470.75 or higher.
| Indicator | Value | Signal | Interpretation |
|---|---|---|---|
| RSI (14) | 52.03 | Neutral | 1H: Neutral, 4H: Bearish, 1D: Bearish |
| MACD Histogram | Positive | Bullish Momentum | 1H: Positive, 4H: Positive, 1D: Negative |
| Stochastic | K=80.41, D=83.12 | Overbought | 1H: Overbought, 4H: Oversold, 1D: Bullish Signal |
| ADX | 23.41 | Strong Trend | 1H: Moderate, 4H: Strong Down, 1D: Strong Down |
| Bollinger | Mid Band | Watch | 1H: Above Mid, 4H: Below Mid, 1D: Below Mid |
Track markets in real-time
AI-powered analysis, technical indicators and real-time price data.
Join Our Telegram Channel
Breaking market news, AI analysis and trading signals instantly.
Join Channel