DowJones30 Tests $45,475.50 Support as Fed Hike Odds Surge
DowJones30 at $45,475.50 faces pressure as Fed rate hike odds climb, with key support levels eyed amid mixed technical signals.
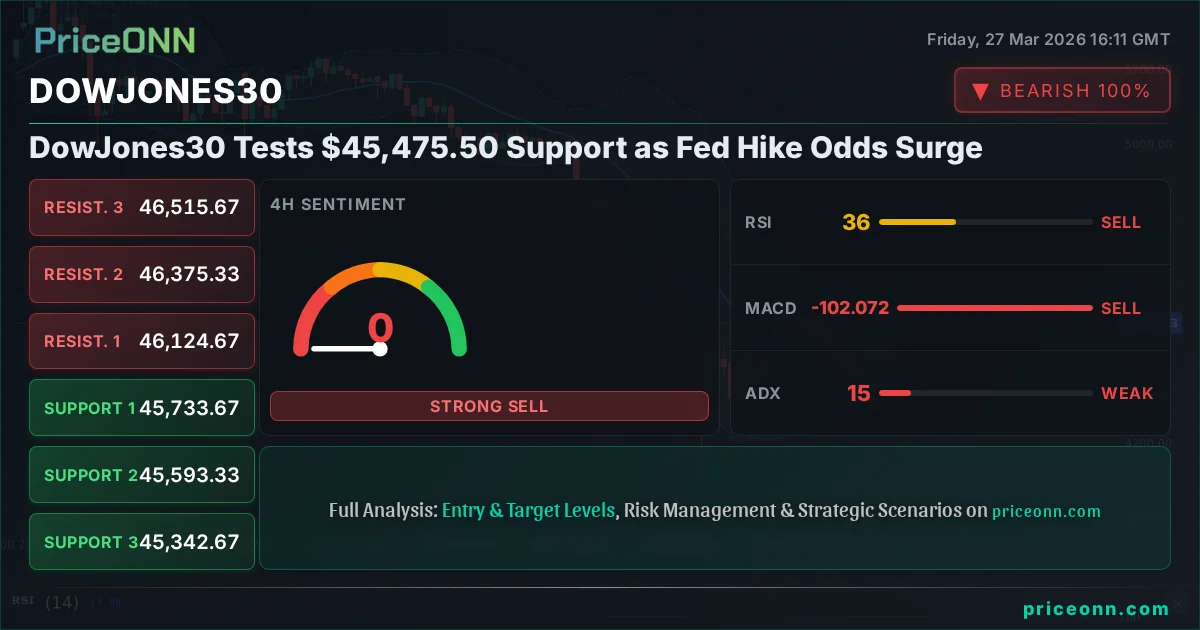
The Dow Jones Industrial Average (DJIA), currently trading at $45,475.50, is testing critical support levels as the market reassesses the Federal Reserve's monetary policy path. Traders are increasingly pricing in the possibility of a year-end rate hike, a significant shift that is casting a shadow over risk assets and demanding a closer look at the technical landscape. This pivot in market sentiment, driven by a perceived resurgence in inflation concerns, creates a complex environment for the index, where a delicate balance between technical indicators and macroeconomic drivers is being sought.
- The DowJones30 is currently trading at $45,475.50, testing key support levels.
- RSI at 30.56 on the 1H chart signals oversold conditions, while the 1D RSI at 29.15 suggests potential buying opportunities amid strong downward momentum.
- Critical support for the DowJones30 sits at $45,480.67 (1H), with further levels at $45,355.33 and $45,277.67.
- The potential for a Fed rate hike by year-end, with odds now at 52%, is a major factor influencing market sentiment and the Dow's correlation with the DXY.
The Dow Jones Industrial Average (DJIA) finds itself at a crucial juncture, with its current price of $45,475.50 hovering precariously above significant support. This level is not just a number on a chart; it represents a psychological and technical battleground where bulls and bears are locked in a fight for control. The broader market sentiment, heavily influenced by shifting expectations surrounding the Federal Reserve's next move, is playing a pivotal role. Recent economic data, particularly concerning inflation, has prompted traders to dramatically increase the probability of a rate hike by the end of the year, a stark contrast to earlier expectations of rate cuts. This recalibration is sending ripples across all asset classes, and the Dow is no exception. The interplay between these technical support levels and the overarching macroeconomic narrative is what will dictate the short-to-medium term direction of the index.
Navigating the Fed's Policy Tightrope
The Shifting Sands of Rate Expectations
The most significant driver currently impacting the DowJones30, and indeed the broader financial markets, is the evolving narrative surrounding Federal Reserve policy. Just weeks ago, the market was largely pricing in a series of rate cuts for 2026, fueled by early signs of cooling inflation and a stabilizing labor market. However, recent economic indicators have painted a different picture, suggesting that inflationary pressures may be more persistent than initially hoped. Traders are now factoring in a 52% chance of a Fed rate hike by year-end, a dramatic reversal that underscores the market's sensitivity to inflation data. This shift in expectations has tangible consequences; it strengthens the US Dollar (DXY), which is currently trading at 99.85, and typically puts pressure on riskier assets like equities, including the DowJones30. The implications of a potential rate hike are profound, signaling a renewed commitment from the Fed to combat inflation, even at the risk of slowing economic growth. This policy pivot is creating a volatile environment, forcing investors to constantly re-evaluate their positions and risk exposure.
The market's reaction to this evolving Fed stance has been swift and decisive. The DXY's rise to 99.85 is a clear indication of renewed dollar strength, a move that often correlates with increased selling pressure on global equities. When the dollar strengthens, it makes US exports more expensive and can signal tighter financial conditions globally, both of which can act as headwinds for a major US index like the DowJones30. Furthermore, the prospect of higher interest rates for longer means that the cost of capital remains elevated, potentially dampening corporate earnings expectations and reducing the attractiveness of equities relative to fixed-income investments. For companies within the Dow Jones, particularly those with significant debt burdens or those reliant on consumer spending, this policy environment presents a considerable challenge. The forward-looking nature of markets means that current price action is often a reflection of anticipated future Fed actions, making it crucial to monitor not just economic data but also the subtle shifts in Fed communication and market-based probabilities for future policy moves.
The stark shift in Fed rate hike probabilities from near zero to over 50% highlights significant policy uncertainty. This ambiguity is a primary driver of volatility across all asset classes, including the DowJones30.
The Inflationary Echo
The data fueling this policy shift is primarily centered around inflation. While some key economic releases in the past few days have shown mixed signals, the underlying trend suggests inflation may not be cooling as rapidly as desired. For instance, a recent USD release indicated an actual figure of 52.4, surpassing the forecast of 51.5 and the previous reading of 51.6. This suggests underlying strength or inflationary pressure in that sector. While another USD release showed a dip to 51.1 from a forecast of 52, the overall picture remains one of elevated price pressures. This persistence is forcing the Fed to reconsider its dovish leanings. The implications are far-reaching; if inflation remains stubbornly high, the Fed may be compelled to raise rates further or maintain them at restrictive levels for an extended period. This would undoubtedly increase borrowing costs for businesses and consumers, potentially leading to slower economic growth and impacting corporate profitability. For the Dow Jones, which comprises some of the largest and most influential companies in the US economy, such a scenario could translate into downward pressure on stock prices as earnings growth expectations are revised lower.
The correlation between inflation data and market expectations for Fed policy is undeniable. When inflation figures come in hotter than anticipated, the market immediately repricing the odds of further monetary tightening. This dynamic is clearly visible in the current market environment. The fact that the DXY is trading at 99.85 and showing upward momentum suggests that capital is flowing towards the US dollar, likely in anticipation of higher interest rates. This is a classic risk-off dynamic where the prospect of tighter monetary policy and potential economic slowdown prompts investors to seek perceived safe-haven assets. The Dow Jones30, as a barometer of the broader US stock market, is particularly sensitive to these shifts in risk appetite. The energy sector, represented by Brent crude at $108.18 and WTI at $98.48, also plays a role. Rising oil prices can contribute to inflationary pressures, creating a complex feedback loop that the Fed must navigate. Any sustained increase in energy costs could further complicate the inflation fight and reinforce the hawkish sentiment within the central bank.
Technical Landscape of the DowJones30
Hourly Chart: A Precarious Support Test
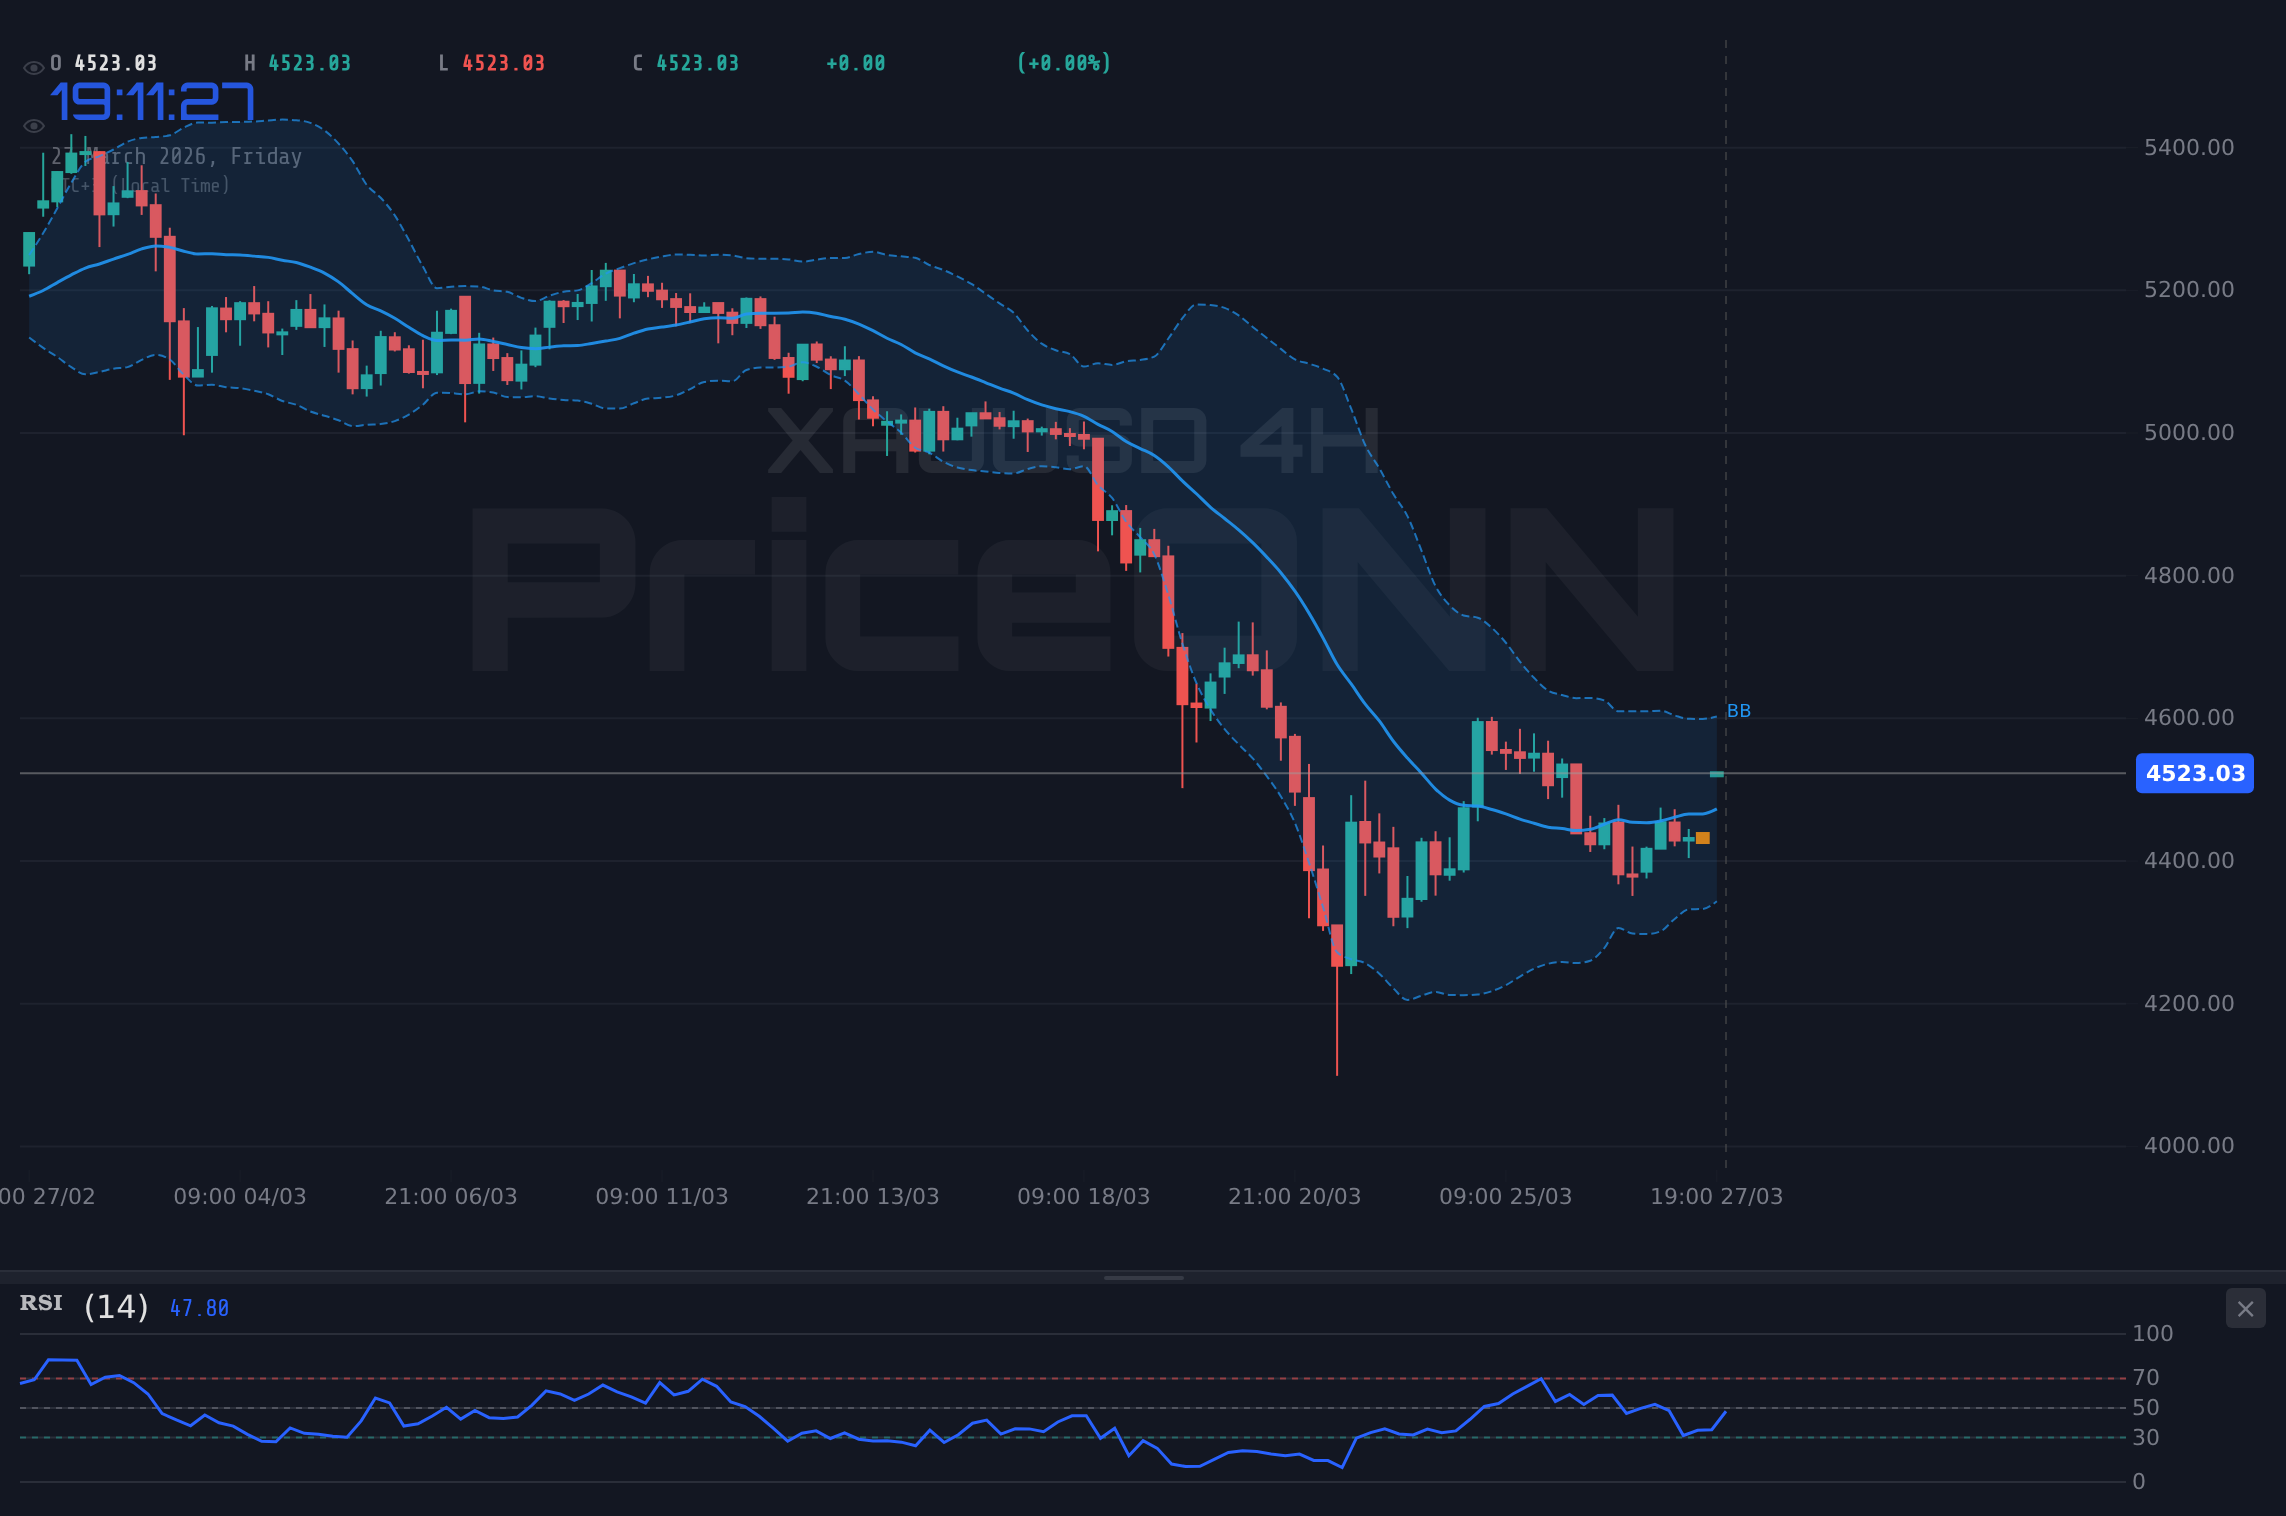
Looking at the 1-hour chart for the DowJones30, the picture is one of intense selling pressure, but also potential for a bounce from oversold conditions. The index is currently trading at $45,475.50, having experienced a significant daily drop of -1.22% (-559.5). The RSI(14) on this timeframe is sitting at 30.56, firmly in oversold territory. Typically, an RSI reading below 30 suggests that an asset has been oversold and may be due for a technical correction or bounce. However, it's crucial to remember that oversold conditions can persist in strong downtrends. The MACD histogram is negative, indicating bearish momentum, and it is below the signal line, reinforcing the downward pressure. The Stochastic oscillator shows K=11.87 and D=8.91, also deeply oversold and presenting a potential buying signal if %K crosses above %D. The ADX at 21.74 suggests a medium-strength trend is in play, but the low RSI and Stochastic readings hint at exhaustion. Key support on this timeframe is at $45,480.67, followed by $45,355.33 and $45,277.67. A break below these levels would signal further downside.
The Bollinger Bands on the 1-hour chart are showing the price trading below the lower band, indicating extreme bearishness and a potential reversal point. However, the ADX value of 21.74, while not indicating a runaway trend, does suggest some conviction behind the current move. This creates a dichotomy: oversold indicators scream 'buy the dip,' while the trend strength and negative MACD suggest caution. The general signal across the 1-hour timeframe is 'SELL' (1 Sell, 7 Buy, 0 Neutral), which is a strong indicator of the prevailing bearish sentiment despite the oversold readings. This is precisely the kind of environment where price action becomes critical. A failure to hold the $45,480.67 support could lead to a rapid cascade towards the next levels, as stops are triggered. Conversely, a sustained hold and subsequent bounce could offer a short-term trading opportunity, but confirmation would be essential.
Daily Chart: Deepening Downtrend and Divergent Signals
On the daily chart, the DowJones30's bearish trend is even more pronounced. The index has experienced a substantial daily decline, and the price action suggests a continuation of the downtrend is likely if key levels fail. The RSI(14) on the daily chart is at 29.15, also deep in oversold territory, mirroring the 1-hour chart's signal but with a stronger implication of potential mean reversion. The MACD is negative and below its signal line, confirming the bearish momentum. The Stochastic oscillator shows K=36.16 and D=33.98, indicating a potential upward cross, which, combined with the oversold RSI, suggests that while the downtrend is strong, a short-term reversal could be brewing. The ADX is at a high 41.68, indicating a very strong downtrend is in place. This is a critical conflict: strong trend strength versus oversold indicators and potential bullish divergence on Stochastic.
The Bollinger Bands on the daily chart are also showing the price trading below the lower band, a bearish signal that often precedes a period of consolidation or a bounce. However, the extremely high ADX value of 41.68 cannot be ignored. This suggests that the current downtrend has significant momentum. The general signal on the daily timeframe is 'SELL' (2 Buy, 6 Sell, 0 Neutral), reinforcing the bearish outlook. The support levels on the daily chart are considerably lower, at $45,771.33 (S1), $45,507.67 (S2), and $45,116.33 (S3). A break below the immediate hourly support could quickly bring these daily levels into play. The market is essentially at a crossroads: does the oversold condition trigger a relief rally, or does the strong daily trend overwhelm the technical signals and push prices lower?
Intermarket Analysis and Correlation
The DXY's Dominance and its Impact
The Dollar Index (DXY), currently at 99.85, is a critical barometer for the Dow Jones30. The strengthening dollar, fueled by the shifting Fed policy expectations, creates a direct headwind for US equities. As the DXY rises, it often signifies a 'risk-off' environment, where investors move capital away from riskier assets like stocks and towards perceived safe havens like the US dollar. This dynamic is particularly potent when the Fed is perceived to be tightening monetary policy. The correlation is not always perfect, but a sustained rise in the DXY typically coincides with pressure on the DowJones30. The current technicals for the DXY show a strong upward trend on the daily chart (ADX 31.89), with RSI at 61.23 and MACD positive, suggesting further dollar strength could be on the horizon. This reinforces the bearish sentiment for the DowJones30, especially if it breaches key resistance levels.
The relationship between the DXY and the Dow Jones30 is a cornerstone of intermarket analysis. When the DXY surges past key resistance, like its current position near 100, it often signals a broader deleveraging across markets. This can lead to forced selling in equities as investors liquidate positions to meet margin calls or to reallocate capital to dollar-denominated assets. The fact that the DXY is showing strong momentum on multiple timeframes suggests that this dollar strength could persist, adding further pressure to the DowJones30. Investors should be closely monitoring the DXY's ability to hold its current levels and potentially break through the 100 mark, as this would likely exacerbate the selling pressure on the index.
Equity Market Correlation: A Sea of Red
The Dow Jones30 is not an isolated entity; it moves within the broader context of the US equity market, and its movements are closely correlated with indices like the S&P 500 and the Nasdaq 100. Currently, both of these major indices are exhibiting significant weakness. The S&P 500 is down -1.06% at 6418.85, with its daily RSI at 29.08 deep in oversold territory and ADX at 47.43 indicating a strong downtrend. Similarly, the Nasdaq 100 has fallen -1.22% to 23330.65, with its daily RSI at 30.73 and ADX at 44.94, also confirming a robust downtrend. This widespread weakness across major US equity indices suggests a systemic risk-off sentiment is at play, rather than a sector-specific issue affecting only the Dow Jones components. The synchronized decline in these indices reinforces the bearish outlook for the DowJones30, as it implies that the selling pressure is broad-based and driven by macro factors rather than isolated company news.
The fact that all three major US indices are experiencing sharp declines and showing strong downtrend signals on daily charts (high ADX values) paints a clear picture of market risk aversion. The oversold readings on RSI across these indices might suggest a short-term bounce is possible, but the underlying trend strength indicated by the ADX values needs to be respected. This broad market weakness also impacts the correlation dynamics. For example, if the Nasdaq 100, which is tech-heavy, is falling sharply, it can drag down other indices due to the interconnectedness of the market. Investors are likely reallocating capital away from equities altogether, seeking safety in assets like the US dollar or potentially even bonds, depending on the specific inflation and interest rate outlook. This environment makes it challenging for the Dow Jones30 to find a footing, as it is being pulled down by the tide of broader market sentiment.
Across major US indices, a clear risk-off sentiment prevails. The Dow Jones30, S&P 500, and Nasdaq 100 are all experiencing significant pullbacks, with strong downtrend signals on daily charts and oversold conditions on shorter timeframes.
Commodities and Inflationary Concerns
The commodity markets, particularly oil, are also providing crucial context. Brent crude is trading at $108.18, up 4.4%, and WTI at $98.48, up 4.81%. These sharp increases in oil prices are significant because they directly contribute to inflationary pressures. Higher energy costs filter through the economy, increasing transportation costs, manufacturing expenses, and ultimately consumer prices. This inflationary impulse is a key reason why the Fed is reconsidering its dovish stance and why traders are pricing in a higher probability of rate hikes. The fact that oil prices are surging suggests that the inflationary pressures may not be transitory, creating a challenging environment for central banks trying to engineer a soft landing. For the Dow Jones30, which includes companies sensitive to energy costs and consumer spending, this inflationary backdrop is a double-edged sword: some energy companies may benefit from higher prices, but the overall impact on consumer demand and corporate costs could be negative.
The upward momentum in oil prices, coupled with the strong DXY, creates a somewhat conflicting macroeconomic picture. Typically, a strong dollar can put downward pressure on commodity prices, as many commodities are priced in dollars. However, the current surge in oil prices seems driven more by supply-side concerns and geopolitical risks, overriding the typical dollar-appreciation effect. This situation highlights the complexity of the market and the interplay of various factors. For the Dow Jones30, the persistent inflationary pressure from commodities adds another layer of uncertainty, reinforcing the likelihood that the Fed will maintain a hawkish stance. This means that the path of least resistance for equities may remain downwards until inflation shows clearer signs of abating or the Fed pivots back towards easing.
Forward-Looking Perspective and Strategy
The $45,480.67 Line in the Sand
As the DowJones30 hovers around $45,475.50, the immediate focus must be on the 1-hour support level at $45,480.67. A decisive close below this level on the 1-hour chart would likely trigger further selling, activating the subsequent support levels at $45,355.33 and $45,277.67. This could lead to a more significant decline, especially if the broader market sentiment remains risk-averse. The high ADX value of 41.68 on the daily chart suggests that once a breakdown occurs, it could be swift and substantial. Traders will be watching for confirmation of a breakdown, such as increasing volume on the move lower and a failure of any attempted bounces to gain traction.
Conversely, if the DowJones30 manages to hold above $45,480.67 and initiates a bounce, the first resistance level to watch on the 1-hour chart is $45,683.67, followed by $45,761.33. A successful rally would likely require a shift in market sentiment, perhaps driven by more dovish commentary from the Fed or a significant improvement in risk appetite globally. However, given the current macroeconomic backdrop and the strong bearish signals across multiple timeframes, any bounce is likely to be met with selling pressure as traders look to reduce exposure or enter short positions at better levels. The oversold RSI and Stochastic readings do offer some hope for a short-term technical rebound, but the overwhelming trend strength and negative MACD on the daily chart suggest that any such rebound may be limited in scope and duration unless followed by significant fundamental catalysts.
The Fed's Shadow and Potential Catalysts
The path forward for the DowJones30 remains heavily dictated by the Federal Reserve's actions and communication. Any further data suggesting persistent inflation could solidify the market's expectation of a rate hike, keeping pressure on the index. Conversely, any signs of economic weakening or cooling inflation could prompt a shift back towards rate cut expectations, potentially offering relief to equities. Upcoming economic calendar events, such as any further USD data releases or statements from Fed officials, will be crucial in shaping this narrative. The market is currently pricing in a 52% chance of a hike, meaning it is still somewhat balanced, but any data that pushes this probability higher could trigger a significant move.
Beyond Fed policy, geopolitical developments also remain a wildcard. While the provided data doesn't offer specific geopolitical news impacting the Dow Jones directly, general risk aversion, as seen in the broad equity market selloff and the rise of the DXY, suggests that any escalation of global tensions could further pressure the index. The strong performance of oil prices, though potentially inflationary, also points to underlying supply concerns that could be exacerbated by geopolitical events. Therefore, investors should maintain a vigilant watch on both domestic economic data and global geopolitical headlines, as either could serve as a catalyst for a significant move in the Dow Jones30. The current technical setup, with oversold conditions on shorter timeframes clashing with strong downtrend signals on longer timeframes, suggests a period of high volatility is likely, and patience will be key for traders looking to navigate this environment.
Frequently Asked Questions: DowJones30 Analysis
What happens if DowJones30 breaks below the $45,480.67 support level?
If the DowJones30 closes decisively below $45,480.67 on the 1-hour chart, it would likely trigger further selling pressure, targeting subsequent support levels at $45,355.33 and $45,277.67. This scenario is amplified by the strong downtrend signals observed on the daily chart, with an ADX of 41.68.
Should I consider buying the DowJones30 at current levels of $45,475.50 given the oversold RSI of 30.56?
While the RSI at 30.56 suggests oversold conditions on the 1-hour chart, caution is advised due to the strong bearish trend indicated by the daily ADX of 41.68. A buy-the-dip strategy would require confirmation, such as holding the $45,480.67 support and seeing a bullish MACD cross or sustained price action above resistance.
Is the RSI at 29.15 on the daily chart a strong buy signal for the DowJones30 right now?
An RSI of 29.15 on the daily chart indicates oversold territory, historically a potential precursor to a bounce. However, this signal must be weighed against the strong downtrend (ADX 41.68) and negative MACD, suggesting that while a bounce is possible, it may face significant resistance and could be short-lived without a fundamental shift.
How will the increasing probability of a Fed rate hike affect the DowJones30 this week?
The rising odds of a Fed rate hike (currently 52%) increase the probability of further downward pressure on the DowJones30, as it strengthens the DXY (at 99.85) and signals tighter financial conditions. This macro backdrop makes it difficult for the index to sustain any rallies, especially as it tests key support levels around $45,475.50.
Track markets in real-time
AI-powered analysis, technical indicators and real-time price data.
Join Our Telegram Channel
Breaking market news, AI analysis and trading signals instantly.
Join Channel