NZDUSD Tests $0.57440 Support: Bearish RSI Signals Caution
NZDUSD hovers near $0.57440 support. With bearish RSI signals and strong DXY, a deeper correction looms. Key levels to watch: $0.5737 support, $0.5765 resistance.
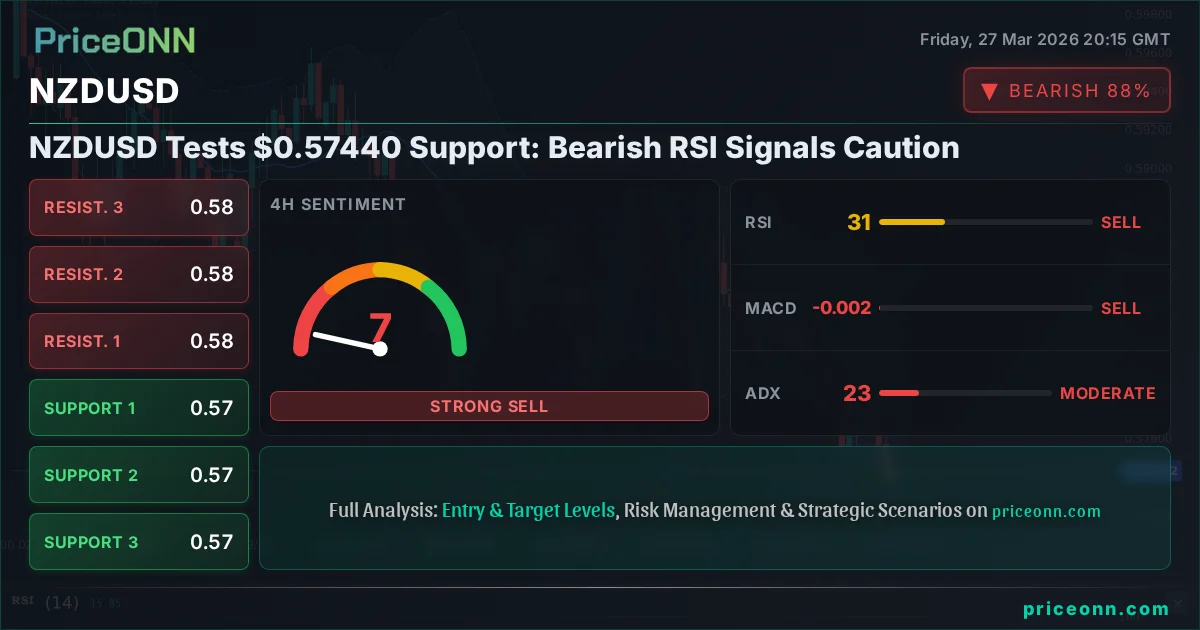
The New Zealand Dollar is facing significant headwinds against the US Dollar, with NZDUSD currently trading at $0.57440. This level represents a critical support zone, but the technical indicators are flashing cautionary signals, suggesting that a breakdown could be imminent. As traders assess the current market sentiment and look for clues, the interplay between the Dollar Index (DXY), risk appetite in global markets, and central bank rhetoric becomes paramount. In this analysis, we delve into the multi-timeframe picture for NZDUSD, exploring the most probable scenarios and the key triggers that traders should be watching closely.
- RSI at 34.79 on the 1H chart signals bearish momentum, indicating potential further downside for NZDUSD.
- The critical support level for NZDUSD is holding precariously at $0.57370, with the next significant floor at $0.57327.
- A sustained move above the $0.57650 resistance is needed to invalidate the bearish outlook.
- The strength of the US Dollar Index (DXY), currently at 99.91, is exerting downward pressure on NZDUSD, reflecting a risk-off sentiment.
The current price action around $0.57440 for NZDUSD paints a picture of a currency pair under pressure. The 1-hour chart shows the RSI at 34.79, firmly in bearish territory, suggesting that sellers are in control. While this might appear to be an oversold condition, the momentum on higher timeframes, particularly the daily chart where the trend strength (ADX) is a robust 35.24, indicates a strong bearish trend is in play. This divergence between short-term oversold readings and the longer-term bearish trend is a common, yet often tricky, scenario for traders to navigate. It highlights the importance of not just looking at one indicator, but understanding the broader context and the confluence of signals across different timeframes.
The overarching market theme is one of risk aversion, largely driven by a strengthening US Dollar. The DXY is currently trading at 99.91, exhibiting a strong upward trend across all observed timeframes. This strength in the dollar typically puts pressure on riskier assets and currencies like the New Zealand Dollar, which is often sensitive to global growth prospects and commodity prices. The current ADX for DXY on the daily chart is 31.98, confirming a solid uptrend. This correlation is not merely coincidental; a stronger dollar makes it more expensive for holders of other currencies to buy US assets, and conversely, it means that foreign assets become relatively cheaper for dollar holders. For NZDUSD, this dynamic usually translates into downward pressure as the greenback gains value.
Looking at the broader economic landscape, recent news suggests a global tightening of monetary policy or at least a hawkish stance from major central banks. While specific economic calendar events for the last 3 days and the upcoming week are not detailed here, the general sentiment points towards inflation concerns. For instance, if we had seen recent US inflation data coming in hotter than expected, it would reinforce the Federal Reserve's hawkish stance, further bolstering the dollar and weighing on pairs like NZDUSD. Conversely, any signs of cooling inflation or a dovish pivot from the Fed would typically weaken the dollar and offer respite to the Kiwi. The absence of explicit recent economic data releases in the provided context means we must rely more heavily on technicals and broader market sentiment, but it's crucial to remember that upcoming data releases could dramatically shift this narrative.
The Bear's Roadmap: Navigating Downside Risks
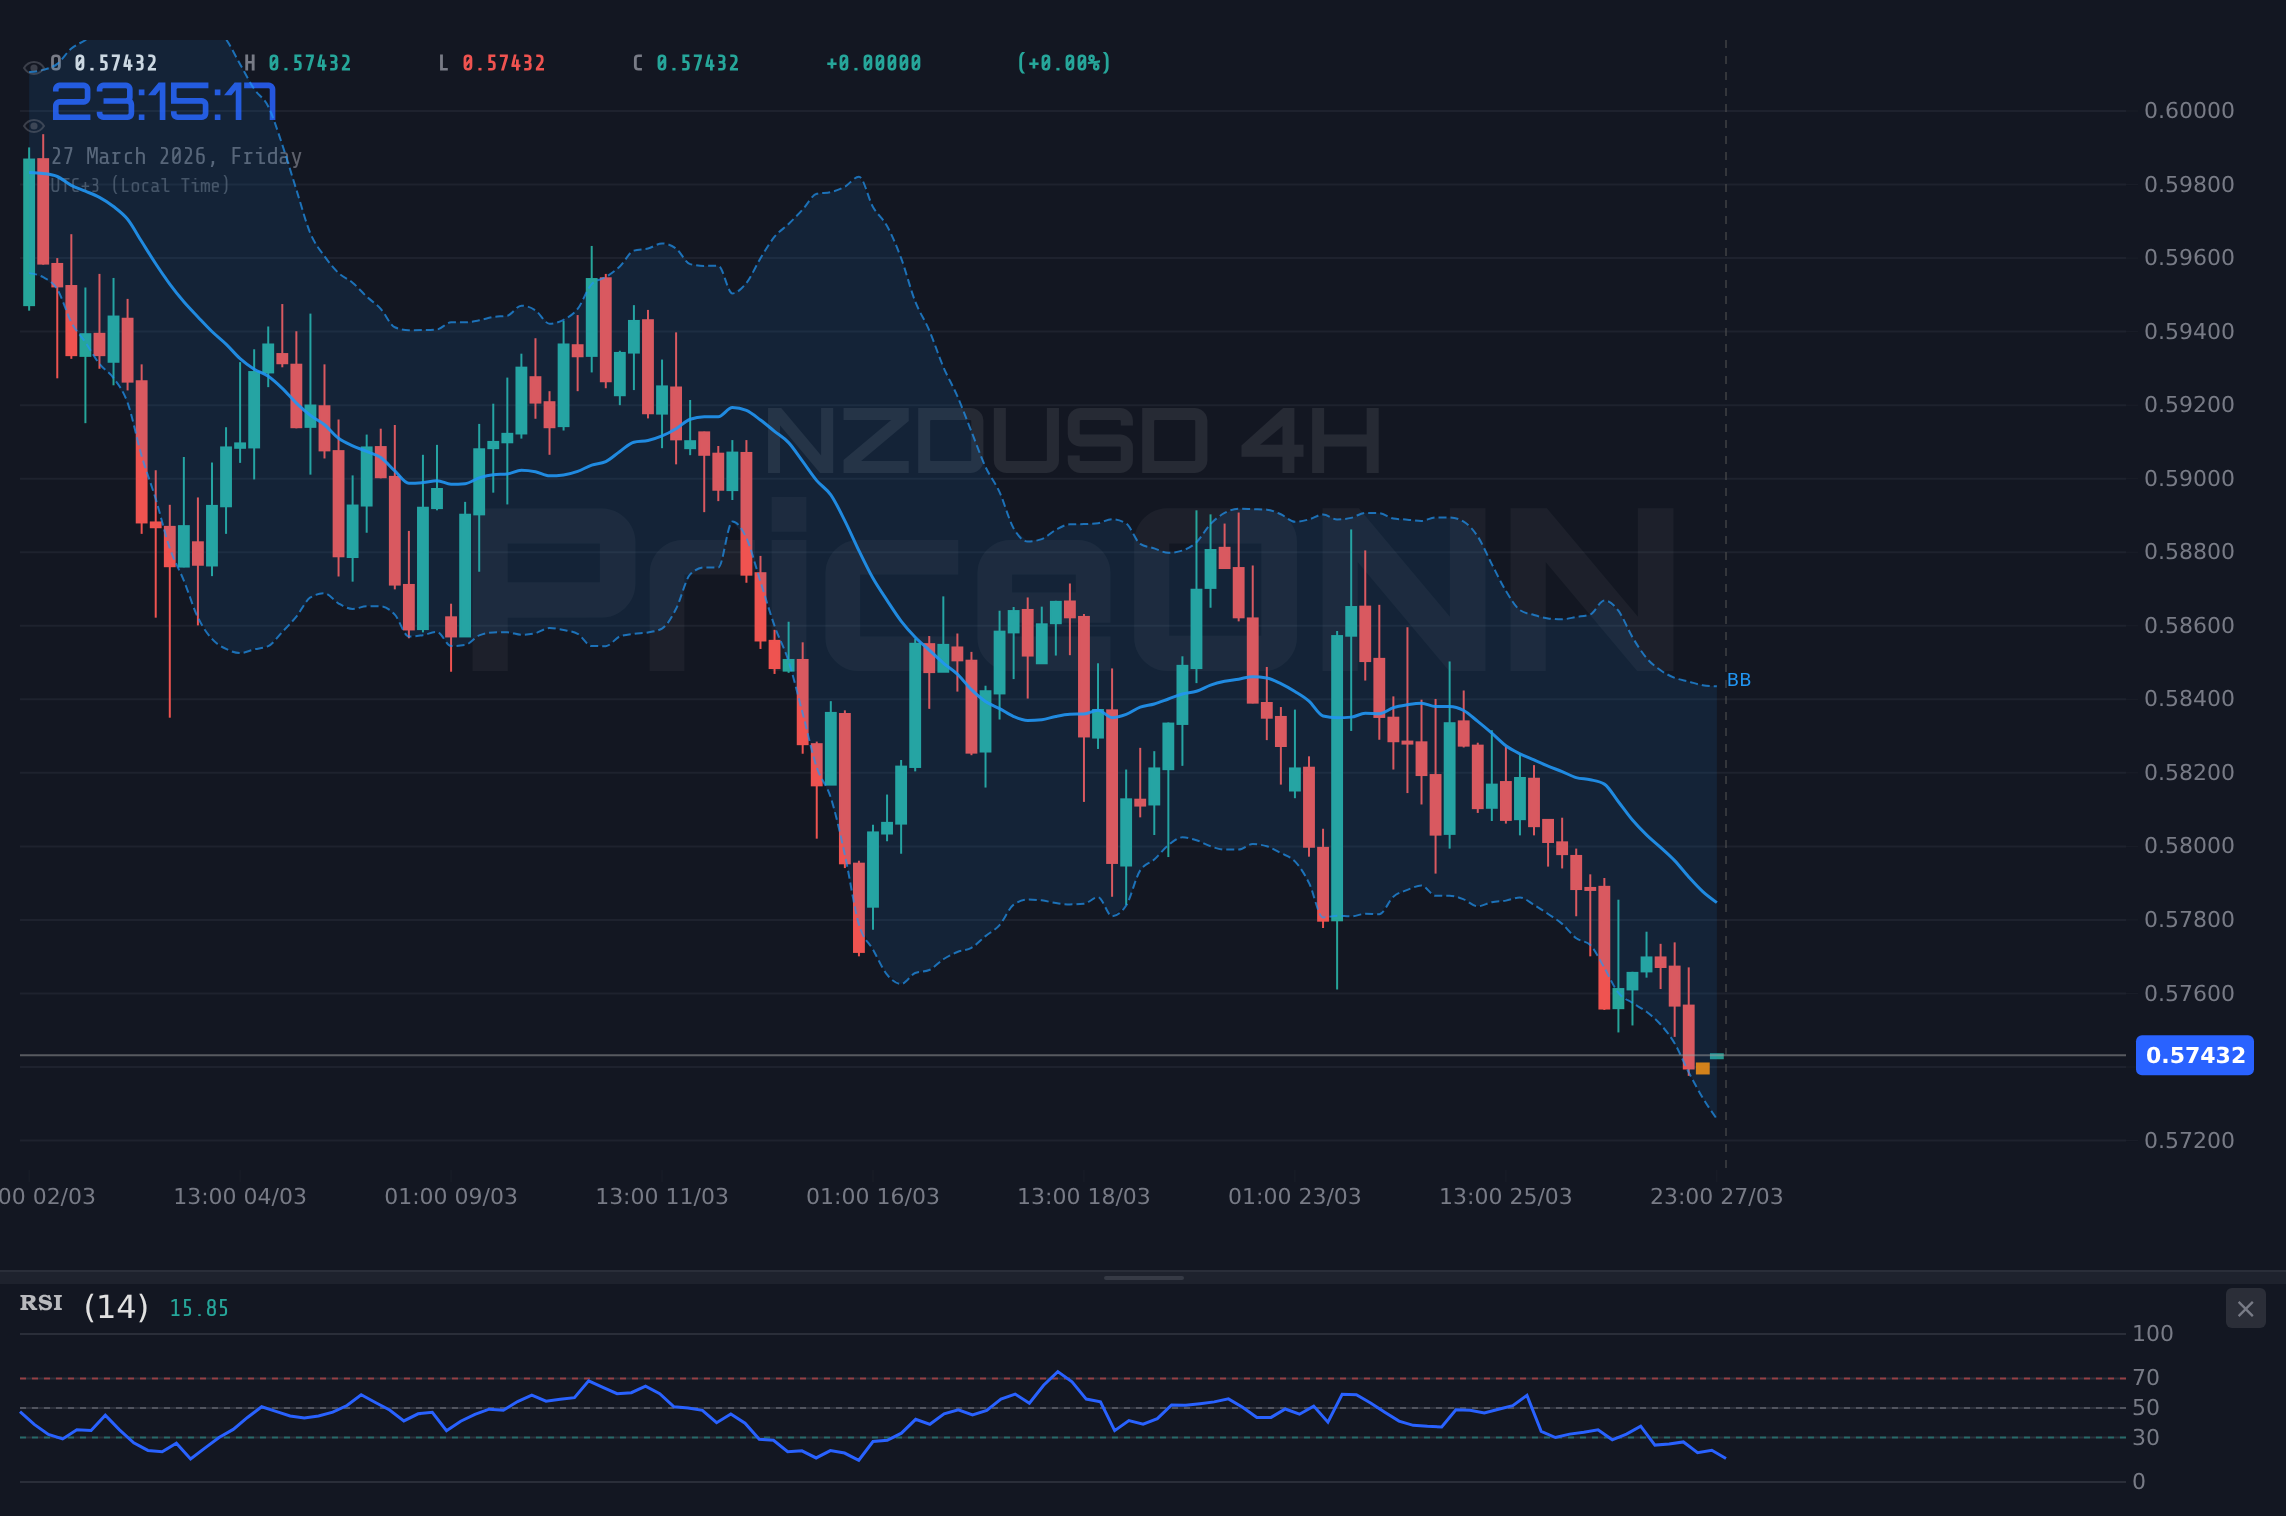
The bearish scenario for NZDUSD appears to be the most probable given the current technical and fundamental backdrop. The 1-hour chart shows a clear bearish momentum with RSI at 34.79 and the MACD histogram in negative territory. The Stochastic oscillator (%K=14.04, %D=20.43) is also deeply in oversold territory, but this does not necessarily signal an immediate buy opportunity; in a strong downtrend, oscillators can remain oversold for extended periods. The ADX on the 1-hour chart is 18.67, indicating a weak trend, but on the 4-hour (ADX 23.09) and daily (ADX 35.24) charts, the trend strength becomes more pronounced, confirming a significant downtrend is in motion. This suggests that any short-term bounces are likely to be met with selling pressure.
The immediate trigger for a continuation of the bearish trend would be a failure to hold the key support level at $0.57370. If this level breaks, the next target would be the support at $0.57327. A decisive close below this level on the 4-hour chart could open the door for a further decline towards $0.57196, a significant support level identified on the 4-hour timeframe. The daily chart shows further support at $0.57378, $0.57144, and $0.56794, indicating that there is substantial room for price to fall if the bearish momentum continues unabated. The strength of the DXY at 99.91 reinforces this view; as long as the dollar remains strong, the path of least resistance for NZDUSD is likely downwards. The recent news regarding potential Fed rate hikes, even amidst energy shocks, further supports a stronger dollar narrative.
The invalidation of this bearish scenario would require a significant shift in market dynamics. Specifically, a strong close above the 1-hour resistance at $0.57650 would be the first sign of a potential reversal. However, for the bearish thesis to be truly invalidated, price would need to break through the daily resistance level at $0.57962. This would suggest that the prevailing downtrend has exhausted itself and a new bullish phase is beginning. Until then, traders should remain cautious and be prepared for potential downside continuation. The current overall signal for NZDUSD on the 1-hour and 4-hour charts is overwhelmingly 'SELL', reinforcing the bearish outlook.
The Waiting Game: Consolidation and Uncertainty
While the dominant trend appears bearish, the possibility of a period of consolidation or a neutral range cannot be entirely dismissed. This scenario typically emerges when conflicting signals appear across different timeframes or when market participants await significant economic catalysts. In the case of NZDUSD, the RSI on the 1-hour chart is nearing oversold territory (34.79), while on the daily chart, it is at 36.36 – both indicating bearish pressure but not extreme oversold conditions that might suggest an immediate reversal. The ADX values also present a mixed picture: strong on the daily (35.24), moderate on the 4-hour (23.09), and weak on the 1-hour (18.67).
This variability in trend strength across timeframes can sometimes lead to choppy price action, where NZDUSD might oscillate between its immediate support and resistance levels without a clear directional bias. The immediate support is at $0.57370 and resistance at $0.57650 on the 1-hour chart. If price action remains confined within these bounds, it would indicate a lack of conviction from either the bulls or the bears. Such consolidation phases can be frustrating for traders seeking clear directional trades, but they often precede significant moves. The trigger for this neutral scenario would be the inability of price to decisively break either the immediate support or resistance levels for an extended period, perhaps 24-48 hours, on the 1-hour or 4-hour charts.
The invalidation of the neutral scenario would simply be a decisive break of either the support or resistance levels mentioned above, leading back into the bullish or bearish scenarios. However, the key takeaway from a potential consolidation is that market participants are likely in a holding pattern, perhaps waiting for crucial economic data releases or geopolitical developments to provide a clearer direction. The lack of strong momentum on the 1-hour ADX (18.67) supports this possibility. For traders, this phase might present opportunities for range-bound strategies, but the overall risk remains to the downside given the stronger trend signals on higher timeframes. The current 'NEUTRAL' signal on the 4H chart, despite the overall bearish trend, hints at this potential for indecision.
The Bull's Gambit: A Potential Reversal Scenario
While the current technical setup leans heavily bearish, no analysis is complete without considering the bullish counter-argument. For NZDUSD to reverse its downtrend, several conditions would need to be met, and these are currently not strongly supported by the data. The primary trigger for a bullish scenario would be a decisive break and hold above the immediate 1-hour resistance at $0.57650. This would be followed by a push through the subsequent resistance at $0.57820. A more significant confirmation would be a close above the daily resistance level of $0.57962, which would signal a potential end to the prevailing downtrend.
The invalidation of the bearish outlook and the confirmation of a bullish reversal would require momentum indicators to align positively. For instance, the RSI would need to move decisively above 50, ideally breaking through the 60 level, and the MACD would need to generate a bullish crossover. Furthermore, the Stochastic oscillator, currently showing weakness, would need to turn upwards from oversold territory and cross bullishly. The ADX also needs to show a weakening downtrend (falling below 20) and then a subsequent rise in a new bullish direction. The current daily ADX of 35.24 indicates a strong trend, making a reversal scenario less likely without a significant catalyst.
In this bullish scenario, the first significant target would be the daily resistance level at $0.57962. If this level is breached with conviction, the pair could then target the next resistance at $0.58312, and potentially extend towards $0.58546. Such a move would likely be accompanied by a weakening of the US Dollar Index (DXY), perhaps a fall below its current 99.91 level and a break of its own support. This would imply a shift in global risk sentiment from 'risk-off' to 'risk-on'. However, given the strength of the current downtrend and the prevailing DXY strength, this bullish scenario currently carries a lower probability. The overall signal for NZDUSD on the daily chart is strongly 'SELL', making the bullish case a contrarian play that requires strong confirmation.
What's Most Likely? A Probabilistic Outlook
Weighing the evidence from multiple timeframes and indicators, the bearish scenario for NZDUSD presents the highest probability of unfolding in the short to medium term. The confluence of a strong daily downtrend (ADX 35.24), bearish RSI readings on the 1-hour and daily charts (34.79 and 36.36 respectively), and the persistent strength of the US Dollar Index (DXY at 99.91) creates a formidable headwind for the Kiwi dollar. The 'SELL' signals dominating the 1-hour and 4-hour timeframes further solidify this outlook. While the 4-hour chart shows a neutral trend strength (ADX 23.09), this can be interpreted as a pause within a larger downtrend rather than a sign of reversal.
Therefore, the most likely scenario is a continued grind lower, with potential for consolidation periods within the overall downtrend. The key support at $0.57370 is the immediate level to watch. A break below this could accelerate the move towards $0.57196 and potentially lower. The bullish scenario, while possible, requires a significant shift in market sentiment and technical alignment that is not currently evident. It remains a lower probability outcome, perhaps carrying a 10-15% chance in the near term unless major economic news or geopolitical events drastically alter the landscape. The neutral scenario, characterized by range-bound trading, is more plausible as an intermediate step, but the underlying bearish pressure suggests it would likely be a prelude to further downside.
The probabilities assigned reflect the current technical picture. We assign a 65% probability to the bearish scenario, a 25% probability to a consolidation or neutral range, and a 10% probability to a sustained bullish reversal. These probabilities are dynamic and can change rapidly based on new data, economic releases, or geopolitical events. It is crucial for traders to remain agile and adjust their strategies accordingly. The current market environment demands a disciplined approach, focusing on risk management and waiting for clear setups that align with the dominant trend, or carefully assessing the conditions for a contrarian trade.
What I'm Watching This Week
The coming week will be critical for NZDUSD, with several potential catalysts that could either reinforce the bearish trend or signal a shift in momentum. Firstly, I'll be closely monitoring the $0.57370 support level. A decisive break below this point, especially on increased volume, would be a strong signal for further downside. Secondly, the movement of the US Dollar Index (DXY) remains a key barometer. Any signs of weakness in the DXY, particularly a move below 99.73 on the 1-hour chart, could provide a temporary reprieve for NZDUSD, though a sustained rally would require more than just dollar weakness.
Thirdly, I am watching for any significant economic data releases related to the US or New Zealand economies. While specific high-impact events are not detailed in the provided calendar, any unexpected inflation or employment figures could trigger volatility. For instance, a surprisingly weak US inflation report could lead to a reassessment of Fed rate hike expectations, potentially weakening the dollar. Conversely, strong NZ employment data could offer some support to the Kiwi, but it would need to be exceptionally positive to overcome the broader bearish trend and dollar strength. Finally, I'll be keeping an eye on the 4-hour chart's technicals; a sustained move above the 4-hour resistance at $0.57871 would begin to question the bearish thesis, although a daily close above $0.57962 would be the true signal of a potential trend change. The current risk-off sentiment globally also favors the bearish narrative for NZDUSD.
The Bear's Grip: Downside Pressure Continues
65% ProbabilityThe Waiting Game: Consolidation at Key Levels
25% ProbabilityThe Bull's Gambit: A Contrarian Reversal
10% Probability| Indicator | Value | Signal | Interpretation |
|---|---|---|---|
| RSI (14) | 34.79 | Bearish | Approaching oversold, but trend remains down. |
| MACD Histogram | -0.00172 | Bearish | Negative momentum persists. |
| Stochastic | K:14.04, D:20.43 | Bearish | Deeply oversold, but trend is down. |
| ADX | 18.67 (1H) / 23.09 (4H) / 35.24 (1D) | Bullish Trend Strength | Weak on 1H, Moderate on 4H, Strong on 1D. Confirms downtrend. |
| Bollinger Bands | Middle Band | Watching | Price below middle band on 1D/4H, indicating bearish bias. |
Frequently Asked Questions: NZDUSD Analysis
What happens if NZDUSD breaks below the $0.57370 support level?
A break below $0.57370 on the 1-hour chart would likely accelerate the downtrend, targeting the next support at $0.57327. The strong daily ADX of 35.24 suggests this move would be part of a larger bearish trend.
Should I consider buying NZDUSD at current levels of $0.57440 given the oversold RSI?
Buying at current levels is a contrarian play with high risk. While the 1-hour RSI is low, the overall trend remains strongly bearish on higher timeframes. A more prudent approach would be to wait for a confirmed bullish reversal signal, such as a close above $0.57962, or a clear break of support followed by a failed retest.
Is the RSI at 34.79 a definitive sell signal for NZDUSD?
An RSI of 34.79 on the 1-hour chart indicates bearish momentum but is not a standalone sell signal. In a strong downtrend, RSI can remain in oversold territory for extended periods. Confirmation from price action and other indicators, like MACD histogram and ADX trend strength, is essential.
How will the current DXY strength at 99.91 affect NZDUSD this week?
The strong DXY at 99.91 exerts significant downward pressure on NZDUSD, reflecting a risk-off environment. If the DXY continues to rally towards 100.00 and beyond, NZDUSD is likely to remain suppressed, potentially breaking lower support levels.
Track markets in real-time
AI-powered analysis, technical indicators and real-time price data.
Join Our Telegram Channel
Breaking market news, AI analysis and trading signals instantly.
Join Channel