DowJones30 Weekly: Bears Grip $45,077.50 as Geopolitics Grip Markets
DowJones30 struggles at $45,077.50 amid escalating geopolitical tensions and a flight to safety, with mixed signals suggesting a volatile outlook.
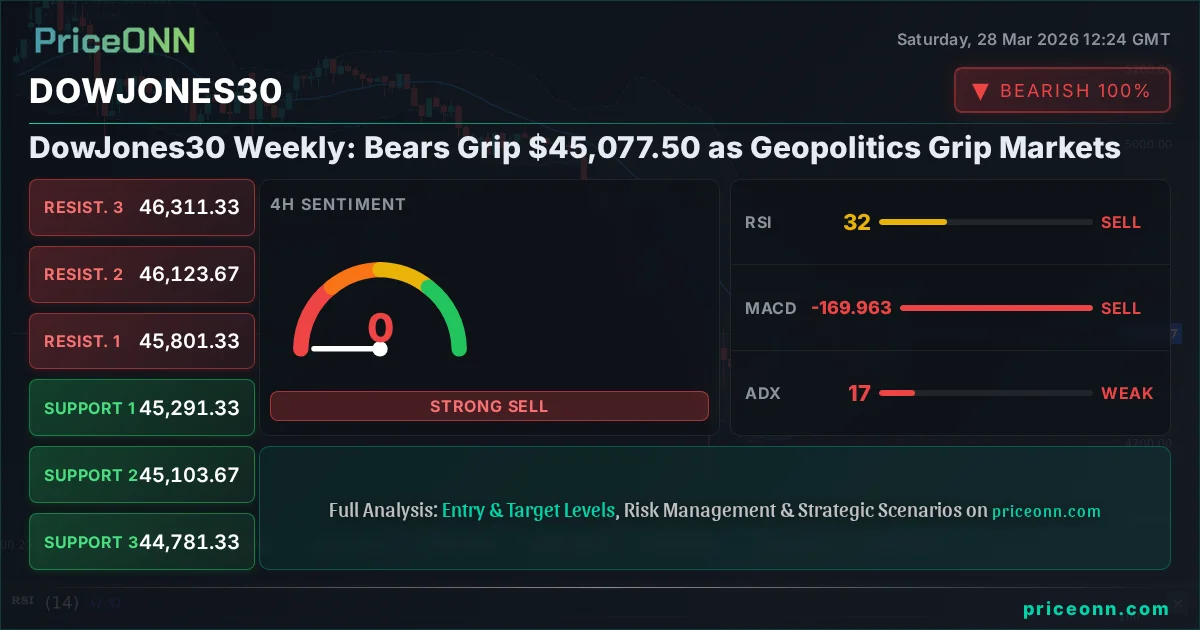
The DowJones30 index finds itself at a critical juncture, trading around $45,077.50 as the past week drew to a close. This pivotal moment isn't just about chart patterns or technical indicators; it's deeply intertwined with a global landscape increasingly defined by geopolitical friction and shifting risk appetites. As tensions in the Middle East escalate, particularly with Iran's actions concerning the Strait of Hormuz, and concerns mount over Russian oil exports threatened by Ukrainian drone strikes, the traditional safe-haven assets are seeing renewed interest. This complex interplay of global events is directly influencing market sentiment, creating a challenging environment for major indices like the DowJones30. The question on every trader's mind is whether the current downdraft is a temporary correction or the precursor to a more significant downturn. Understanding the macro drivers is paramount to navigating these choppy waters, and the signals are currently mixed, demanding a cautious and data-driven approach.
- The DowJones30 is trading around $45,077.50, showing significant downward pressure with a 1H RSI at 22.17, signaling oversold conditions.
- Key support for the DowJones30 is identified at $45,189.67, with a break below potentially targeting $45,142.33.
- The strong ADX reading of 28.4 on the 1H chart indicates a robust downtrend, despite oversold RSI and Stochastic indicators.
- Geopolitical risks, including Middle East tensions and threats to Russian oil, are boosting the US Dollar (DXY at 99.91) and pressuring global equities like the DowJones30.
Navigating the Storm: Geopolitical Currents and Their Impact on the Dow
The Shifting Sands of Global Risk
The past week has been a stark reminder of how interconnected global markets are, especially when geopolitical fault lines begin to crack. The dramatic surge in Brent crude oil prices, soaring past $110 per barrel, and WTI crude oil climbing above $101, directly reflects the escalating tensions in the Middle East following Iran's actions. This spike in energy prices, a key inflation driver, immediately casts a shadow over economic outlooks worldwide. Central banks, already grappling with persistent inflation, now face a renewed inflationary threat that could complicate their monetary policy decisions. For the DowJones30, this means increased uncertainty. Higher energy costs can squeeze corporate profit margins for many companies within the index, while simultaneously fueling broader inflation concerns that might prompt tighter monetary policy. The market's reaction, seen in the significant daily drops across major US indices like the S&P 500 (down 2% to 6357.55) and the Nasdaq 100 (down 2.23% to 23092.5), underscores this sensitivity. Investors are clearly re-evaluating risk, favoring perceived safe havens over riskier assets.
The US Dollar Index (DXY) has also shown strength, climbing to 99.91. This is a classic flight-to-safety move. As global instability rises, capital often flows into the dollar, perceived as a more stable store of value. This strengthening dollar, in turn, tends to put pressure on commodities priced in dollars, like gold and silver, and can also impact the earnings of multinational corporations by making their exports more expensive. For the DowJones30, the dollar's strength can be a double-edged sword; while it might indicate underlying economic resilience in the US, it also signals global risk aversion that typically weighs on equity markets. The correlation between a rising DXY and a falling DowJones30 is a well-established pattern, and current market dynamics are reinforcing this relationship.
The Oil Shockwave: Inflationary Fears Reignited
The surge in oil prices is arguably the most significant macro development impacting markets this week. Brent crude's jump by 6.77% to $110.64 and WTI's 7.69% surge to $101.19 are not mere price fluctuations; they represent a tangible threat to global economic stability. For months, central banks have been battling inflation, and while some progress had been made, this oil shock threatens to undo those efforts. The immediate consequence is higher inflation expectations. If energy prices remain elevated, consumer spending could be curtailed as households dedicate a larger portion of their budget to essentials, and businesses face increased operational costs. This scenario directly impacts the earnings potential of companies within the DowJones30, many of which are energy-intensive or rely on consumer spending.
The market's immediate reaction was a clear risk-off sentiment. The S&P 500 and Nasdaq 100 indices experienced sharp declines, reflecting this heightened caution. This broad market selloff inevitably spills over to the DowJones30. While some energy companies within the Dow might benefit from higher oil prices, the overall impact on a broad-based industrial index is likely to be negative due to the cascading effects on inflation, consumer demand, and corporate profitability. The ADX indicator across various timeframes for the DowJones30 suggests a strong downtrend is forming (1H: 28.4, 4H: 16.8, 1D: 41.99), with the 1-day timeframe showing a very strong trend. This technical picture aligns with the fundamental concerns stemming from the energy market shock.
The sharp rise in oil prices presents a significant risk of reigniting global inflation, potentially forcing central banks to maintain a hawkish stance or even tighten policy further. This could lead to a sustained period of market volatility and pressure on risk assets like the DowJones30.
Technical Tapestry: Reading the DowJones30's Signals
Short-Term Dynamics: A Battle for Control
On the 1-hour chart, the DowJones30 is showing signs of extreme oversold conditions, with the RSI at 22.17 and Stochastic indicators deeply in their lower range. This typically suggests that the selling pressure might be exhausting itself in the short term, potentially leading to a bounce. However, the ADX at 28.4 still indicates a strong downtrend, and the MACD histogram remains negative, painting a picture of conflicting signals. The price action around the $45,077.50 level is crucial. Support levels are identified at $45,189.67 and $45,142.33. A failure to hold these levels could quickly negate any short-term bullish sentiment and lead to further downside pressure, targeting lower support zones. The current trading range is tight, suggesting consolidation or a potential pause before the next move, but the overwhelming trend signals lean towards the downside.
The Bollinger Bands on the 1-hour chart are showing the price trading below the middle band, which generally confirms the bearish momentum. While the Stochastic %K (2.52) has crossed above %D (10.07), indicating a potential short-term upward reversal signal, this needs to be viewed with caution given the strength of the overall downtrend indicated by the ADX. The market is currently exhibiting characteristics of a 'choppy' or ranging market on this timeframe, as suggested by the ADX reading of 16.8 on the 4-hour chart, making directional trades risky without clear confirmation. The general signal across multiple indicators on the 1H timeframe leans towards 'Sell', with 6 out of 8 indicators pointing downwards.
The 4-Hour and Daily View: Trend Confirmation
Stepping back to the 4-hour timeframe, the DowJones30's technical picture remains predominantly bearish. The ADX at 16.8 suggests a weaker trend compared to the 1-hour or daily charts, but the RSI at 31.94 still indicates a move towards oversold territory, while the MACD remains firmly in negative territory, below its signal line. The Stochastic indicators are showing a potential buy signal (%K crossing above %D), but this often occurs in downtrends as a precursor to a bounce rather than a reversal. Support levels are noted at $45,291.33 and $45,103.67, with resistance found at $45,801.33 and $46,123.67. The price action is currently hugging the lower Bollinger Band, a bearish sign.
On the daily chart, the picture is stark. The ADX at 41.99 signifies a very strong downtrend. The RSI at 26.8 is deeply oversold, and the MACD histogram is strongly negative. Stochastic indicators are also showing a sell signal (%K below %D), reinforcing the bearish sentiment. The key support levels to watch on the daily chart are $45,771.33, followed by $45,507.67 and $45,116.33. Resistance is firmly established at $46,426.33. The consistent bearish signals across multiple timeframes, especially the strong ADX on the daily chart, suggest that any short-term bounces are likely to be met with selling pressure, and the path of least resistance remains to the downside. This technical alignment provides a strong backdrop for the fundamental concerns driving the market lower.
The divergence between the short-term oversold indicators (RSI, Stochastic on 1H) and the strong trend-following indicators (ADX, MACD histogram on 1D) highlights the current market dilemma. While a short-term bounce is possible, the overarching trend remains bearish, suggesting that any rallies are likely to be selling opportunities until key resistance levels are decisively broken with conviction and volume.
Market Correlations: The Dollar, Gold, and the DowJones30 Dance
The Dollar's Dominance: A Safe Haven's Strength
The US Dollar Index (DXY) has been a dominant force in the markets this past week, reaching 99.91 and showing a strong upward trend across all analyzed timeframes. This strength is a direct consequence of escalating geopolitical risks. In times of global uncertainty, investors flock to the US dollar as a primary safe-haven asset. This 'flight to safety' dynamic is clearly at play, as evidenced by the simultaneous weakness in risk assets like the S&P 500 and Nasdaq 100. The DXY's upward trajectory is a significant headwind for the DowJones30. A stronger dollar makes US exports more expensive, potentially hurting the earnings of multinational corporations within the index. Furthermore, it can signal a global deleveraging or risk-off environment, which typically correlates with lower equity prices.
The correlation analysis shows that when the DXY moves higher, the DowJones30 often moves lower. With the DXY currently showing strong upward momentum and its RSI at 67.59 on the 4-hour chart indicating a strong upward trend, this bearish correlation for the Dow is likely to persist. The DXY's resistance levels are at $99.79, $99.91, and $100.00. A sustained move above $100 could further exacerbate the pressure on the DowJones30, signaling a deeper risk-off sentiment in the market. Traders are closely watching this dynamic; a weakening dollar would be a prerequisite for any sustained recovery in the DowJones30.
Gold's Rally and its Implications
Gold prices have experienced a significant surge, crossing the $4,500 mark and reaching $4495.44. This rally is primarily fueled by the escalating geopolitical tensions and renewed inflation fears. Gold, often seen as a hedge against inflation and geopolitical instability, has benefited immensely from the current global climate. The news of Iran shutting the Strait of Hormuz and threats to Russian oil exports directly contribute to this safe-haven demand for gold. The daily chart shows a clear upward trend for XAUUSD, with RSI at 56.67 on the 1-hour chart indicating a bullish bias, though the 1D RSI at 36.34 suggests it's not yet in overbought territory. However, the daily MACD is negative, and Stochastic on the 1H is showing a potential pullback signal (%K < %D).
While gold's rally is a sign of market anxiety, its inverse correlation with the stock market is not always straightforward. Sometimes, both can fall during a severe risk-off event if liquidity is the primary driver. However, in this scenario, gold's rise alongside the dollar's strength suggests a complex risk environment. The DowJones30's performance is more directly impacted by the flight to safety into the dollar and the inflationary consequences of rising energy prices than by gold's own price action. The key takeaway here is that gold's strength is a symptom of the broader market fear that is negatively impacting the DowJones30.
The current market environment presents a classic risk-off scenario: rising oil prices fuel inflation fears, boosting the US Dollar (DXY at 99.91) and driving investors towards safe-haven assets like gold (XAUUSD at $4,495.44). This confluence of factors typically weighs heavily on equity indices such as the DowJones30, which is currently trading near $45,077.50.
Economic Calendar Watchlist and Forward Guidance
Key Data Releases: Inflation and Employment on the Horizon
Looking ahead, the economic calendar presents several high-impact events that could significantly influence market direction, including the DowJones30. The upcoming releases for GBP and USD data will be closely scrutinized. While specific dates are not provided for all high-impact events in the provided data, the presence of significant figures like the USD's actual release of 6.926 (previous: 6.156) indicates a potential shift in economic indicators. The preceding data for USD employment figures was 210 (forecast: 211), showing a slight miss which could be a precursor to further economic data that might impact Fed policy expectations.
These data points are crucial because they feed directly into central bank policy expectations. If inflation data continues to show upward pressure, or employment figures remain robust despite concerns, it could embolden the Federal Reserve to maintain a hawkish stance. Conversely, signs of economic weakening could prompt a reassessment of monetary policy, potentially offering relief to equity markets. The market's sensitivity to inflation data, especially in light of the oil price shock, means that any surprises could lead to significant volatility. Traders will be looking for confirmation of the economic trajectory to gauge the Fed's next move, which will undoubtedly shape the DowJones30's path.
Central Bank Signals: The Fed's Tightrope Walk
The Federal Reserve remains in a precarious position. On one hand, the persistent inflation, now potentially exacerbated by rising energy costs, argues for a continued tight monetary policy or even further tightening. On the other hand, the clear risk-off sentiment in global markets and the sharp selloff in equities suggest that the economy might be more fragile than previously thought. This creates a dilemma for the Fed: tighten too much and risk triggering a recession, or ease up too soon and allow inflation to become entrenched. The market's interpretation of Fed communications, meeting minutes, and forward guidance will be critical in the coming weeks.
While specific Fed meeting minutes or policy announcements are not detailed in the provided economic calendar snippet, the underlying economic data will be the primary driver of Fed sentiment. The market's reaction to upcoming employment and inflation figures will be interpreted through the lens of potential Fed action. If the data suggests sticky inflation, the Fed might lean towards hawkishness, which would likely continue to pressure the DowJones30. If the data shows a significant slowdown, the Fed might adopt a more cautious tone, potentially providing some relief. The current technical picture for the DowJones30, with strong downtrend signals on daily charts, suggests that the market is currently pricing in a scenario where the Fed remains focused on inflation, even at the cost of economic growth.
Upcoming economic data, particularly US inflation and employment figures, will be key in shaping the Federal Reserve's policy outlook. Any signs of persistent inflation could lead to continued hawkish rhetoric, pressuring the DowJones30 further as it trades near $45,077.50.
Scenario Analysis: Charting Potential Paths Forward
Bearish Scenario: The Downtrend Continues
65% ProbabilityConsolidation: Waiting for Clarity
25% ProbabilityBullish Reversal: A Counter-Trend Rally?
10% ProbabilityThe Week Ahead: Key Levels and Investor Sentiment
Watching the $45,077.50 Level
As the market digests the implications of geopolitical instability and potential inflationary pressures, the $45,077.50 level for the DowJones30 is more than just a price point; it's a battleground. The sheer number of indicators pointing towards a bearish trend, particularly the strong ADX on the daily chart, suggests that any upward momentum will be met with significant selling pressure. The oversold conditions on shorter timeframes (1H RSI at 22.17) might offer brief respite, but the broader trend remains the dominant narrative. For investors and traders, the key is to observe how price reacts to the immediate support levels identified at $45,189.67 and $45,142.33. A decisive break below these could signal the next leg down, potentially targeting the $44,781.33 area.
Conversely, a sustained bounce from current levels would require a significant shift in market sentiment, possibly driven by de-escalation of geopolitical tensions or surprisingly dovish signals from the Federal Reserve. However, given the current macro backdrop, this appears to be the less probable scenario in the short term. The strength of the US Dollar and the surge in oil prices create a challenging environment for risk assets. The DowJones30's ability to hold above key psychological levels will be a testament to underlying market resilience, but the technicals and fundamentals currently suggest a bearish bias. Traders should remain vigilant, manage risk tightly, and wait for clear confirmation before entering positions.
Key Levels to Monitor
On the support side, the immediate levels to watch are $45,189.67, $45,142.33, and $45,084.67 on the 1-hour chart. A break below these could accelerate the decline. On the daily chart, the more significant support levels are $45,771.33, $45,507.67, and $45,116.33. Resistance remains formidable, with the immediate hurdle at $45,294.67 and $45,352.33 on the 1-hour chart. More importantly, the daily resistance sits at $46,426.33, followed by $46,817.67. A clear break and hold above the $46,426.33 level would be required to invalidate the current bearish outlook and signal a potential trend reversal. Until then, the market appears poised for further downside risk, especially if geopolitical tensions continue to simmer or escalate.
Investor sentiment is currently risk-averse, driven by geopolitical concerns and rising oil prices. This is reflected in the DowJones30's technicals, which show strong downtrend signals on higher timeframes, suggesting caution is warranted.
The current environment demands patience. Instead of chasing falling prices, focus on identifying clear setups. A break below key support levels on increased volume could offer a shorting opportunity, while a decisive move above significant resistance, confirmed by positive macro news, might signal a potential reversal. Always prioritize risk management.
Frequently Asked Questions: DowJones30 Analysis
What happens if DowJones30 breaks below the $45,077.50 level this week?
If the DowJones30 closes below $45,077.50 on a daily basis, it would confirm the strong bearish trend indicated by the ADX at 41.99. The next immediate support target would likely be around $45,116.33, with further downside potential towards $44,781.33.
Is the RSI at 22.17 a buy signal for DowJones30 right now?
An RSI of 22.17 on the 1-hour chart indicates oversold conditions, which could lead to a short-term bounce. However, given the strong daily downtrend (ADX 41.99) and negative MACD, it is not a reliable buy signal for a trend reversal. Confirmation above key resistance levels is needed.
How will escalating Middle East tensions affect the DowJones30's outlook?
Escalating tensions typically increase risk aversion, leading to a stronger US Dollar (currently at 99.91) and higher oil prices (Brent near $110). These factors put pressure on the DowJones30 by increasing inflation fears and potentially squeezing corporate profits, reinforcing the bearish outlook.
What is the significance of the $46,426.33 resistance level for the DowJones30?
The $46,426.33 level represents a major daily resistance zone for the DowJones30. A decisive and sustained break above this price, ideally with increasing volume and positive fundamental catalysts, would be necessary to invalidate the current bearish trend and signal a potential reversal upwards.
The DowJones30 faces a challenging outlook as global geopolitical tensions intensify, fueling inflation fears and a flight to safety. While short-term oversold conditions might offer brief bounces, the overarching trend signals remain bearish, reinforced by strong downtrend indicators on higher timeframes. The current price around $45,077.50 is a critical level to watch, with immediate support at $45,189.67 and resistance firmly placed at $46,426.33. Navigating these markets requires discipline, patience, and a keen eye on macro developments. Remember, volatility creates opportunities for the prepared. Manage your risk diligently, wait for clear setups, and the market will eventually provide its next direction.
Track markets in real-time
AI-powered analysis, technical indicators and real-time price data.
Join Our Telegram Channel
Breaking market news, AI analysis and trading signals instantly.
Join Channel