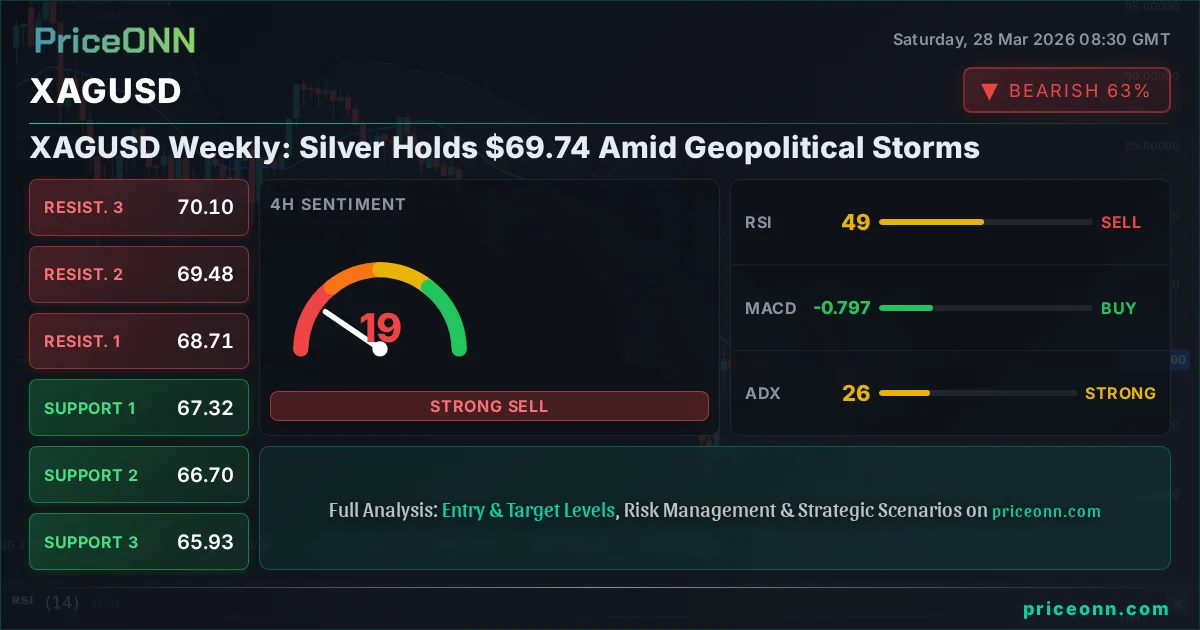
XAGUSD Weekly: Silver Holds $69.74 Amid Geopolitical Storms
Silver stabilized around $69.74 last week, caught between escalating geopolitical tensions and a strengthening USD. Can key levels hold?
The week ended with XAGUSD hovering precariously around the $69.74 mark, a critical juncture that encapsulates the tug-of-war dominating the precious metals market. As geopolitical tensions flared, particularly with Iran's actions in the Strait of Hormuz, gold prices surged past $4,500, a clear indicator of heightened risk aversion. This surge in gold, a traditional safe haven, naturally draws attention to its silvery cousin, XAGUSD. However, the narrative for silver is more complex, influenced not only by safe-haven demand but also by its industrial applications and its often inverse relationship with the US Dollar Index (DXY). With the DXY itself showing strength, currently trading around 99.91, the path forward for silver appears to be a tightrope walk, demanding close observation of key technical levels and broader market sentiment.
- XAGUSD is trading around $69.74, a crucial pivot point influenced by geopolitical events and USD strength.
- Key support for silver lies at $69.62, with a break below potentially targeting $69.05 and $68.59.
- Resistance is developing around $70.65, a break of which could signal further upside towards $71.11 and $71.68.
- The DXY strengthening to 99.91 adds pressure, while gold's surge past $4,500 offers underlying support for precious metals.
Navigating the Geopolitical Crosscurrents
Last week was a stark reminder of how swiftly geopolitical landscapes can shift and how profoundly these shifts impact financial markets. The news of Iran shutting down the Strait of Hormuz, as reported by commodities news outlets, sent shockwaves through energy markets and, by extension, commodities as a whole. Gold, the ultimate safe-haven asset, reacted predictably, rocketing past $4,500. This event underscores a prevailing risk-off sentiment, which typically benefits assets like gold and, to some extent, silver. The surge in gold prices, driven by fears of supply disruptions and escalating global conflict, creates a supportive backdrop for precious metals. However, the correlation isn't always direct. Silver's dual nature as both a monetary and industrial metal means its price action can diverge from gold's, especially when macroeconomic factors like interest rate expectations and currency movements come into play. The fact that XAGUSD is currently trading at $69.74, while gold has seen such a dramatic move, suggests that other forces are at work, potentially tempering silver's safe-haven appeal.
The Dollar's Dominance and its Drag on Silver
While geopolitical tensions provided a bullish tailwind for gold, the strengthening US Dollar Index (DXY) presented a significant headwind for silver. The DXY's push towards the 100-point level, trading around 99.91, reflects a renewed appetite for the greenback, likely fueled by its safe-haven status amidst global uncertainty and potentially higher US interest rate expectations. For XAGUSD, a stronger dollar typically means a more expensive asset for holders of other currencies, dampening demand. This inverse relationship is a constant factor traders must monitor. The current data shows the DXY exhibiting a strong upward trend on the daily timeframe (ADX 31.98), with multiple indicators signaling 'BUY'. This persistent dollar strength is a key reason why silver, despite its own bullish drivers, might be struggling to maintain upward momentum above the $69.74 level. The market is weighing the safe-haven bid against the currency headwind, and for now, the dollar's strength seems to be a dominant force capping immediate upside for silver.
The current upward trend in the DXY (trading at 99.91) presents a significant challenge for XAGUSD. A sustained DXY rally could continue to cap silver's gains, even amidst geopolitical uncertainty. Traders should closely watch the DXY's ability to break above key resistance levels, as further dollar strength would likely translate to downward pressure on silver.
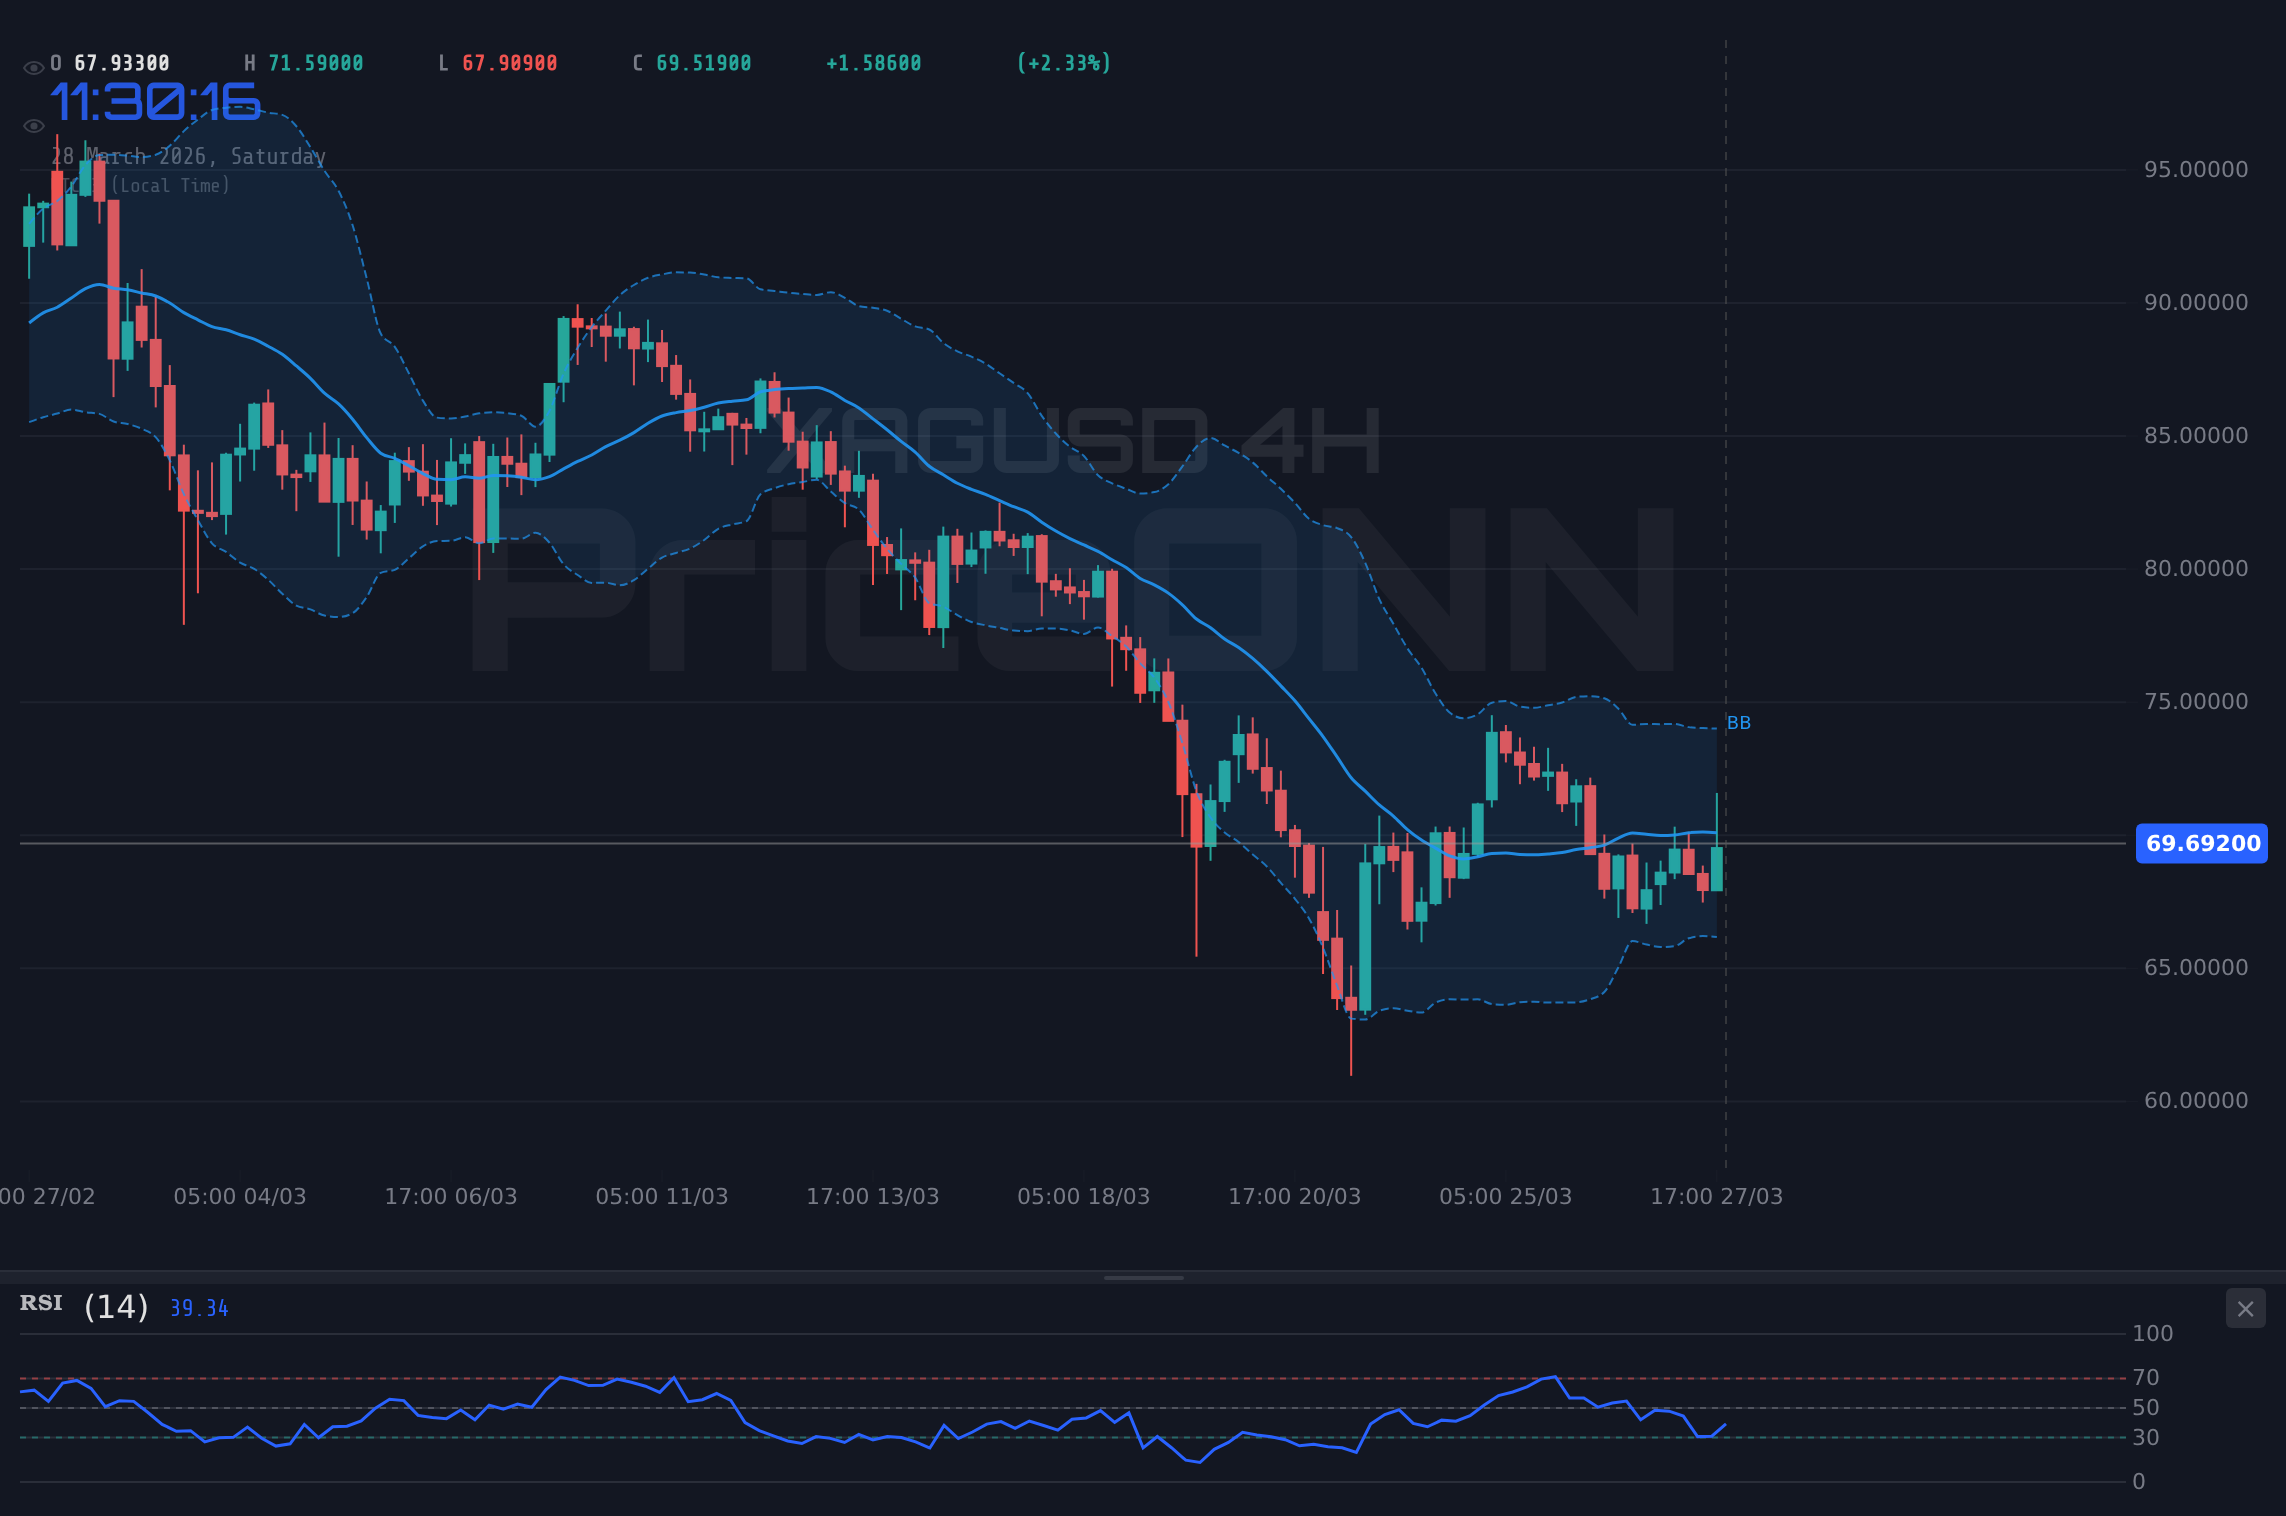
Technical Snapshot: A Tale of Divergent Timeframes
Examining the technical indicators for XAGUSD reveals a market at a crossroads, with mixed signals across different timeframes. On the 1-hour chart, the trend is neutral with a Power of 50%, suggesting short-term indecision. Indicators like RSI (56.67) and Stochastic (K=63.22, D=69.29) show a slight bearish lean, hinting at potential short-term pullbacks. However, the MACD is positive, and the ADX at 24.26 indicates a moderate upward trend is attempting to form. This short-term picture suggests a cautious approach is warranted, with immediate resistance at $70.65 and support at $69.62.
The 4-hour chart paints a slightly different, yet still nuanced, picture. Here, the trend is officially classified as bearish with 84% power, but the RSI (50.56) and Stochastic (K=51.7, D=32.09) are showing a bullish inclination. The MACD remains positive, and the ADX (28.83) points to a strong upward trend, creating a conflict with the overall bearish trend classification. This temporal divergence is common in markets consolidating after significant moves or digesting conflicting fundamental news. It suggests that while the longer-term trend might be under pressure, there are underlying forces pushing for a potential rebound, especially if key resistance levels are breached.
The daily chart, however, presents a more bearish outlook. The trend is strongly downwards (90% power), with RSI at 36.34 and MACD showing negative momentum. The ADX at 30.99 confirms a strong downtrend. This longer-term perspective suggests that any rallies might be short-lived unless significant fundamental shifts occur. The conflict between the short-term bullish signals and the dominant long-term bearish trend is the core of the current trading challenge for XAGUSD around $69.74.
The Bull's Roadmap: Reclaiming the High Ground
For the bulls to regain control and push XAGUSD decisively higher, a clear set of conditions needs to be met. The immediate hurdle is resistance around the $70.65 level. A sustained break and hold above this point, ideally on increased volume, would be the first confirmation. This would suggest that the short-term momentum indicators, like the 1-hour RSI moving above 60 and Stochastic showing a bullish crossover, are gaining traction. If this bullish scenario plays out, the next target would be the $71.11 resistance, followed by a more significant test of the $71.68 level. This upward trajectory would likely be supported by a weakening DXY and continued geopolitical uncertainty driving safe-haven demand. The 4-hour chart's bullish signals, particularly the Stochastic's strong upward move and the ADX indicating a strengthening trend, would then align with the bullish thesis. A successful push above $71.68 could open the door for a move towards the $72-$73 range, levels not seen in recent trading sessions. This scenario hinges on the market's willingness to absorb selling pressure at current levels and for the geopolitical risk premium to outweigh the dollar's strength.
Bullish Scenario: Charting a Course Above $70
35% ProbabilityWhere Bears Take Control: The $69.62 Line in the Sand
Conversely, the bearish scenario for XAGUSD hinges on the failure to hold the current pivotal level around $69.74 and a subsequent breach of the immediate support at $69.62. If this level gives way, it would confirm the bearish bias seen on the daily chart and likely trigger further selling pressure. The 1-hour Stochastic showing a bearish crossover (%K < %D) and the RSI already in a downward trend support this view. A break below $69.62 would target the next support at $69.05. If this level also fails, the bears would likely push XAGUSD towards the $68.59 support. This scenario would be amplified by a continued strengthening of the DXY and any de-escalation in geopolitical tensions, reducing the safe-haven appeal for silver. The daily chart's strong downtrend signals (ADX 30.99) would then be validated, suggesting a potential move back towards the lower end of the recent trading range, possibly testing levels around $67-$68 in the medium term. The failure of short-term bullish signals to materialize and the dominance of the longer-term bearish trend would solidify this outlook.
Bearish Scenario: The Slide Below $69.62
60% ProbabilityThe Waiting Game: Consolidation Around $69.74
It's also entirely plausible that XAGUSD remains range-bound, consolidating around the $69.74 level as markets digest the conflicting fundamental signals. This neutral scenario would likely occur if neither the bullish nor the bearish catalysts fully materialize. Geopolitical tensions might persist, but not escalate to a point of extreme panic, while the DXY strengthens but fails to break decisively higher. In such a scenario, price action could become choppy, with XAGUSD oscillating between the immediate support at $69.62 and resistance at $70.65. The neutral trend power (50%) on the 1-hour chart and the RSI hovering around the 50-level (currently 53.19 on 1H, 49.03 on 4H) would support this view. Traders might see a 'wait-and-see' approach as prudent, looking for clearer signals from upcoming economic data or further geopolitical developments. This consolidation phase could be characterized by lower trading volumes and a lack of clear direction, making it challenging for trend-following strategies but potentially offering opportunities for range-traders.
Neutral Scenario: Caught Between Extremes
5% ProbabilityMarket Correlations and Intermarket Dynamics
Understanding XAGUSD's price action requires looking beyond its own charts and considering its relationship with other key markets. Gold's surge past $4,500 is a significant factor. While not a perfect correlation, silver often follows gold's lead, especially during periods of heightened geopolitical risk. The fact that gold has made such a decisive move higher suggests that underlying demand for precious metals as a safe haven is strong. However, the DXY's concurrent rise to 99.91 presents a counter-narrative. Typically, a strong dollar weighs on dollar-denominated commodities like silver. The current divergence where both gold and the dollar are showing strength is unusual and highlights the dominant role of geopolitical fear. Traders must also consider the broader risk sentiment, as indicated by the S&P 500 and Nasdaq. Last week saw significant drops in US equity indices, with the S&P 500 falling 2% to 6357.55 and Nasdaq down 2.23% to 23092.5. This broad risk-off sentiment should theoretically support safe havens like silver, yet the dollar's strength is complicating this dynamic. The interplay between gold's surge, the dollar's strength, equity market weakness, and oil prices (Brent at $110.64, WTI at $101.19, both surging due to geopolitical fears) creates a complex environment for silver.
The conflicting signals between gold's rally and the dollar's strength create a 'risk-on' for safe-haven assets that is being capped by currency headwinds. This suggests that while underlying demand for metals is present, significant upside for XAGUSD might be delayed until the DXY shows signs of weakness or a clearer direction emerges from US economic data. The current ADX readings (24.26 on 1H, 28.83 on 4H, 30.99 on 1D) indicate a trend is present, but the conflicting signals across timeframes suggest a lack of strong conviction.
Economic Calendar Insights and Future Catalysts
Looking ahead, the economic calendar, though sparse on weekends, holds key events that could sway XAGUSD's trajectory. Last week's US data showed mixed signals, with the latest employment figures (Actual: 6.926 million, Forecast: -1.3 million) indicating a strong labor market, which typically supports dollar strength and potentially higher interest rates. However, other data points were less clear. For the upcoming week, the market will be keenly watching for any major shifts in central bank policy expectations, particularly from the Federal Reserve. While no high-impact events are scheduled for today (Saturday, March 28th), the coming week will bring crucial data releases that could impact the DXY and, consequently, XAGUSD. Any hints about the Fed's stance on inflation and interest rates will be paramount. Furthermore, any significant escalation or de-escalation in Middle Eastern tensions will directly influence safe-haven flows and could trigger sharp moves in both gold and silver. The interplay between monetary policy expectations and geopolitical risk will be the primary narrative driving XAGUSD.
The Verdict: Bearish Bias Prevails, But Watch Key Levels
Weighing the evidence, the current technical and fundamental picture for XAGUSD presents a bearish bias, primarily due to the confluence of a strengthening US Dollar and the dominant longer-term downtrend on the daily chart. The probability for the bearish scenario, targeting a break below $69.62 towards $69.05 and $68.59, is estimated at 60%. This thesis is invalidated if XAGUSD can decisively break and hold above the $70.65 resistance level, which would then open the door for the 35% probability bullish scenario targeting $71.11 and $71.68. The neutral scenario, while possible, appears less likely given the strong trend signals on the daily chart. The key takeaway is that $69.74 is a pivotal point. A break below it confirms the bearish outlook, while a sustained move above $70.65 signals a potential shift.
| Indicator | Value | Signal | Interpretation |
|---|---|---|---|
| RSI (14) | 67.36 | Neutral | At 67.36, indicating potential overbought pressure but not extreme. |
| MACD Histogram | Positive | Bullish | Positive momentum, suggesting upward pressure. |
| Stochastic | K=63.22, D=69.29 | Bearish Crossover | %K below %D suggests a potential pullback. |
| ADX | 24.26 | Moderate Trend | Indicates a moderate trend, favoring potential breakouts. |
| Bollinger | Upper Band | Watch | Price is above the middle band, indicating upward bias. |
What I'm Watching This Week
My focus this week remains squarely on two primary catalysts for XAGUSD: the direction of the US Dollar Index (DXY) and the stability of geopolitical tensions. Specifically, I'll be watching for a decisive break below $69.62. If this support fails, it validates the bearish scenario and opens up targets towards $69.05 and $68.59. Conversely, a strong push above $70.65, especially if accompanied by a weakening DXY and continued safe-haven demand, would signal a bullish reversal, targeting $71.11 and $71.68. The interplay between these two forces will dictate whether silver continues its cautious dance around $69.74 or breaks out decisively in either direction. The upcoming economic data releases, particularly any related to US interest rate policy, will be crucial in shaping the DXY's path and, by extension, silver's fate.
What happens if XAGUSD breaks below the $69.62 support level this week?
A break below $69.62 would invalidate short-term bullish hopes and confirm the bearish trend indicated by the daily chart. This could lead to a rapid decline towards the $69.05 and $68.59 support levels, especially if the DXY continues to strengthen.
Should I consider buying XAGUSD at current levels around $69.74 given the geopolitical risks?
Buying at current levels carries significant risk due to the strong US Dollar headwind. While geopolitical tensions support safe havens, the DXY's strength around 99.91 suggests caution. A more prudent approach might be to wait for a confirmed break above $70.65 resistance or a clear dip towards stronger support levels like $69.05, coupled with a weakening dollar.
Is the Stochastic K=63.22, D=69.29 reading a sell signal for XAGUSD right now?
On the 1-hour chart, the Stochastic's %K value (63.22) being below its %D value (69.29) does indicate a bearish crossover, suggesting potential short-term selling pressure. This aligns with the neutral-to-bearish short-term outlook, but confirmation from price action breaking below $69.62 is needed for a stronger sell signal.
How will upcoming US economic data affect XAGUSD if geopolitical tensions ease?
If geopolitical tensions ease, the market's focus will shift more heavily to US economic data and Fed policy expectations. Stronger-than-expected data would likely boost the DXY further, pressuring XAGUSD. Conversely, weaker data could lead to dollar weakness and a potential rally in silver, especially if it breaks key resistance levels.
Track markets in real-time
AI-powered analysis, technical indicators and real-time price data.
Join Our Telegram Channel
Breaking market news, AI analysis and trading signals instantly.
Join Channel