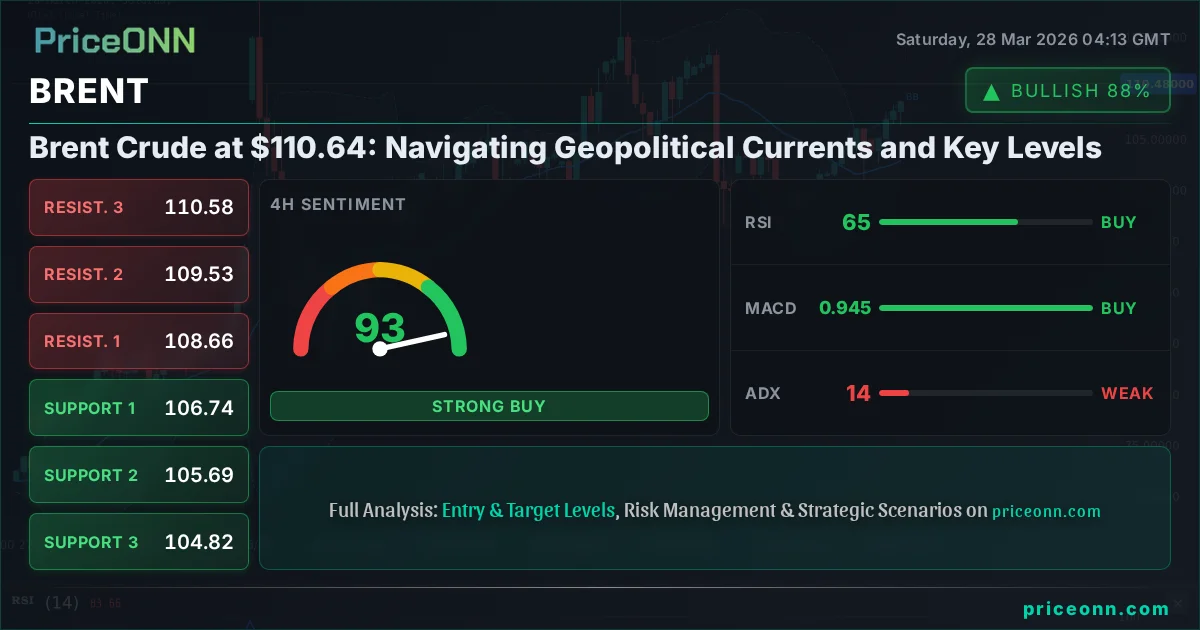
Brent Crude at $110.64: Navigating Geopolitical Currents and Key Levels
Brent Crude holds at $110.64 amidst escalating Middle East tensions. Analysis of technicals, macro factors, and multi-scenario outlook for the week ahead.
The energy markets are once again at a critical juncture, with Brent Crude hovering around the significant $110.64 mark. This level is not just a number; it represents a confluence of escalating geopolitical tensions in the Middle East, shifting global risk appetite, and the persistent inflationary concerns that continue to ripple through the global economy. Last week saw Brent surge past $100, fueled by a potent mix of supply disruption fears and robust demand signals, painting a picture of a market highly sensitive to any hint of instability. As we step into a new trading week, the $110.64 price point serves as a crucial reference, dictating the immediate sentiment and the potential trajectory for oil prices in the coming days and weeks. The question on every trader's mind is whether this bullish momentum can be sustained, or if current levels represent a peak before a potential correction.
- Brent Crude is currently trading at $110.64, a level of significant psychological and technical importance.
- The ADX at 14.41 indicates a choppy, non-trending market on the 1-hour chart, suggesting that a breakout from current ranges may be difficult without further catalysts.
- Despite the weak ADX on the 1H chart, the 1D chart shows a very strong uptrend with ADX at 62.64, indicating strong conviction in the longer-term direction.
- Geopolitical tensions in the Middle East and supply-side concerns are the primary drivers, with potential for further price spikes.
The Bull's Roadmap: Sustaining Momentum Above $110.64
The bullish scenario for Brent Crude hinges on its ability to decisively hold and build upon the current levels, particularly above the $110.64 mark. This past week has been a testament to the underlying strength in oil markets, with prices not only breaching the $100 psychological barrier but also pushing towards higher grounds. The driving force behind this upward momentum has been a complex interplay of factors, chief among them being the escalating geopolitical tensions in the Middle East. Reports of potential force majeure on Baltic shipments due to Ukrainian drone strikes, while seemingly distant, underscore the fragility of global energy supply chains. This heightened risk premium is a significant tailwind for oil prices, as traders price in the possibility of supply disruptions. Furthermore, the continued strength of the US Dollar Index (DXY), which has been a consistent feature in recent trading sessions, typically acts as a headwind for commodities priced in dollars. However, the resilience shown by Brent suggests that the fundamental bullish drivers, primarily supply-side anxieties and robust demand, are currently outweighing the dollar's strength. The 1D chart paints a compelling picture of strength, with an ADX reading of 62.64 indicating a very strong, established uptrend, a stark contrast to the choppier conditions seen on lower timeframes. This suggests that while intraday trading might be volatile, the longer-term conviction remains bullish.
For the bulls to maintain control, several technical and fundamental conditions need to align. A sustained break and hold above $110.64 is paramount. This level has become a focal point, and a decisive move above it, ideally with increasing volume, would signal further upside potential. The immediate resistance level to watch is $110.77 on the 1-hour chart, followed by $119.53 on the 4-hour timeframe. A clear breach of these levels would likely trigger a cascade of buying, as traders rush to join the upward trend. The RSI on the 1D chart, currently at 69.37, is approaching overbought territory but has room to run, especially if momentum continues to build. The MACD on the daily chart, while showing negative momentum, has historically shown resilience in strong uptrends, and a crossover above the signal line would be a powerful confirmation. From a fundamental perspective, any further escalation of Middle East tensions, or significant disruptions to Russian oil exports, would act as a potent catalyst. Additionally, continued robust demand, perhaps signaled by strong PMI data from major economies, would provide further support. The key is that the market must price in these risks and demand factors more aggressively. A break above $110.64, confirmed by higher lows on intraday charts and a sustained RSI above 70 on the daily chart, would set the stage for a potential move towards the $110.77 resistance, and possibly higher towards the $119.53 level within the coming week or two, assuming no major adverse geopolitical events or a shift in central bank policy that strengthens the dollar significantly.
Bullish Scenario: Riding the Geopolitical Wave
65% ProbabilityWhere Bears Take Control: The $110.64 Red Line
Conversely, the bearish scenario for Brent Crude gains traction if the price fails to decisively break above the $110.64 mark and instead falters, succumbing to profit-taking or a shift in market sentiment. The current technical indicators present a mixed picture, which often precedes a reversal or a period of consolidation. While the 1D chart displays a strong uptrend (ADX 62.64), the 1-hour chart's ADX of 14.41 signals a weak, potentially ranging market intraday. This divergence suggests that the strong daily trend might be facing intraday headwinds or a lack of immediate follow-through buying. If sellers manage to push Brent back below the critical $110.64 level, the immediate focus would shift to the support at $109.53 (4H support). A break below this level would be a significant bearish signal, suggesting that the recent rally might have been overextended and is now facing a correction. The RSI on the 1H chart, currently at 79.21, is deep in overbought territory, hinting at an increased probability of a pullback. Similarly, the Stochastic oscillator on the 1H chart shows %K below %D, a classic bearish signal. If these intraday bearish signals are confirmed by a break below the $109.53 support, the next key level to watch would be the 4H support at $108.66. Further down, the $106.74 support on the 4H chart would become the next significant barrier. Fundamentally, a bearish scenario could be triggered by de-escalation of Middle East tensions, which would remove the geopolitical risk premium, or by news of significant increases in oil supply, perhaps from OPEC+ or a surprise increase in US production. If major central banks signal a more aggressive stance on inflation, potentially leading to higher interest rates and slower economic growth, this could also dampen demand expectations and pressure oil prices. The failure to hold $110.64, coupled with bearish technical signals on lower timeframes and a reduction in geopolitical risk, could see Brent retrace towards the $109.53 and subsequently the $108.66 levels.
The failure of Brent to sustain its upward momentum above $110.64 could be interpreted as a sign that the market has already priced in much of the current geopolitical risk, or that demand-side concerns are beginning to reassert themselves. The strong uptrend on the daily chart might be entering a phase of consolidation or correction, especially given the extremely high RSI readings on the 1-hour timeframe. If Brent closes below $110.64 and subsequently breaks the $109.53 support, the probability of a deeper pullback increases significantly. This would likely be accompanied by a shift in market sentiment, potentially driven by positive news from the Middle East or a change in the global economic outlook. The key for the bears is to capitalize on any weakness around the $110.64 level and to confirm the breakdown with subsequent price action below key intraday supports. The Stochastic crossover on the 1H chart, with %K falling below %D, and the RSI's retreat from extreme levels, are early indicators that could signal a shift in momentum. If this bearish thesis plays out, expect to see prices re-test lower support levels, with $109.53 and $108.66 being the immediate areas of interest. A more significant move would target the $106.74 support on the 4H chart, especially if accompanied by a broader market risk-off sentiment. The interplay between supply-side anxieties and demand-side realities will be crucial in determining whether this bearish scenario materializes.
Bearish Scenario: Retreat from the $110.64 Peak
25% ProbabilityThe Waiting Game: Consolidation Around $110.64
A third possibility, and one that cannot be entirely dismissed given the current technical divergence, is a period of consolidation or range-bound trading around the $110.64 level. The 1-hour chart, with its weak ADX of 14.41, strongly suggests that intraday trading might become choppy and lack clear direction. This scenario typically occurs when the market is digesting recent news, awaiting fresh catalysts, or experiencing conflicting signals from different timeframes or indicators. On the bullish side, the daily chart's strong uptrend and robust ADX of 62.64 provide a floor, preventing sharp declines. On the bearish side, the overbought conditions on the 1-hour RSI (79.21) and Stochastic oscillator hint at potential selling pressure that could cap further upside. This tension between the longer-term bullish trend and the short-term overbought signals creates a fertile ground for range-bound trading. In such a scenario, Brent Crude might oscillate between defined support and resistance levels without establishing a clear directional bias.
The key levels to watch in a consolidation scenario would be the intraday support at $109.53 and the immediate resistance at $110.77. Prices could trade within this range for a period, perhaps a few days to a week, as the market waits for a more definitive signal. This waiting game could be influenced by upcoming economic data releases, such as inflation figures or central bank commentary, or by further developments in the Middle East. For instance, if geopolitical tensions remain elevated but stable, without significant new supply disruptions, and demand signals remain mixed, a sideways trend could persist. This would allow the technical indicators to reset. The RSI could cool off from its overbought levels, and the MACD might consolidate near its signal line. The Stochastic oscillator could coil, preparing for a potential move. Traders operating in such an environment would typically focus on range-bound strategies, buying near support and selling near resistance, while carefully managing risk. A breakout from this range, either above $110.77 or below $109.53, would then signal the likely direction for the next significant move. Until then, the market might be in a holding pattern, with $110.64 acting as a pivot point within a broader, albeit potentially volatile, range.
The Waiting Game: Consolidation Around $110.64
10% ProbabilityMarket Context: The Interplay of Geopolitics, Dollar, and Demand
Understanding the current price action in Brent Crude requires a holistic view of the broader market landscape. The energy market is intrinsically linked to geopolitical stability, global economic health, and the value of the US dollar. Currently, the Middle East remains a significant focal point. Any perceived escalation or de-escalation in regional conflicts directly impacts the geopolitical risk premium embedded in oil prices. Reports of potential supply disruptions, even if they don't materialize immediately, keep the market on edge, supporting higher prices. This narrative has been a dominant factor in recent weeks, pushing Brent past the $100 and now towards the $110.64 mark.
Simultaneously, the US Dollar Index (DXY) plays a crucial role. With DXY currently trading around 99.91, its strength acts as a natural headwind for dollar-denominated commodities like oil. Typically, a stronger dollar makes oil more expensive for holders of other currencies, potentially dampening demand. However, the resilience of Brent suggests that fundamental supply concerns are currently overriding dollar strength. This decoupling is noteworthy and warrants close observation. The strength of the dollar is often influenced by Federal Reserve policy expectations. If the Fed signals a more hawkish stance, perhaps due to persistent inflation, the dollar could strengthen further, posing a challenge to oil prices. Conversely, any hint of a dovish pivot or a pause in rate hikes could weaken the dollar and provide further support to Brent.
Demand-side factors are equally critical. Global economic growth, particularly in major consuming nations like China and India, is a key determinant of oil demand. Recent economic data, such as PMI readings, provide insights into industrial activity and consumption patterns. For instance, India's recent move to slash fuel taxes, while aimed at domestic relief, also reflects underlying demand dynamics. If global growth falters, perhaps due to sticky inflation and higher interest rates, oil demand could weaken, capping price gains. The interplay between these factors - geopolitical risk, dollar strength, and demand outlook - creates a complex environment. The current bullish trend in Brent suggests that supply-side risks and robust demand expectations are currently the dominant forces, but any shift in these dynamics, particularly concerning global growth or a significant easing of geopolitical tensions, could quickly alter the market's trajectory.
The Weekly Perspective: Key Levels and What to Watch
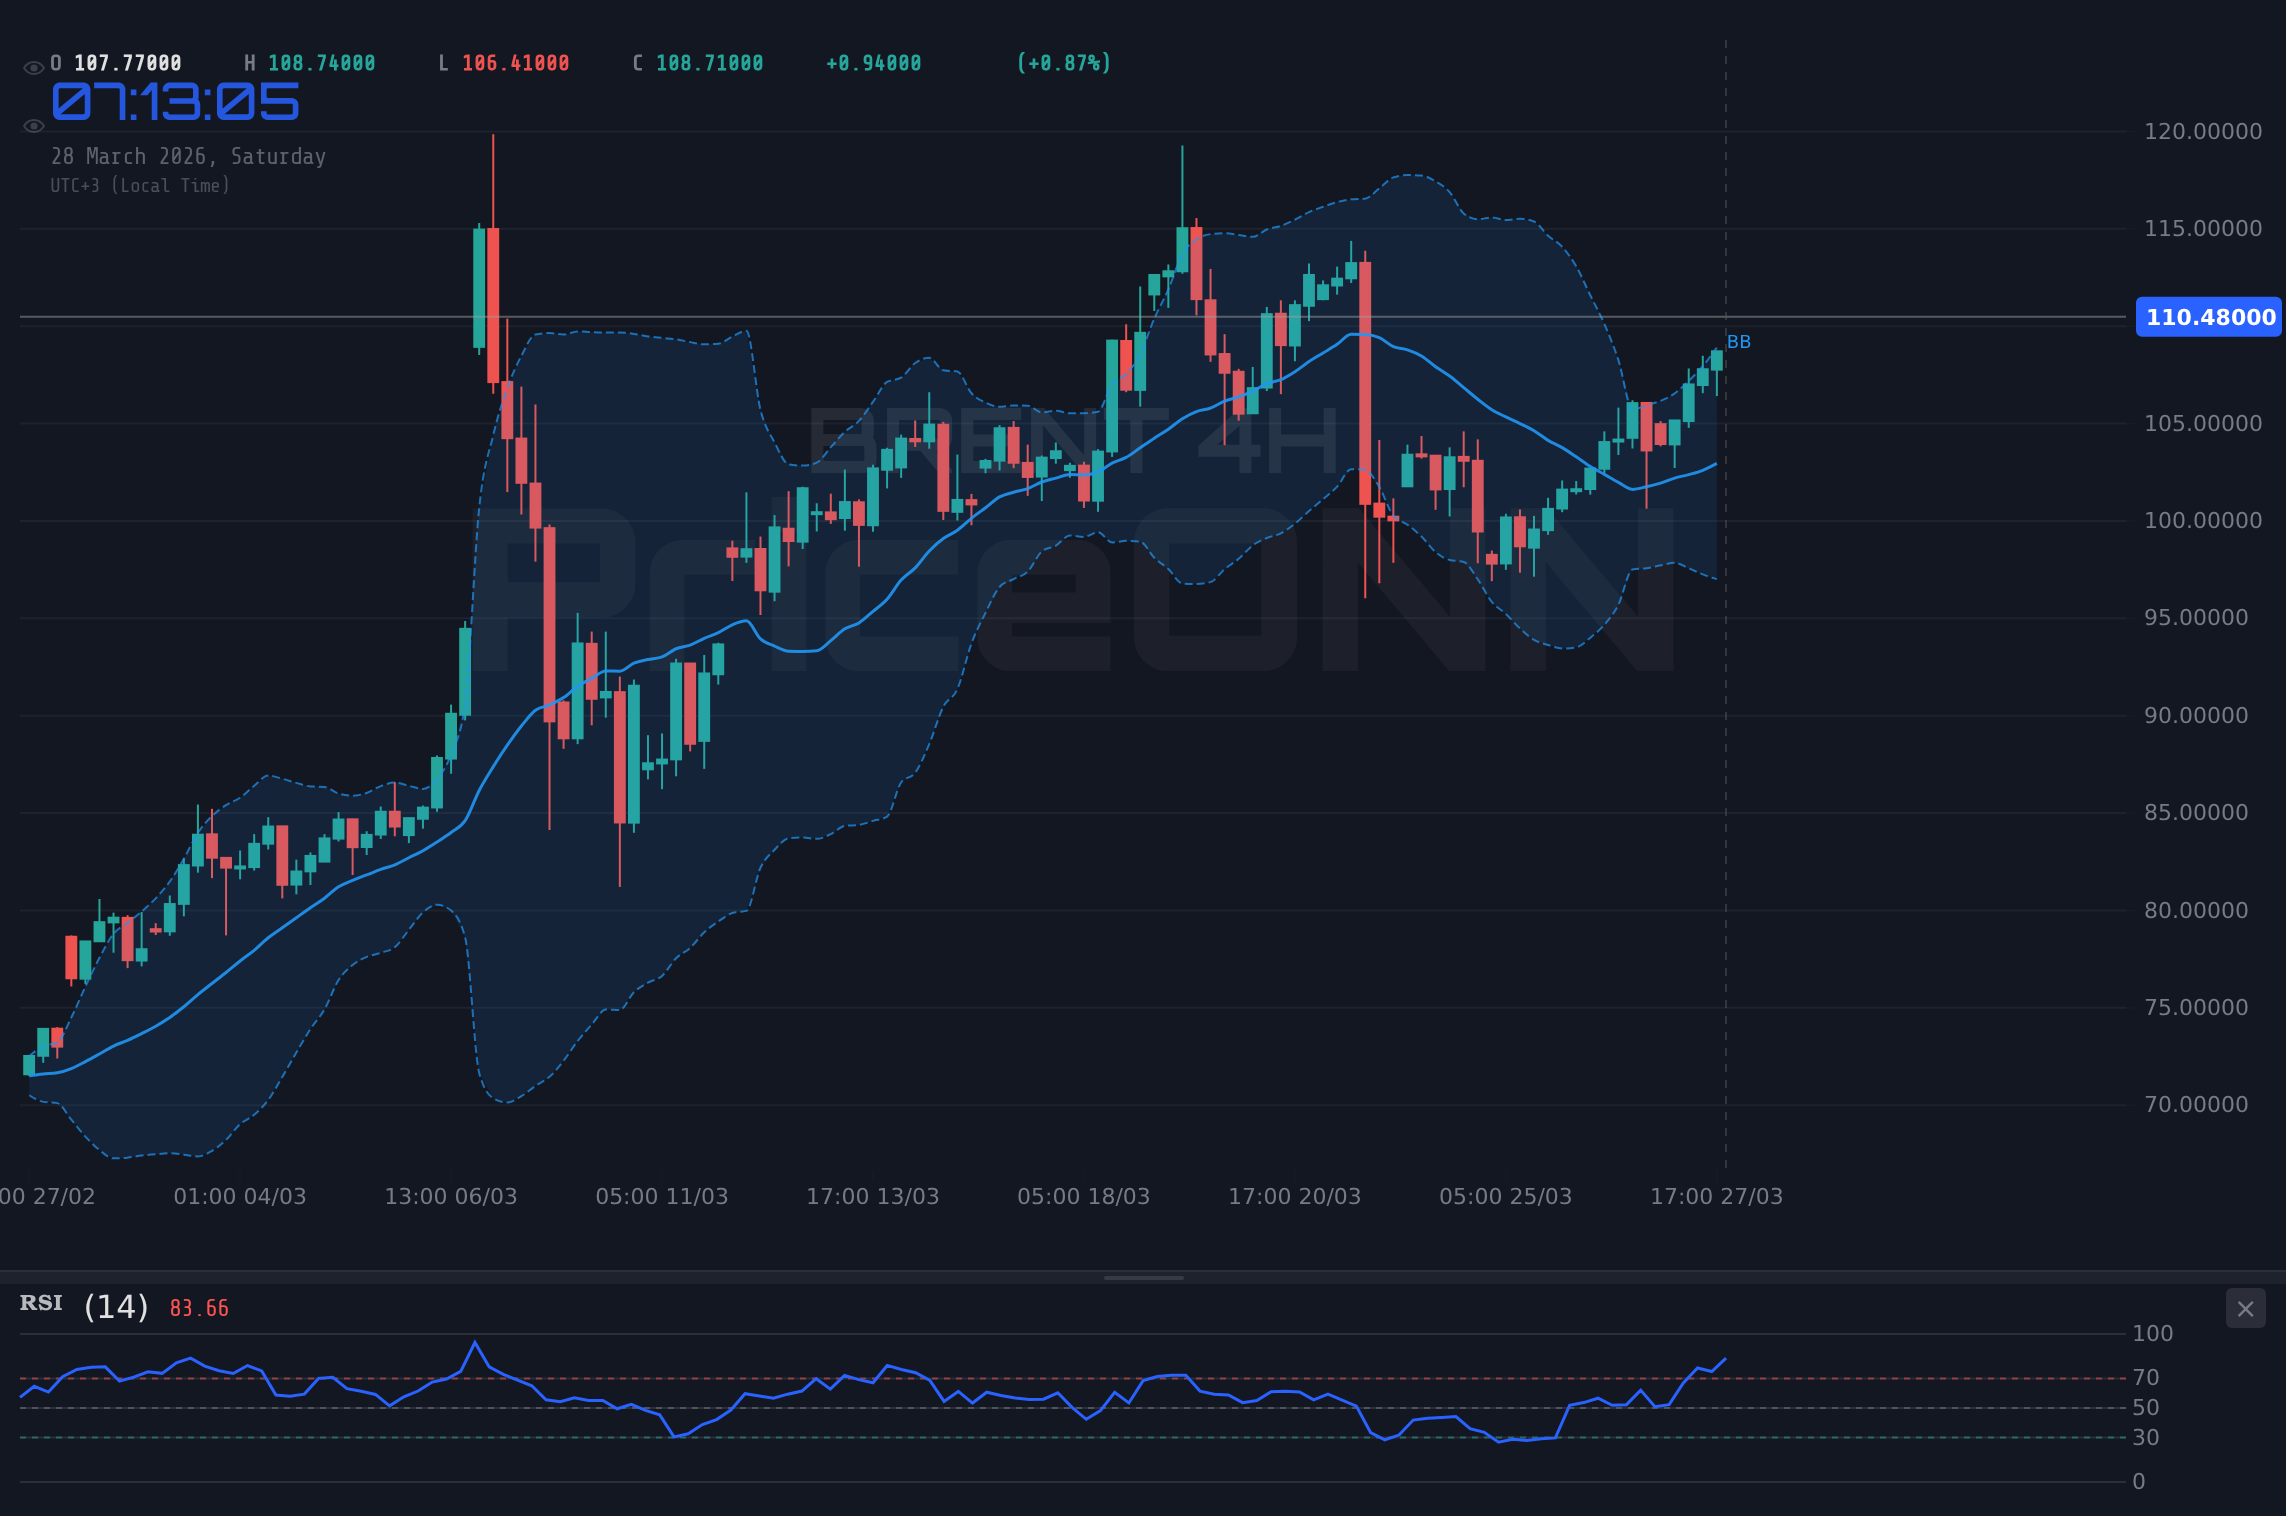
Looking back at the past week, Brent Crude's performance has been undeniably bullish, culminating in a strong push towards the $110.64 level. The price action demonstrated significant upward momentum, breaking through previous resistance points and establishing higher lows. This upward trajectory was largely driven by escalating geopolitical tensions in the Middle East, which added a substantial risk premium to oil prices. The market's reaction to these events has been swift, with traders actively pricing in potential supply disruptions. From a technical standpoint, the daily chart analysis reveals a strong underlying uptrend, as indicated by the high ADX value of 62.64. This suggests that the bullish sentiment is well-entrenched on longer timeframes, despite some choppiness observed on intraday charts. The RSI on the daily chart, currently at 69.37, is approaching overbought territory but has room to extend higher, especially if the bullish momentum continues.
As we look ahead to the coming week, several key levels and events will be crucial in determining Brent's direction. The immediate price point of $110.64 remains the most critical level to watch. A sustained hold above this mark would be bullish, potentially paving the way for a test of the $110.77 resistance. Conversely, a failure to hold this level could see prices retrace towards the $109.53 support. On the 4-hour chart, the support at $109.53 and resistance at $110.77 are key intraday levels. Further out, the 4-hour resistance at $119.53 represents a significant upside target if the bullish trend accelerates. On the downside, the 4H support at $108.66 and $106.74 will be critical areas to monitor if selling pressure intensches. From a fundamental perspective, all eyes will be on developments in the Middle East. Any news regarding de-escalation or further escalation will have a direct impact on the geopolitical risk premium. Additionally, key economic data releases, particularly those related to inflation and global growth, will be closely watched. Central bank commentary, especially from the Federal Reserve, regarding interest rate policy could also influence the US dollar and, consequently, oil prices. Traders should also monitor inventory reports, as significant builds or draws can impact short-term price action.
| Indicator | Value | Signal | Interpretation |
|---|---|---|---|
| RSI (14) | 69.37 | Neutral | Approaching overbought territory on daily, but shows upward trend. |
| MACD Histogram | +0.69 | Bullish | Positive momentum, but watch for divergence on lower timeframes. |
| Stochastic | K=39.82, D=46.48 | Bearish | %K < %D suggests potential pullback, especially on 1D. |
| ADX | 62.64 | Bullish | Very strong uptrend on the daily chart. |
| Bollinger | Mid Band | Bullish | Price is above the middle band, indicating upward bias. |
What I'm Watching This Week
The market is at a critical juncture for Brent Crude, and several factors will dictate its path. Firstly, the price action around $110.64 is paramount. A sustained hold above this level, confirmed by a break of $110.77, would support a bullish continuation. Conversely, a failure to hold $110.64 and a subsequent break below $109.53 would signal a potential reversal or deeper correction. Secondly, geopolitical developments in the Middle East remain the primary wildcard. Any significant escalation or de-escalation will directly influence the risk premium. Keep a close eye on news flow from this region. Finally, economic data releases, particularly inflation figures and central bank commentary, will be crucial. Persistent inflation could lead to a stronger dollar and higher interest rates, potentially capping oil's upside. A shift in central bank tone could, however, weaken the dollar and provide further tailwinds for Brent. The confluence of technical levels and fundamental drivers makes this a pivotal week for energy markets.
Frequently Asked Questions: BRENT Analysis
What happens if BRENT breaks decisively above $110.77 resistance?
A sustained break above $110.77, especially if confirmed by increasing volume and a bullish RSI trend on the daily chart, would likely trigger further upside momentum. This could target the next significant resistance level at $119.53 within the next week or two, assuming geopolitical tensions remain elevated.
Should I consider buying BRENT at current levels of $110.64 given the mixed 1H and strong 1D signals?
Given the divergence between the choppy 1H chart (ADX 14.41) and the strong 1D uptrend (ADX 62.64), caution is advised. A bullish entry would be more compelling on a confirmed breakout above $110.77, or on a pullback to a key support level like $109.53 if it holds and shows signs of reversal, rather than buying at current levels without further confirmation.
Is the RSI at 69.37 a warning sign for BRENT right now?
An RSI of 69.37 on the daily chart is approaching overbought territory but is not yet an extreme signal. In a strong uptrend, RSI can remain elevated for extended periods. However, it does suggest that the market is becoming extended, and a short-term pullback or consolidation is possible, especially if intraday indicators show bearish divergence.
How will escalating Middle East tensions affect BRENT prices this week?
Escalating tensions typically add a geopolitical risk premium to oil prices, supporting higher levels for Brent. If tensions intensify, expect Brent to potentially break above $110.77 and target higher resistance levels. Conversely, any sign of de-escalation could lead to a rapid unwinding of this premium, pressuring prices lower towards support levels like $109.53.
Track markets in real-time
AI-powered analysis, technical indicators and real-time price data.
Join Our Telegram Channel
Breaking market news, AI analysis and trading signals instantly.
Join Channel