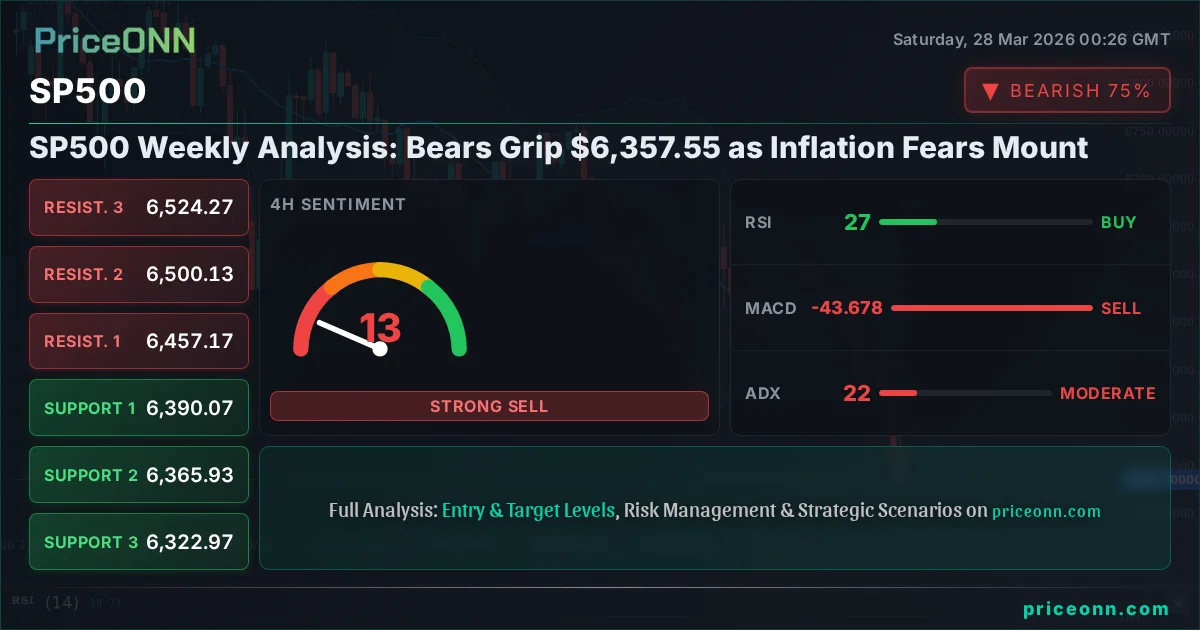
SP500 Weekly Analysis: Bears Grip $6,357.55 as Inflation Fears Mount
The SP500 closed near $6,357.55, facing strong bearish momentum amid persistent inflation concerns and a strengthening dollar.
The market's gaze is fixed on the SP500 as it navigates treacherous territory, closing last week near the critical $6,357.55 level. This past week was a stark reminder of the market's sensitivity to inflation data and geopolitical undercurrents, with bears firmly in control. The sharp decline, mirroring weakness across global indices and a surging dollar, paints a cautious picture for the week ahead. As traders brace for potential further downside, understanding the interplay between macroeconomic factors, technical signals, and investor sentiment is paramount. This analysis dives deep into the forces shaping the SP500's trajectory, dissecting the bull and bear arguments and providing a clear outlook for the coming trading sessions.
- The SP500 ended the week around $6,357.55, with significant bearish pressure evident across all timeframes.
- RSI at 19.92 on the 1-hour chart signals extreme oversold conditions, suggesting a potential short-term bounce, but the daily RSI at 26.73 indicates deeper weakness.
- Key support at $6,356.43 was breached on the 1H chart, with the next significant level at $6,322.97 on the 4H chart, highlighting downside risk.
- The Dollar Index (DXY) at 99.91 continues its ascent, reinforcing pressure on risk assets like the SP500 and suggesting a risk-off environment.
The past week was undeniably brutal for equity markets, and the SP500 bore the brunt of the selling pressure. A confluence of factors, including stubborn inflation readings, hawkish whispers from central bankers, and escalating geopolitical tensions, created a perfect storm for risk assets. The index not only failed to hold previous gains but also sliced through key support levels, leaving investors questioning the immediate future. This sharp downturn, a significant departure from the optimistic sentiment that characterized previous weeks, underscores the market's fragility and its susceptibility to macroeconomic shifts. We saw a dramatic shift in risk appetite, with the DXY's climb above 99.91 signaling a clear preference for safe-haven assets over riskier equities. This dynamic is crucial for understanding the SP500's current predicament and its potential path forward.
The Bear Case: Why the Downside Looks Persuasive
The narrative for a continued downturn in the SP500 is compelling, built on a foundation of persistent inflation, tightening monetary policy expectations, and weakening technicals. The latest economic data, while mixed, has consistently shown sticky inflation, forcing market participants to recalibrate their expectations for central bank actions. While some hoped for a dovish pivot, the reality appears to be a prolonged period of higher-for-longer interest rates, which acts as a significant headwind for equity valuations. The SP500's current price of $6,357.55 finds itself in a precarious position, having shed substantial ground in a very short period. This rapid decline, especially on the 1D chart where the ADX reading of 47.68 indicates a strong downtrend, suggests that the selling pressure is not merely a correction but potentially the start of a more significant trend reversal.
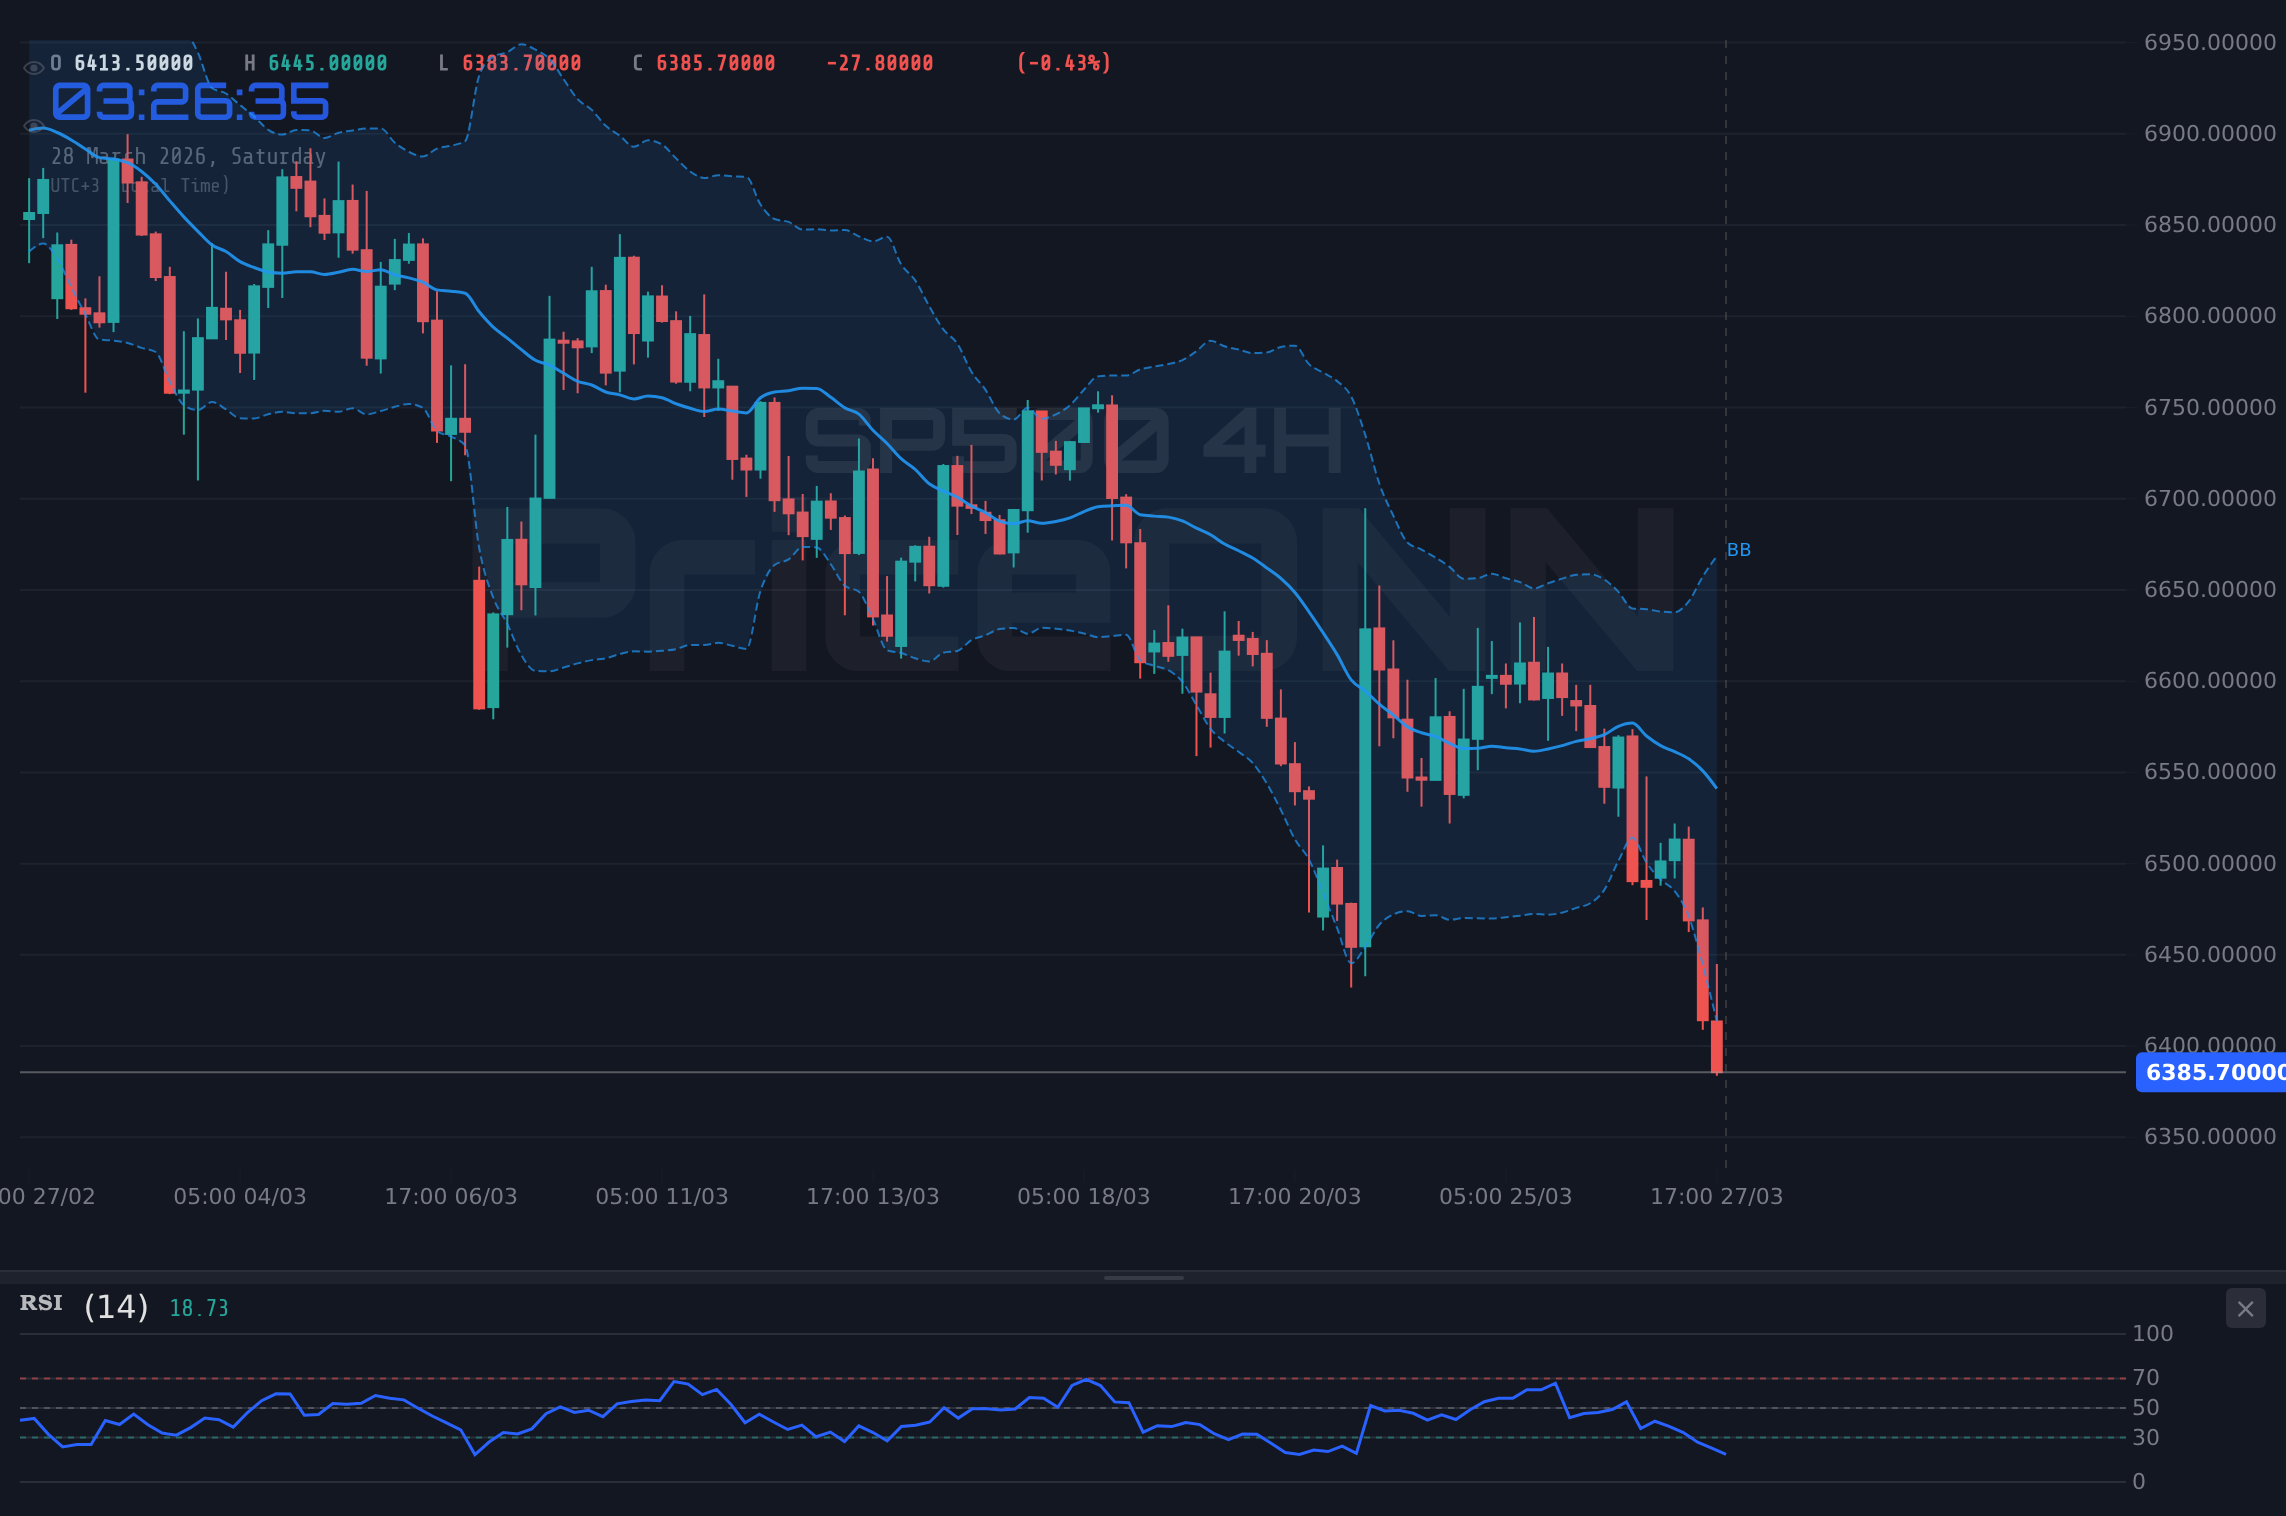
Technically, the picture is overwhelmingly bearish across multiple timeframes. The daily RSI reading of 26.73, deep in oversold territory, might tempt some to call a bottom, but it also reflects significant bearish momentum that has yet to abate. Historically, such low RSI readings can persist in strong downtrends, and a bounce alone does not signify a trend change. The MACD on the 1D chart remains firmly below its signal line, with negative momentum clearly in play. Furthermore, the price action has consistently stayed below the middle Bollinger Band, a sign of bearish control. The ADX at 47.68 on the daily chart is a particularly strong signal of a robust downtrend, suggesting that any counter-trend rallies are likely to be met with significant selling pressure. The 4-hour chart reinforces this, showing an ADX of 22.36, still indicative of a trend, and the price consistently hugging the lower Bollinger Band.
The correlation with the US Dollar Index (DXY) also adds weight to the bearish argument. As the DXY pushed towards 99.91 and beyond, it exerted considerable pressure on risk assets. The inverse relationship is clear: a stronger dollar typically makes US exports more expensive and can signal global economic uncertainty, prompting a flight to safety that bypasses equities. With the DXY showing a strong uptrend on daily and 4-hour charts (ADX 31.98 and 20.81 respectively), this dynamic is likely to persist, acting as a drag on the SP500. The narrative of a strengthening dollar, driven by the prospect of continued high interest rates or safe-haven demand, directly contradicts a bullish outlook for US equities.
Geopolitical risks remain elevated, adding another layer of uncertainty. Ongoing conflicts and trade tensions create a backdrop of global instability, discouraging risk-taking. Investors are increasingly seeking the perceived safety of US Treasuries and the dollar, rather than volatile stock markets. This environment is not conducive to the kind of risk-on sentiment that typically fuels SP500 rallies. The market is pricing in a scenario where global growth slows, corporate earnings come under pressure, and the cost of capital remains elevated. This fundamental backdrop, combined with the technical breakdown, paints a grim picture for the bulls in the near term. The fact that the SP500 has fallen so sharply, despite many expecting a more benign economic environment, speaks volumes about the underlying fragility.
The SP500's failure to hold the $6,371.83 support level on the 1-hour chart was a significant bearish signal. This breach, followed by a close below $6,356.43, opens the door for further declines. The next major support zone to watch is around $6,322.97 on the 4-hour chart. A decisive break below this level would confirm the bearish trend and could trigger a cascade of stop-loss orders, accelerating the downward move.
The current market sentiment is heavily skewed towards fear. Volatility indicators, while not explicitly provided in the live data feed for the SP500 itself, can be inferred from the sharp price movements and the general risk-off sentiment. When the market experiences such rapid declines, volatility typically spikes, making investors more risk-averse. This heightened fear often leads to further selling as investors de-risk their portfolios, exacerbating the downturn. The general trend across major indices like the Nasdaq 100 (currently at 23,092.50) and the Dow Jones 30 (at 45,077.50) mirrors this bearish sentiment, indicating a broad-based equity market selloff rather than isolated weakness in the SP500.
The Bull Case: Signs of a Potential Rebound?
Despite the overwhelming bearish sentiment, there are a few glimmers of hope that could support a bullish counter-argument for the SP500. The most prominent technical signal suggesting a potential short-term reprieve is the extreme oversold condition on the 1-hour chart. With an RSI reading of 19.92 and Stochastic K line at 2.13, the market is technically screaming 'oversold'. This suggests that a bounce is statistically likely, even if it doesn't signify a full trend reversal. Such bounces can offer temporary relief and provide opportunities for short-covering or tactical buying, especially if they are sharp and quick. The price is currently hovering around $6,357.55, and a successful defense of this level, followed by a move back above the 1-hour resistance at $6,387.23, could initiate a short-covering rally.
Furthermore, the sheer magnitude of the recent decline might attract bargain hunters and long-term investors who see current levels as an attractive entry point for assets they believe are fundamentally sound. While the macro environment remains challenging, the SP500 is an index representing a broad swath of the US economy, including many growth-oriented technology companies. If inflation shows any signs of cooling in upcoming reports, or if central banks signal a less aggressive stance than currently priced in, the market could react very positively. The market often overshoots to the downside, and a rapid snapback is not out of the question, especially after such a steep sell-off.
The correlation with the DXY, while currently bearish for the SP500, could also shift. If the DXY's ascent stalls or reverses due to changing central bank expectations or a sudden increase in global risk aversion that favors other safe havens, it could provide some breathing room for equities. Similarly, if geopolitical tensions were to de-escalate unexpectedly, it would remove a significant overhang and potentially boost investor confidence. While these are speculative scenarios, they highlight the possibility of a swift sentiment shift that could propel the SP500 higher, even if the underlying economic fundamentals haven't drastically changed overnight.
The oversold conditions on shorter timeframes, particularly the 1-hour chart, are undeniable. The Stochastic indicator, with K=2.13 and D=8.64, is deeply entrenched in oversold territory. A crossover here, especially if accompanied by a surge in buying volume, could signal the start of a bounce. While the daily chart remains bearish, short-term traders might look to capitalize on any technical oversold bounces. The key would be for the price to reclaim the $6,371.83 level and then decisively break through the 1-hour resistance at $6,387.23. This would be the first sign that the immediate selling pressure might be easing, opening the door for a move towards the next resistance at $6,396.67.
However, it's crucial to temper this bullish perspective with realism. The underlying macro conditions - stubborn inflation, high interest rates, and geopolitical instability - are not dissipating quickly. Any bullish argument must acknowledge these headwinds and focus on tactical opportunities rather than a sustained trend change. The current price of $6,357.55 is a level that has seen significant selling, and breaking back above it decisively would require strong conviction and potentially a catalyst that isn't immediately apparent. The strength of the downtrend on the daily chart (ADX 47.68) suggests that any rallies are likely to be sold into, at least until more compelling evidence of a trend shift emerges.
The extreme oversold readings on the 1-hour chart (RSI 19.92, Stochastic K=2.13) present a potential for a short-term technical bounce. If the SP500 can hold above $6,356.43 and reclaim $6,371.83, a move towards $6,387.23 is possible. However, this is a tactical play, not a confirmation of a trend reversal.
Connecting the Dots: Intermarket Dynamics
The SP500 does not operate in a vacuum. Its movements are deeply intertwined with other major markets, and understanding these correlations is key to deciphering its future direction. The Dollar Index (DXY) at 99.91 is currently a dominant force. Its steady ascent, supported by strong technicals across multiple timeframes (1H ADX 22.17, 4H ADX 20.81, 1D ADX 31.98), is acting as a significant headwind for US equities. A stronger dollar typically implies tighter global liquidity, increased borrowing costs for international entities, and a potential slowdown in global trade – all negative for corporate earnings and, consequently, the SP500. The current price action suggests this correlation remains intact, with the dollar's strength contributing to the risk-off sentiment that is punishing the stock market.
Commodities, particularly oil, present a mixed picture. WTI crude oil surged past $101.19, with Brent crude also climbing significantly. This rise in oil prices, often driven by geopolitical tensions in the Middle East and supply concerns, has a dual impact. On one hand, it fuels inflation expectations, which is negative for equities as it implies higher interest rates. On the other hand, it can be seen as a sign of robust global demand, which could be positive. However, in the current environment, the inflationary aspect seems to be dominating market sentiment, reinforcing the bearish case for the SP500. The fact that oil prices are rallying while stocks are falling suggests that the market is more concerned about the inflationary consequences than the demand-side implications.
The performance of other major indices, such as the Nasdaq 100 at 23,092.50 and the Dow Jones 30 at 45,077.50, provides further context. Both have experienced sharp declines mirroring the SP500's trajectory. This broad-based weakness across the equity spectrum indicates that the current downturn is not sector-specific but rather a systemic risk aversion affecting the entire market. The fact that even the Dow Jones, often seen as more defensive due to its value-oriented components, is falling sharply underscores the depth of the current bearish sentiment. The correlation here is strong: when one major US index falls, the others tend to follow, especially when driven by macro factors.
Gold prices (XAUUSD at 4495.44) have shown remarkable resilience, even rallying significantly. This is a classic safe-haven play. As equities fall and geopolitical risks rise, investors often flock to gold. The fact that gold is performing strongly while the SP500 is struggling reinforces the idea that capital is moving away from risk assets and towards perceived safe havens. This divergence highlights the market's current fear and its preference for capital preservation over growth. The strength in gold, coupled with the strength in the DXY, paints a complex picture where both the US dollar and traditional safe havens are attracting capital, suggesting a broad flight from risk across the board.
The economic calendar, though featuring less impactful data this past week due to the weekend, has had its recent significant releases. The US Non-Farm Payrolls (NFP) data, previously reported at 6.926, came in stronger than expected, fueling concerns about inflation and the Federal Reserve's potential response. This data point is crucial because it directly impacts interest rate expectations, which in turn influence equity valuations. A strong jobs market can be a double-edged sword: good for the economy in the long run, but potentially bad in the short term if it fuels inflation and leads to higher rates. The market's reaction to this data suggests it's currently focusing on the negative implications for interest rates.
The Verdict: Bears in the Driving Seat, Watch for Tactical Bounces
After dissecting the arguments and analyzing the intermarket dynamics, the prevailing sentiment points towards continued downside pressure on the SP500 in the near term. The bear case is significantly more robust, supported by a potent combination of persistent inflation, the prospect of higher interest rates, a strengthening dollar, elevated geopolitical risks, and critically, deeply bearish technical signals across multiple timeframes. The daily chart, with its strong ADX of 47.68 and RSI languishing at 26.73, indicates that the downtrend has significant momentum and is unlikely to reverse without a substantial catalyst.
The current price of $6,357.55 represents a level that has been decisively broken, with the next significant support at $6,322.97. A failure to hold this level would likely trigger further aggressive selling. While the 1-hour chart shows oversold conditions (RSI 19.92, Stochastic K=2.13), suggesting a potential for a short-term technical bounce, this should be viewed as a tactical opportunity rather than a sign of a sustained trend reversal. Such bounces are often short-lived in strong downtrends and are typically met with renewed selling pressure as participants look to exit positions or initiate shorts at better levels.
The correlation with the DXY at 99.91 remains a key factor. As long as the dollar continues to show strength, particularly on daily charts with an ADX of 31.98, it will exert downward pressure on the SP500. Geopolitical risks and the inflationary impact of rising commodity prices, like WTI crude oil at $101.19, further reinforce the risk-off environment. Investors are prioritizing capital preservation, leading to outflows from equities and inflows into safe-haven assets like gold (XAUUSD at 4495.44) and the dollar itself.
Therefore, the outlook for the SP500 remains cautiously bearish. While traders might look for short-term opportunities on oversold bounces, the broader trend suggests further weakness. The key levels to watch will be the breached support at $6,356.43, now acting as resistance, and the next significant support at $6,322.97. A move above $6,387.23 could signal a temporary relief rally, but conviction would require breaking much higher levels and seeing a shift in the underlying macro narrative. Until then, the bears appear to hold the advantage, and caution is the prudent approach for investors.
Bearish Scenario: Downside Momentum Continues
65% ProbabilityNeutral Scenario: Choppy Trading and Consolidation
25% ProbabilityBullish Scenario: Short-Term Bounce Play
10% ProbabilityFrequently Asked Questions: SP500 Analysis
What happens if SP500 breaks below the $6,322.97 support level?
A break below $6,322.97 on the 4-hour chart would confirm the bearish trend, likely triggering further selling. This could lead to a rapid decline towards $6,300 and potentially $6,250 as market participants liquidate positions.
Should I consider buying at the current SP500 levels around $6,357.55 given the oversold RSI?
Buying at current levels carries significant risk due to the strong bearish trend indicated by the daily ADX of 47.68. While a short-term technical bounce is possible due to the 1H RSI at 19.92, it's a tactical play with a low probability of success. Wait for stronger confirmation, such as reclaiming key resistance levels like $6,387.23.
Is the RSI reading of 26.73 on the SP500 daily chart a buy signal?
An RSI of 26.73 on the daily chart indicates extremely oversold conditions, but it is not a direct buy signal in a strong downtrend. Historically, such low RSI levels can persist, and a trend confirmation like a bullish divergence or a break above resistance is needed before considering a long position.
How will the strengthening DXY at 99.91 affect the SP500 this week?
The strengthening DXY, currently above 99.91 with strong uptrend signals (1D ADX 31.98), typically exerts downward pressure on the SP500. This inverse correlation suggests that as the dollar gains strength, risk assets like the SP500 may face further declines, especially if the trend continues.
Volatility creates opportunity – those prepared will be rewarded. The current market environment demands discipline, a clear understanding of risk, and patience. While the path ahead appears challenging, identifying key levels and adhering to a well-defined strategy will be crucial for navigating these choppy waters.
The market is a dynamic arena; what seems like a definitive trend today can shift with new data or events. Always manage your risk, wait for clear setups, and remember that opportunities often arise from periods of uncertainty. The key is to be ready when the market presents a favorable risk/reward scenario.
Track markets in real-time
AI-powered analysis, technical indicators and real-time price data.
Join Our Telegram Channel
Breaking market news, AI analysis and trading signals instantly.
Join Channel