AUDUSD Weekly: Neutral Drift at $0.68761 - Key Levels to Watch
AUDUSD faces a neutral drift at $0.68761. Explore key levels, technical signals, and market correlations in this in-depth weekly outlook.
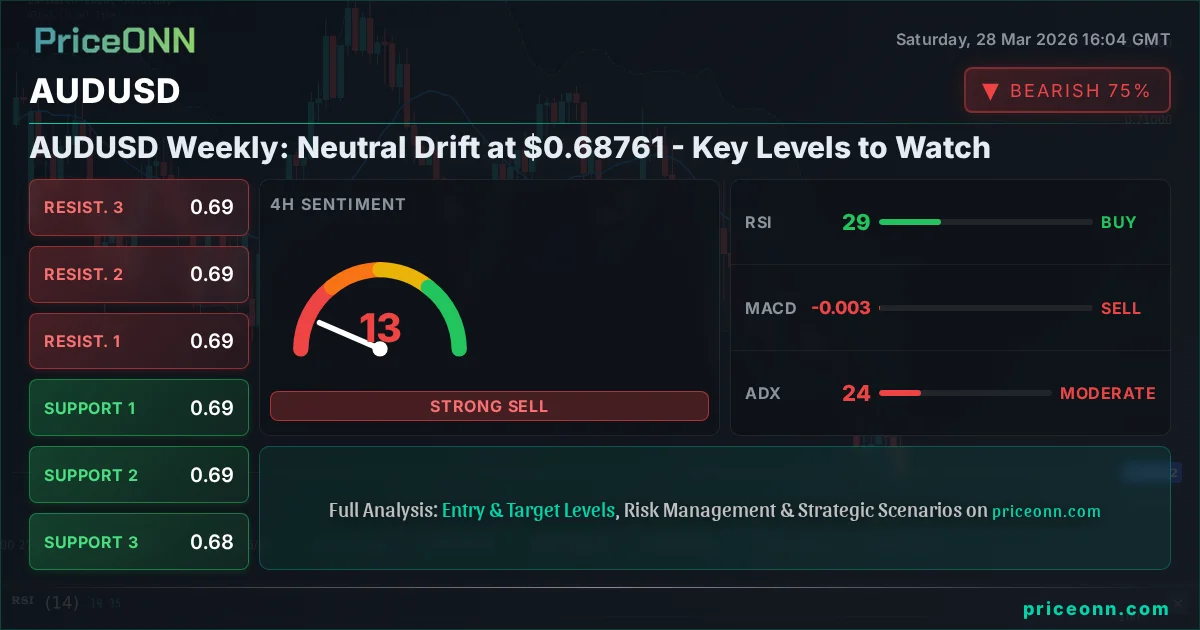
As the market closes for the week, the AUDUSD pair finds itself in a precarious neutral position, hovering around the critical $0.68761 mark. This level, representing a delicate balance between competing forces, demands close attention from traders and investors alike. The past week has been a tapestry of shifting risk sentiment, geopolitical undercurrents, and diverging central bank narratives, all of which have converged to shape the current technical landscape for the Australian Dollar against the US Dollar. In this comprehensive weekly review, we will dissect the intricate interplay of these factors, examining the technical indicators, key price levels, and broader market correlations that are likely to dictate AUDUSD's trajectory in the coming days. We aim to provide a clear roadmap, identifying the critical junctures and potential scenarios that traders must be aware of as they navigate these choppy waters.
- The AUDUSD is currently trading at $0.68761, reflecting a neutral technical bias with a slight downward tilt on longer timeframes.
- Critical support for AUDUSD sits at $0.68557, a level tested multiple times this week, while resistance looms at $0.69368.
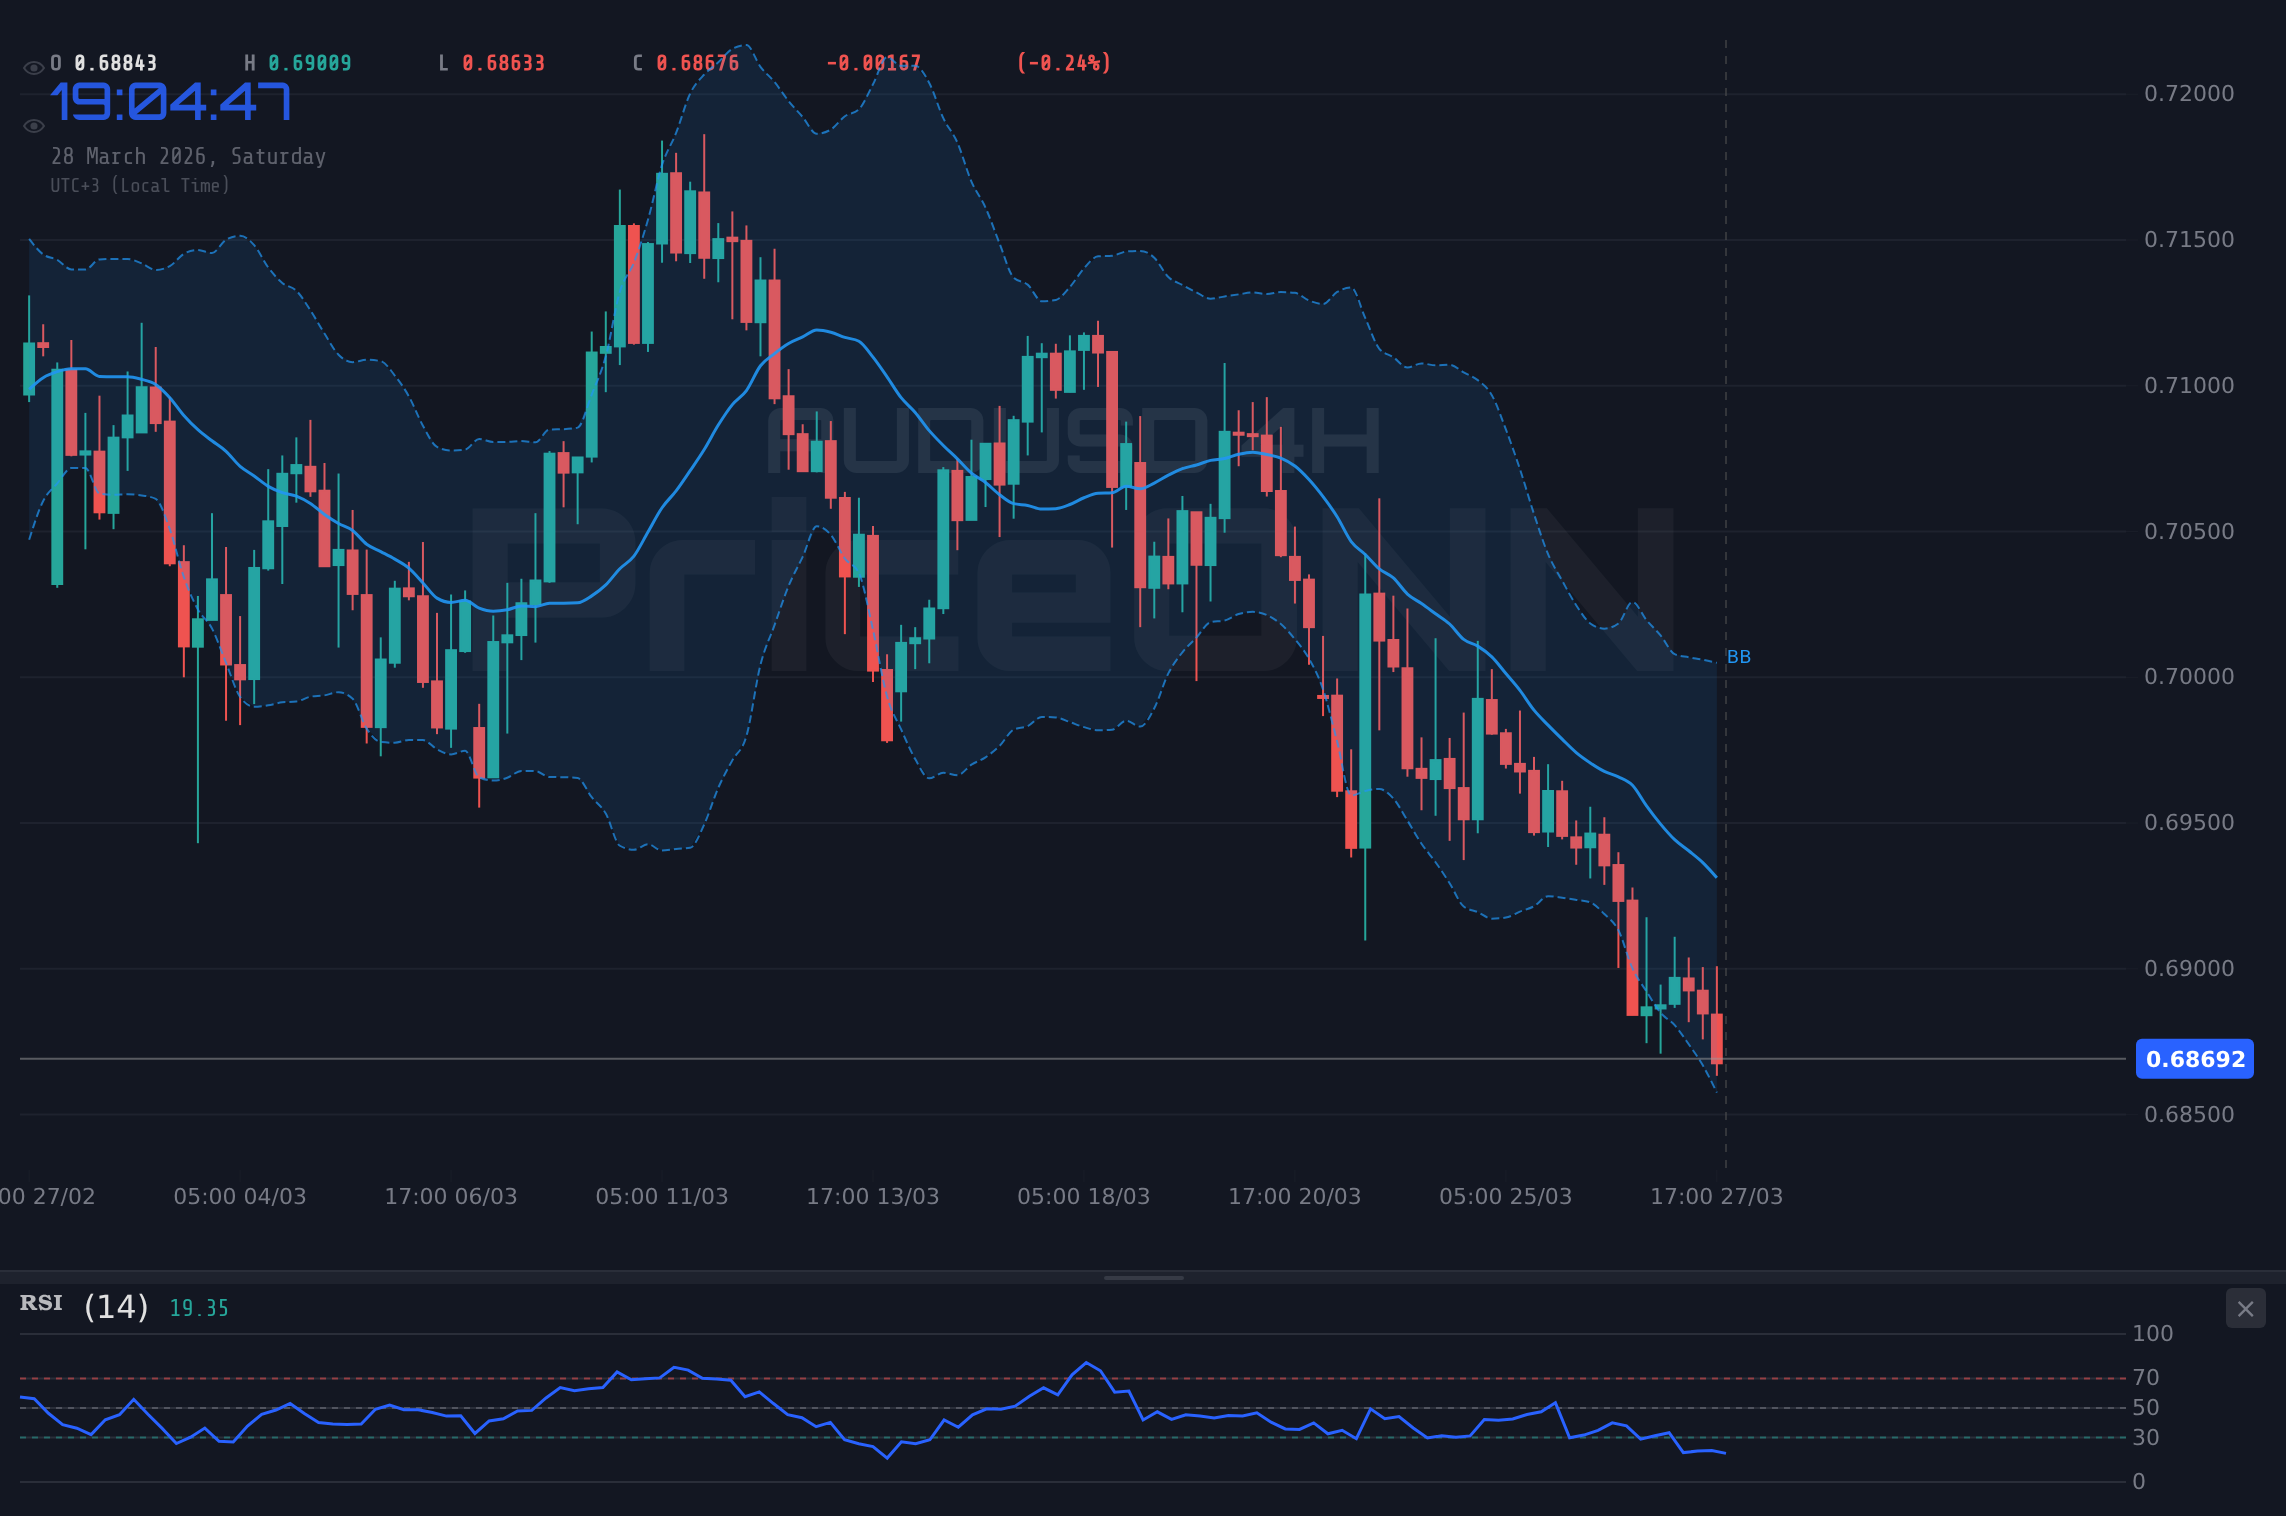
- RSI(14) at 37.44 on the daily chart indicates room for further downside before oversold conditions are met, suggesting caution.
- The strengthening US Dollar Index (DXY), currently at 99.91, continues to exert downward pressure on AUDUSD, reflecting elevated geopolitical risk appetite.
The global financial stage has been dominated by escalating geopolitical tensions, particularly in the Middle East, which have sent shockwaves across commodity markets and amplified demand for safe-haven assets. The dramatic surge in oil prices, with Brent crude futures soaring past $110 and WTI nearing $101, underscores the gravity of the situation. This inflationary pressure, coupled with the US Dollar's robust performance, currently trading at 99.91 and on track for its strongest monthly gain since mid-2025, creates a challenging environment for risk-sensitive currencies like the Australian Dollar. The AUDUSD pair, caught between the commodity strength and the greenback's haven appeal, has been unable to establish a clear directional bias, oscillating around the $0.68761 level. The technical picture, as we will explore, mirrors this indecision, with conflicting signals across different timeframes.
This past week saw significant price action across major markets, with equity indices like the SP500 and Nasdaq 100 experiencing sharp declines, falling by 2% and 2.23% respectively. This risk-off sentiment typically benefits the US Dollar but has been somewhat tempered by the simultaneous surge in oil prices, which also acts as a proxy for inflation and can complicate central bank policy expectations. For AUDUSD, this created a tug-of-war effect. While the Australian Dollar, as a commodity currency, might normally suffer from falling risk appetite, its correlation with gold prices, which have soared above $4,500 due to safe-haven demand, adds another layer of complexity. Understanding these cross-market dynamics is crucial for deciphering the nuanced movements of AUDUSD.
Navigating the Cross-Currents: AUDUSD's Technical Posture
Delving into the technical indicators for AUDUSD reveals a market at a crossroads. On the 1-hour timeframe, the trend is decidedly bearish with strong conviction (86% power), yet the overall signal leans towards a sell (0 buys, 8 sells, 0 neutral). This short-term bearishness is underpinned by an RSI(14) reading of 37.27, which, while indicating room for further downside before hitting oversold territory, isn't yet signaling an immediate capitulation. The MACD histogram shows negative momentum, reinforcing the downward pressure, and the Stochastic Oscillator, with %K at 19.15 and %D at 29.39, is flashing a sell signal as %K < %D, confirming the bearish sentiment on this intraday chart. The ADX at 21.96 suggests a moderately strong downtrend is in play, making the immediate intraday outlook cautious.
Moving to the 4-hour chart, the bearish trend becomes even more pronounced, with an 86% trend power and a general sell signal (2 buys, 6 sells, 0 neutral). The RSI(14) here sits at a more compelling 29.27, firmly in oversold territory. This divergence between the strong bearish trend and the oversold RSI suggests that while the downtrend is dominant, the selling pressure may be exhausting itself in the short to medium term. The MACD remains negative, and the Stochastic Oscillator is deeply oversold with %K at 15.59 and %D at 17.31, continuing the sell signal. The ADX at 24.01 indicates a moderately strong downtrend, but the oversold RSI warrants a closer look for potential reversals or at least a pause in the selling.
On the daily chart, the picture becomes murkier, reflecting the overall neutral drift. The trend is classified as neutral with 50% power, and the general signal is also neutral (1 buy, 7 sells, 0 neutral). The RSI(14) is at 37.44, still showing room to the downside before reaching oversold territory, implying that the prevailing downward momentum has not yet been fully unwound. The MACD histogram is negative, indicating bearish momentum, but its proximity to the signal line suggests a potential stabilization or even a shift. Bollinger Bands are below the middle band, reinforcing the bearish lean, and the Stochastic Oscillator's %K at 8.04 and %D at 25.87 continues to signal a sell. The ADX at 24.76 points to a moderately strong downtrend, but the confluence of these factors on the daily timeframe suggests that while the bears have been in control, significant support levels may be approaching, potentially leading to a period of consolidation or a sharp reversal if key price points hold.
The Battle for Key Levels: Support and Resistance Under Scrutiny
The price action around the $0.68761 mark highlights the significance of the support and resistance levels provided. On the daily chart, the immediate support is identified at $0.68557. This level has been a battleground throughout the week, and its resilience or failure will be a critical determinant of AUDUSD's short-term fate. A decisive break below $0.68557 could open the door for further declines towards the next support at $0.68245, and potentially down to $0.67746 if selling pressure intensifies significantly. These levels represent areas where buying interest has historically emerged, and their effectiveness in stemming the bearish tide will be closely watched.
Conversely, resistance levels present immediate hurdles for any potential upside correction. The first resistance level stands at $0.69368. A sustained move above this point would be the initial sign of a potential trend shift or at least a significant pause in the bearish momentum. Further upside targets are located at $0.69867 and then $0.70179. These resistance zones are crucial for the bulls to overcome if they are to regain control. The fact that the current price of $0.68761 is nestled between these well-defined support and resistance zones underscores the neutral drift and the elevated importance of risk management for traders operating in this pair.
The interplay between these levels and the broader market sentiment, particularly the strength of the US Dollar Index (DXY), is paramount. With DXY currently trading around 99.91 and showing a strong upward trend on the daily chart, it continues to act as a headwind for AUDUSD. A rising DXY often correlates with a weakening AUDUSD, as seen in the pair's recent performance. Therefore, any significant shifts in DXY's trajectory will likely have a direct and pronounced impact on AUDUSD. For instance, a sustained decline in DXY below the 99.76 resistance (now acting as support) could provide the necessary catalyst for AUDUSD to challenge its own resistance levels.
Market Sentiment and Geopolitical Ripples: The Driving Forces
The current market environment is heavily influenced by geopolitical developments, most notably the escalating tensions in the Middle East. The news of Iran asserting control over the Strait of Hormuz and the subsequent surge in gold prices past $4,500 per ounce illustrate the heightened risk aversion. This has naturally fueled demand for the US Dollar as a safe-haven asset, contributing to its strength against currencies like the Australian Dollar. The reported drone strikes by Ukraine threatening Russian oil exports further exacerbate supply chain concerns and inflationary pressures, creating a complex web of factors impacting global markets.
These geopolitical risks have a direct correlation with commodity prices. The sharp rise in Brent and WTI crude oil prices not only impacts inflation expectations but also affects commodity-linked currencies such as the AUD. While higher oil prices can sometimes support the Australian Dollar, the prevailing risk-off sentiment and the strength of the US Dollar often overshadow this positive correlation. The market is currently grappling with the dual narrative of rising commodity-driven inflation and the demand for safe assets, making it difficult for AUDUSD to find a stable footing. The prevailing sentiment appears to be one of caution, with investors prioritizing capital preservation amidst the uncertainty.
Central bank policies also remain a key consideration, although they are currently playing a secondary role to geopolitical events. The Federal Reserve's stance, as reflected in market expectations, continues to influence USD dynamics. While the provided economic calendar data shows a mixed picture of recent US releases, the overarching narrative from major central banks often revolves around managing inflation while navigating economic growth concerns. Any hints of a more hawkish or dovish pivot from the Fed, ECB, or even the RBA, could significantly alter the currency landscape. For AUDUSD, RBA Governor Kent's recent comments, which reportedly bolstered the Australian Dollar at one point, highlight the sensitivity of the pair to local monetary policy signals, even amidst broader global turmoil.
Trading Scenarios and Strategic Outlook for AUDUSD
Bearish Scenario: Testing the Depths
60% ProbabilityNeutral Scenario: Consolidation and Observation
30% ProbabilityBullish Scenario: A Glimmer of Hope?
10% ProbabilityThe prevailing technical setup on the daily chart, with an ADX of 24.76 indicating a moderately strong downtrend despite a neutral trend classification, suggests that the bearish scenario carries the highest probability. However, the oversold conditions on the 4-hour RSI (29.27) cannot be ignored. If the geopolitical tensions begin to de-escalate or if the US Dollar shows signs of weakness, we could see a short-covering rally. Conversely, any further escalation or unexpected negative news from the Middle East could trigger a sharp move lower, breaking the key support at $0.68557. Traders should remain vigilant and prepared for volatility, emphasizing strict risk management protocols, especially given the current market uncertainties.
Key Levels and What They Mean for AUDUSD
The AUDUSD pair is currently trading at $0.68761, a price point that sits precariously between significant technical levels. On the downside, the first level of support is at $0.68557. This is a crucial area; a failure to hold here could signal a continuation of the bearish trend towards $0.68245 and potentially $0.67746. These lower levels represent areas where buyers might step in, driven by oversold conditions or a shift in sentiment, but the prevailing trend suggests they could be breached if momentum continues.
On the upside, resistance is capped initially at $0.69368. A successful breach of this level is necessary for any significant bullish reversal. Beyond this, traders will be watching $0.69867 and $0.70179 as further resistance points. The ability of AUDUSD to decisively break through these levels will depend heavily on external factors, such as the US Dollar's strength and the evolution of geopolitical events. Currently, with the DXY at 99.91, the path of least resistance for AUDUSD appears to be downwards, making these resistance levels challenging targets in the near term.
| Indicator | Value | Signal | Interpretation |
|---|---|---|---|
| RSI (14) Daily | 37.44 | Bearish | Room to downside before oversold; downtrend intact. |
| MACD Daily | -0.0012 | Bearish | Negative momentum continues, but closing in on signal line. |
| Stochastic Daily | K:8.04, D:25.87 | Bearish | Deeply oversold; potential for reversal but trend favors sellers. |
| ADX Daily | 24.76 | Bearish | Moderately strong downtrend confirmed. |
| Bollinger Bands Daily | Below Mid-Band | Bearish | Price action below middle band indicates bearish pressure. |
Frequently Asked Questions: AUDUSD Analysis
What happens if AUDUSD breaks below the $0.68557 support level this week?
A break below $0.68557 on the daily chart would invalidate the current neutral stance and likely confirm a continuation of the bearish trend. The next targets would then be $0.68245 and potentially $0.67746, as the market seeks lower ground amidst prevailing risk aversion and USD strength.
Should I consider buying AUDUSD at current levels around $0.68761 given the oversold RSI on the 4-hour chart?
While the 4-hour RSI at 29.27 suggests oversold conditions, the daily chart still shows room for further downside. A prudent approach would be to wait for confirmation, such as a clear break above $0.69368 resistance or a sustained hold of the $0.68557 support, before initiating any long positions. The probability of a bearish continuation currently outweighs a bullish reversal.
Is the Stochastic Oscillator's sell signal at 8.04 a strong indicator for AUDUSD right now?
The Stochastic Oscillator reading of K=8.04 and D=25.87 on the daily chart certainly signals bearish momentum. However, given the extremely low values, it also hints at potential oversold territory. While it supports the bearish outlook, it's best used in conjunction with other indicators and price action confirmation, especially considering the overall neutral trend classification on the daily timeframe.
How will the ongoing Middle East tensions and rising oil prices affect AUDUSD's outlook next week?
Escalating geopolitical tensions and rising oil prices currently favor the US Dollar as a safe-haven asset, which puts downward pressure on AUDUSD. If these tensions persist or worsen, expect AUDUSD to remain under pressure, potentially testing lower support levels. Conversely, any signs of de-escalation could lead to a risk-on rally, benefiting AUDUSD and pushing it towards resistance levels like $0.69368.
The AUDUSD pair is currently navigating a complex market environment characterized by geopolitical uncertainty, rising commodity prices, and a strengthening US Dollar. The technical indicators present a mixed picture, with short-term bearish signals on intraday charts contrasting with a more neutral, yet still cautious, outlook on the daily timeframe. Key levels at $0.68557 for support and $0.69368 for resistance are critical watchpoints for the coming week. While the prevailing sentiment favors the downside, the oversold conditions on shorter timeframes suggest that any shift in risk appetite or US Dollar weakness could trigger a significant bounce. Traders must remain disciplined, prioritize risk management, and wait for clear directional signals before committing significant capital. The market is cyclical, and while current conditions favor caution, opportunities will arise for those patient enough to wait for the right setup.
Track markets in real-time
AI-powered analysis, technical indicators and real-time price data.
Join Our Telegram Channel
Breaking market news, AI analysis and trading signals instantly.
Join Channel