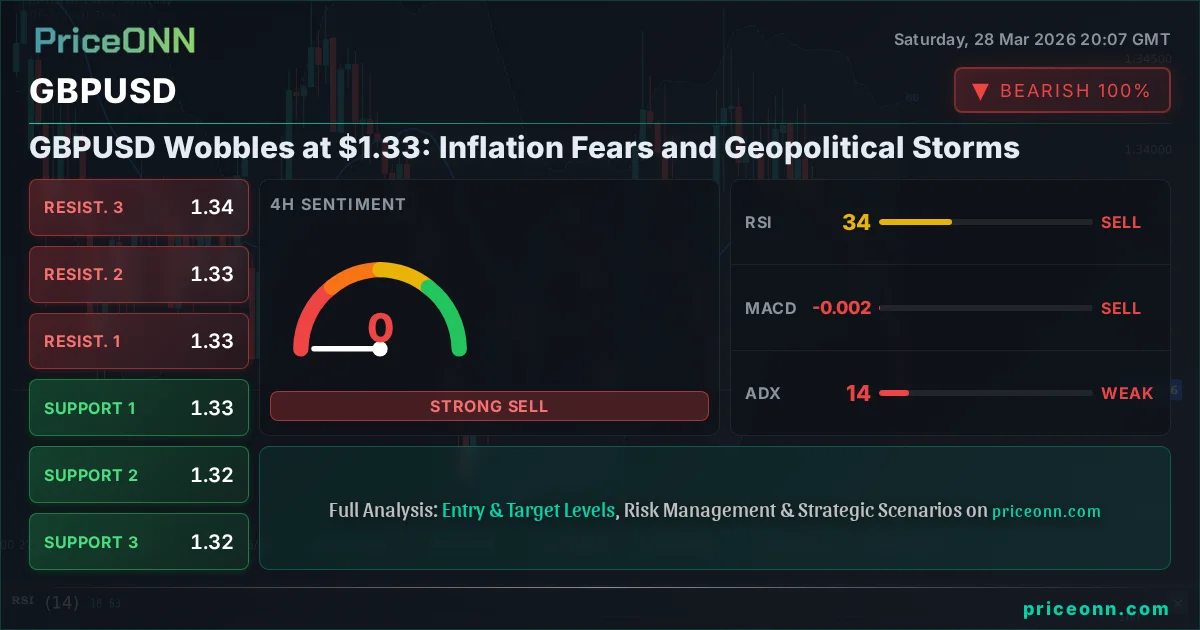
GBPUSD Wobbles at $1.33: Inflation Fears and Geopolitical Storms
GBPUSD struggles near $1.33 as sticky inflation and Middle East tensions create a volatile backdrop. Can Sterling find footing amid global uncertainty?
The British Pound Sterling (GBP) finds itself at a critical juncture, hovering around the $1.33 mark against the US Dollar (USD) as the week draws to a close. This trading range, while seemingly narrow, encapsulates a battleground where conflicting macroeconomic forces and escalating geopolitical risks are locked in a tense standoff. As traders and analysts digest the week's developments, the overarching narrative for GBPUSD revolves around the persistent specter of inflation, the Bank of England's (BoE) policy dilemmas, and the ever-present shadow of global instability. This analysis delves into the intricate dance of these factors, exploring the arguments for both a bearish continuation and a potential bullish reprieve for the pair, ultimately offering a perspective on what lies ahead.
- GBPUSD is currently trading near $1.33, reflecting a tense market balance.
- Sticky inflation data and BoE policy uncertainty weigh on Sterling sentiment.
- Geopolitical tensions, particularly in the Middle East, are bolstering the US Dollar and influencing safe-haven flows.
- Technical indicators present mixed signals, with short-term bearish trends conflicting with longer-term consolidation patterns.
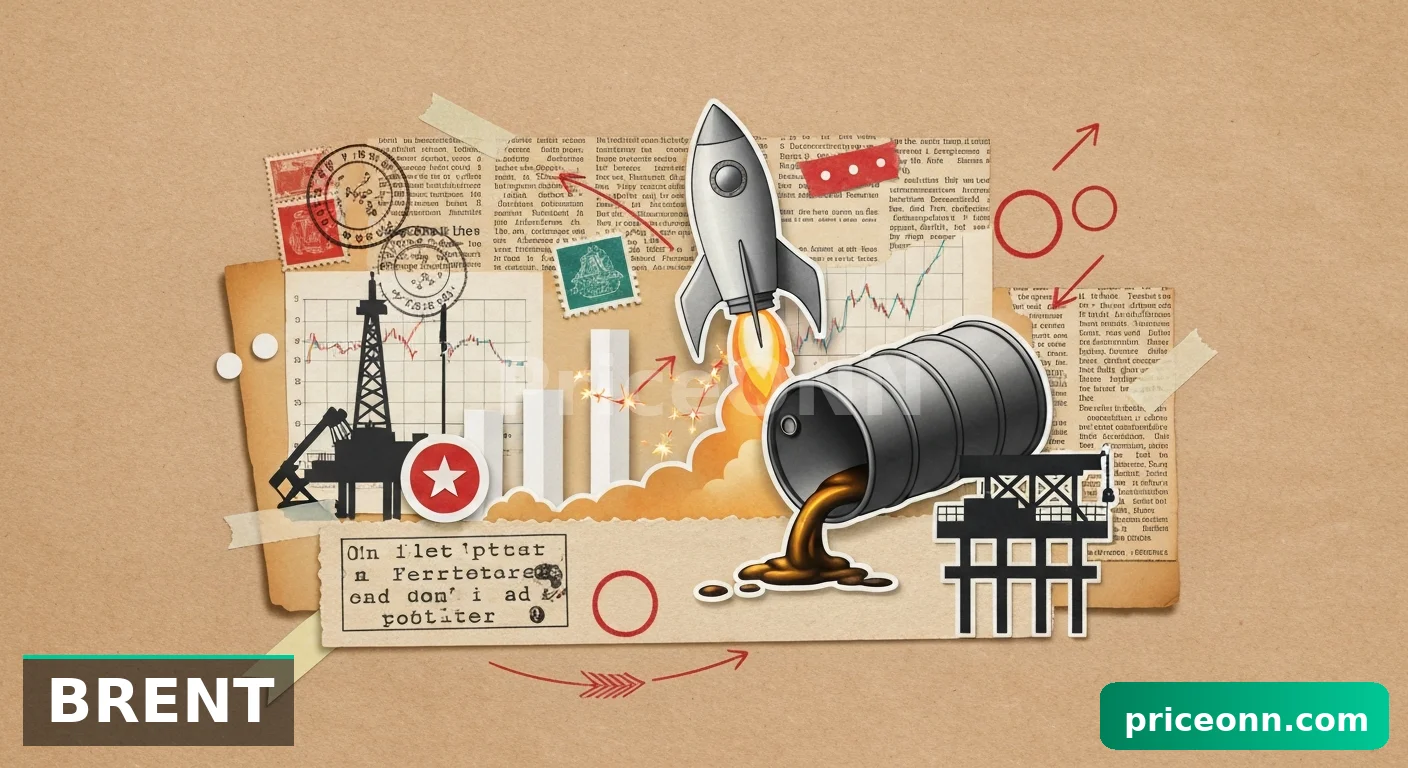
The past week has been a stark reminder of how interconnected global markets have become, and how swiftly sentiment can shift. For GBPUSD, the narrative has been dominated by the looming threat of inflation, both domestically in the UK and globally, amplified by soaring energy prices. The surge in Brent crude futures past $110 and WTI past $101 this week underscores this inflationary pressure, directly impacting transportation costs and consumer spending. This backdrop makes the Bank of England's task increasingly complex; how to manage inflation without choking off economic growth is a tightrope walk that has left many analysts questioning the central bank's next move. The market's interpretation of this dilemma has been a key driver of Sterling's recent performance, with dovish bets on BoE rate cuts gaining traction whenever inflation data or growth figures suggest a softening economy.
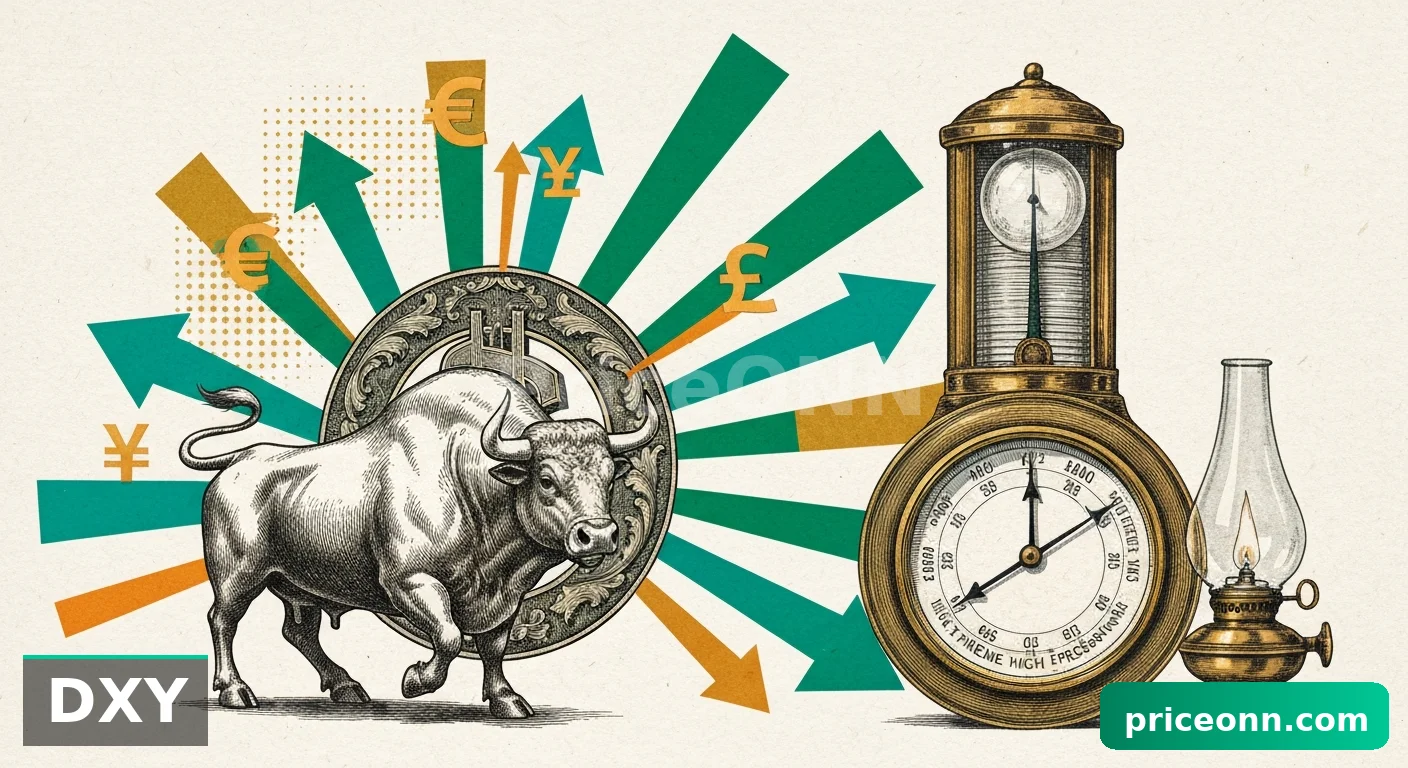
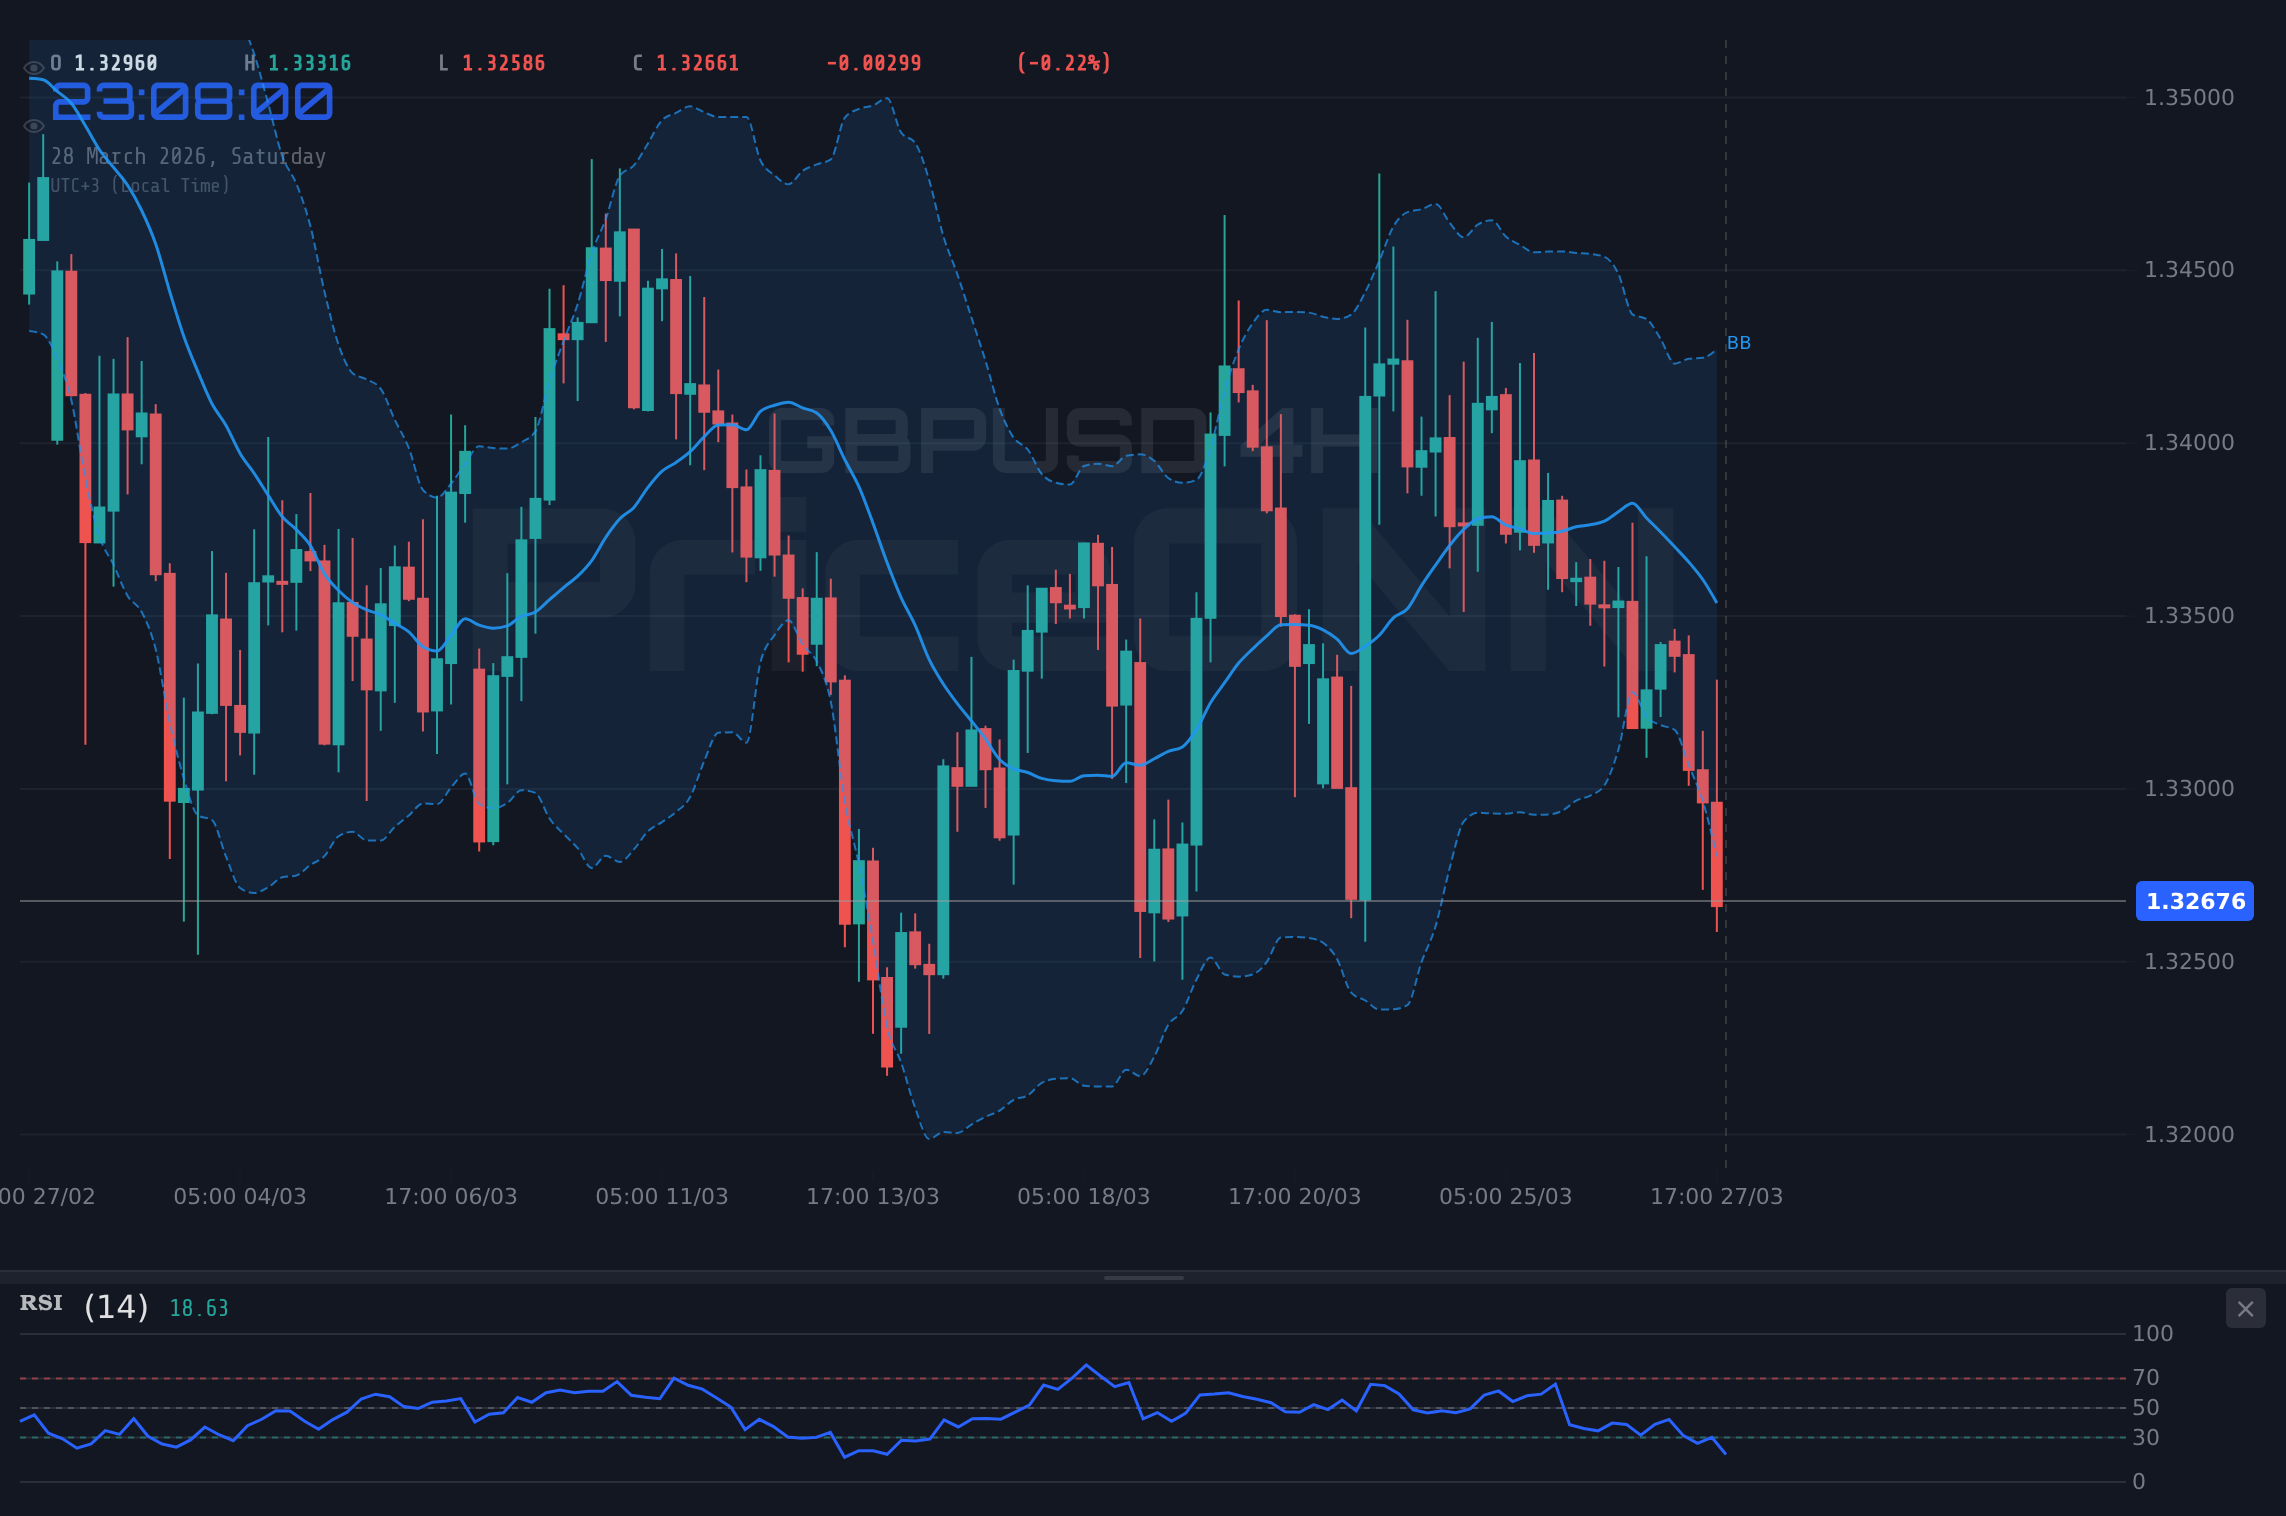
Adding another layer of complexity is the intensifying geopolitical landscape. The escalating tensions in the Middle East have sent shockwaves through energy markets and bolstered demand for the US Dollar as a safe-haven asset. The DXY, or Dollar Index, has seen a notable uptick, trading around 99.79, reflecting this increased demand for dollar-denominated assets. This strength in the dollar inherently puts pressure on currency pairs like GBPUSD, especially when combined with domestic concerns for the UK economy. The price action observed in GBPUSD, with its recent move lower and current trading around the $1.33 level, reflects this confluence of negative pressures. The pair experienced a significant drop from its weekly high of $1.33463, underscoring the market's sensitivity to these global and domestic headwinds.
The Case for Sterling Weakness: Inflationary Headwinds and BoE Uncertainty
The bearish argument for GBPUSD is multi-faceted, rooted in both the immediate economic data and the broader policy outlook. The recent economic calendar, while presenting a mixed picture, has offered enough concerning data points to fuel concerns about the UK's economic trajectory. For instance, the UK's retail sales figures, while showing some resilience, have not provided a strong enough catalyst to significantly alter the narrative of slowing growth. The fact that the previous reading for retail sales was 0.1 and the forecast was for a similar figure, with no new actual data provided, highlights the lack of strong positive impetus. This economic backdrop makes it challenging for the Sterling to find sustained strength, especially when juxtaposed with the market's expectations for monetary policy.
The Bank of England finds itself in a precarious position. While inflation remains stubbornly high, global economic growth is showing signs of fatigue, and the risk of stagflation - a pernicious combination of high inflation and low growth - looms large. This dilemma is reflected in the market's pricing of future interest rate decisions. While the BoE has maintained a hawkish stance in its rhetoric, the market has increasingly priced in the possibility of rate cuts sooner rather than later if economic conditions deteriorate. The absence of specific BoE meeting minutes or MPC member commentary in the provided data means we rely on broader market sentiment, which currently suggests a cautious approach from the central bank, potentially hindering aggressive Sterling appreciation. The GBPUSD's daily trend is predominantly bearish according to the 1D timeframe analysis, with a strong trend power of 90%, indicating that the bears have had the upper hand over the past day. The RSI(14) at 41.23 on the daily chart further suggests a downward bias, indicating room for further declines before reaching oversold territory.
Technically, the bearish case is supported by several indicators across different timeframes. On the 1H chart, GBPUSD shows a clear bearish trend with a power of 83%, supported by a bearish signal from Stochastic (%K < %D) and negative MACD momentum. The RSI(14) at 33.58 on this timeframe further reinforces the downward pressure. The lower Bollinger Band being tested on the 1H and 4H charts, combined with ADX readings suggesting weak to moderate trend strength (16.17 on 1H, 13.78 on 4H), indicates that while the trend is down, the momentum might not be overpowering, potentially leading to consolidation before further moves. However, the prevailing sentiment across multiple timeframes leans towards weakness, with the 1D trend strength at 90% and a strong bearish signal from the ADX at 29.89, indicating a robust downward trend is in play.
The Case for Sterling Strength: A Potential Rebound and Dollar Weakness
Despite the prevailing bearish sentiment, there are arguments to be made for a potential rebound in GBPUSD. One of the primary catalysts for such a move would be a shift in the global risk sentiment or a significant change in the US Dollar's trajectory. The US Dollar Index (DXY), currently trading around 99.79, has shown strength driven by geopolitical fears. However, if these tensions de-escalate or if the market begins to price in a more aggressive stance from other central banks, the dollar's safe-haven appeal could diminish, opening the door for Sterling to regain some ground. The fact that the DXY exhibits a strong daily uptrend (96% power) but only moderate trend strength on the 4H (ADX 19.8) suggests that while the dollar is currently favored, its dominance might not be absolute.
Furthermore, the technical picture, while leaning bearish on lower timeframes, shows pockets of potential support and signals that could precede a reversal. On the 4H chart, the RSI(14) at 33.57 is approaching oversold territory, and the Stochastic indicator shows a potential bullish crossover signal (%K > %D). While the ADX at 13.78 indicates a weak trend, this can sometimes precede a shift in momentum. The fact that the 1D Stochastic shows a potential upward move (%K=35.41, %D=57.4 with %K < %D, suggesting a bearish signal but from a low base) highlights the conflicting signals that often appear at turning points. The daily chart also shows positive momentum from the MACD, even as it remains below the signal line, hinting at a possible shift.
Another factor to consider is the potential for the Bank of England to adopt a more hawkish stance than currently priced in by the market, especially if inflation proves more persistent than anticipated. While the provided economic calendar data is limited for the UK, any future releases indicating higher-than-expected inflation or robust wage growth could force the BoE to signal a longer path of higher interest rates. Such a development would provide a significant tailwind for Sterling. Additionally, the current oversold conditions on some shorter-term charts, like the 4H RSI at 33.57 and Stochastic, could be setting the stage for a technical bounce. If GBPUSD can hold the support level at $1.32723 and subsequently break through the immediate resistance at $1.33183, it could trigger a short-covering rally.
Navigating the $1.33 Price Level: Technical Confluence and Key Levels
The $1.33 price level for GBPUSD is not just a psychological mark; it represents a confluence of technical factors and historical price action. On the 1-hour chart, the immediate support is identified at $1.32627, followed by $1.32562 and $1.32501. These levels have acted as reference points during the week's trading. Conversely, resistance is seen initially at $1.32753, then $1.32814, and further up at $1.32879. These are the battle lines for short-term traders. The fact that the 1-hour chart shows a strong bearish trend (83% power) with an ADX of 16.17 suggests that while the direction is down, the trend is not exceptionally strong, leaving room for volatility and potential reversals.
Looking at the 4-hour timeframe, the key support levels are $1.32723, $1.32486, and $1.32263. These are more significant as they reflect a broader market sentiment over a few trading sessions. Resistance levels on this timeframe are $1.33183, $1.33406, and $1.33643. The 4-hour chart paints a picture of a strong bearish trend (92% power) with a low ADX (13.78), indicating a range-bound or consolidating market within a downtrend. This is where the conflicting Stochastic signal (oversold conditions potentially reversing) becomes crucial. A sustained break above $1.33183, especially with increasing volume, would be the first sign that the bearish momentum is waning.
On the daily chart, the picture becomes more complex. The primary support is located at $1.32993, followed by $1.32702 and $1.32313. Resistance is faced at $1.33673, $1.34062, and $1.34353. The daily trend is strongly bearish (90% power) with a significant ADX of 29.89, confirming a strong trend. However, the daily MACD shows positive momentum, and the Stochastic indicator, while currently bearish (%K < %D), is coming from oversold levels. This divergence between the trend strength and the momentum indicators suggests that while the downtrend has been dominant, there might be underlying forces preparing for a potential shift, or at least a period of consolidation around these key levels.
The current price of $1.33 sits precariously between these short-term resistance levels and more significant daily support. A break below $1.32702 could accelerate the decline towards $1.32313, especially if the DXY continues its ascent or if negative news emerges from the UK. Conversely, a hold above $1.33 and a subsequent push above $1.33183 could signal the beginning of a short-covering rally, potentially testing the $1.33673 resistance level. The interplay between the strong daily downtrend and the mixed signals on lower timeframes, coupled with the overarching macroeconomic and geopolitical narratives, makes this a pivotal moment for GBPUSD.
The Week Ahead: Key Events and Levels to Watch
Looking ahead, the GBPUSD pair will be heavily influenced by incoming economic data and evolving geopolitical narratives. The economic calendar for the upcoming week is packed with high-impact events that could significantly sway market sentiment. Key among these will be any further inflation data releases from the UK, which will be crucial for shaping expectations around the Bank of England's future policy path. The market's current pricing of BoE rate cuts suggests that Sterling remains vulnerable to any data that reinforces a dovish outlook. Conversely, any signs of stubborn inflation could lead to a reassessment, potentially supporting the Pound.
On the US side, continued focus will be on the Federal Reserve's stance regarding inflation and interest rates. While no immediate FOMC meeting is scheduled, commentary from Fed officials and the pricing in of future rate moves will remain critical. The strength of the US Dollar, currently supported by geopolitical fears, will be a key barometer. Any de-escalation in the Middle East or a shift in Fed rhetoric could lead to a pullback in the DXY, offering a potential reprieve for GBPUSD. Traders will be closely watching the $1.33 level as a pivot point. A sustained break below it could open the door for further downside towards $1.32702 and $1.32313. On the upside, a decisive move above $1.33183, followed by a clear break of the $1.33673 resistance, would be necessary to negate the near-term bearish bias and signal a potential move towards higher levels.
The correlation with broader market sentiment will also be paramount. A continued risk-off environment, driven by geopolitical instability or fears of global stagflation, would likely favor the US Dollar and weigh on GBPUSD. Conversely, a return of risk appetite, perhaps spurred by positive economic surprises or de-escalating tensions, could see Sterling benefit. The technical picture on the daily chart, despite its bearish leanings, shows potential for a bounce from oversold conditions on oscillators like the Stochastic. Confirmation would be needed, ideally through a break of immediate resistance levels and a shift in momentum indicators, to signal a more sustainable recovery. Until then, traders should remain cautious, managing risk carefully around the critical $1.33 price point.
Frequently Asked Questions: GBPUSD Analysis
What happens if GBPUSD breaks below the $1.32702 support level this week?
A break below $1.32702 would likely accelerate the bearish momentum, potentially targeting the next key support at $1.32313. This scenario would be reinforced if geopolitical tensions escalate further, strengthening the US Dollar and increasing risk aversion.
Is the RSI at 41.23 on the daily chart a sell signal for GBPUSD right now?
An RSI of 41.23 indicates a bearish bias but is not yet in oversold territory. While it suggests downward pressure, it doesn't necessarily signal an immediate sell. Confirmation would be needed from price action breaking key support levels, such as $1.32702.
How will upcoming UK inflation data affect GBPUSD sentiment?
Higher-than-expected UK inflation could bolster Sterling by signaling a more hawkish stance from the BoE, potentially pushing GBPUSD higher. Conversely, softer inflation would likely reinforce bearish sentiment and support a move lower.
Should traders consider buying GBPUSD at current levels around $1.33 given the mixed signals?
Buying at $1.33 requires careful risk management. While some indicators hint at a potential bounce from oversold conditions on lower timeframes, the dominant daily downtrend suggests caution. A confirmed break above $1.33183 resistance would offer a more convincing bullish setup.
Bearish Scenario: Downside Pressure Mounts
65% ProbabilityNeutral Scenario: Consolidation Around $1.33
25% ProbabilityBullish Scenario: Sterling Rebound Potential
10% ProbabilityTrack markets in real-time
AI-powered analysis, technical indicators and real-time price data.
Join Our Telegram Channel
Breaking market news, AI analysis and trading signals instantly.
Join Channel