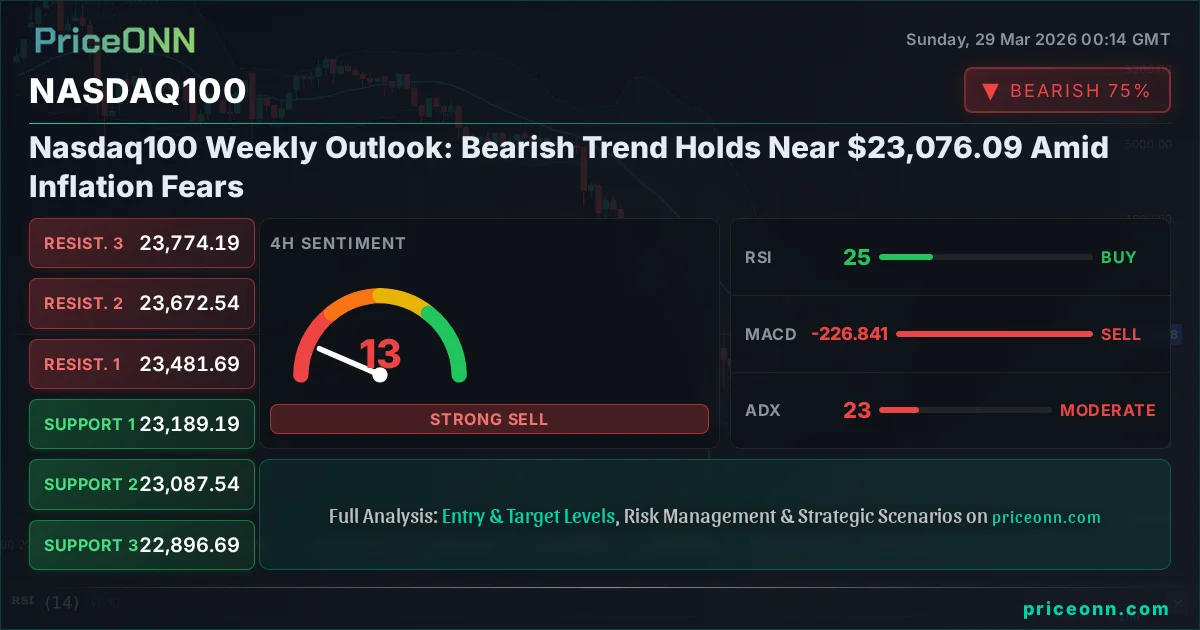
Nasdaq100 Weekly Outlook: Bearish Trend Holds Near $23,076.09 Amid Inflation Fears
Nasdaq100 analysis shows a persistent bearish trend, trading near $23,076.09. Key levels to watch as inflation fears and DXY strength pressure the index.
The financial markets are at a fascinating crossroads, with a potent mix of geopolitical tensions and persistent inflation concerns dictating the narrative. This week, our focus sharpens on the Nasdaq100, which finds itself navigating a challenging technical landscape near the $23,076.09 mark. The persistent bearish trend, underscored by a confluence of technical indicators and macro-economic pressures, suggests that the path of least resistance may continue to be downwards. However, as any seasoned trader knows, market dynamics are rarely straightforward. Understanding the interplay between rising oil prices, a strengthening dollar index (DXY), and the broader risk sentiment is crucial for deciphering the Nasdaq100's immediate future. We'll delve into the specific technical signals, explore the correlation with key global markets, and assess the critical levels that traders must monitor in the coming week. This analysis aims to provide a clear, data-driven perspective, helping you navigate these volatile times with greater confidence.
- With RSI at 19.98 on the 1-hour chart, the Nasdaq100 is showing extreme oversold conditions, signaling potential for a short-term bounce but not yet a trend reversal.
- Critical support for the Nasdaq100 is currently situated at $23,061.21, a level that has shown some resilience but remains vulnerable in the face of sustained selling pressure.
- The MACD histogram on the 4-hour chart indicates negative momentum is still dominant, suggesting that downward pressure is likely to persist despite oversold readings.
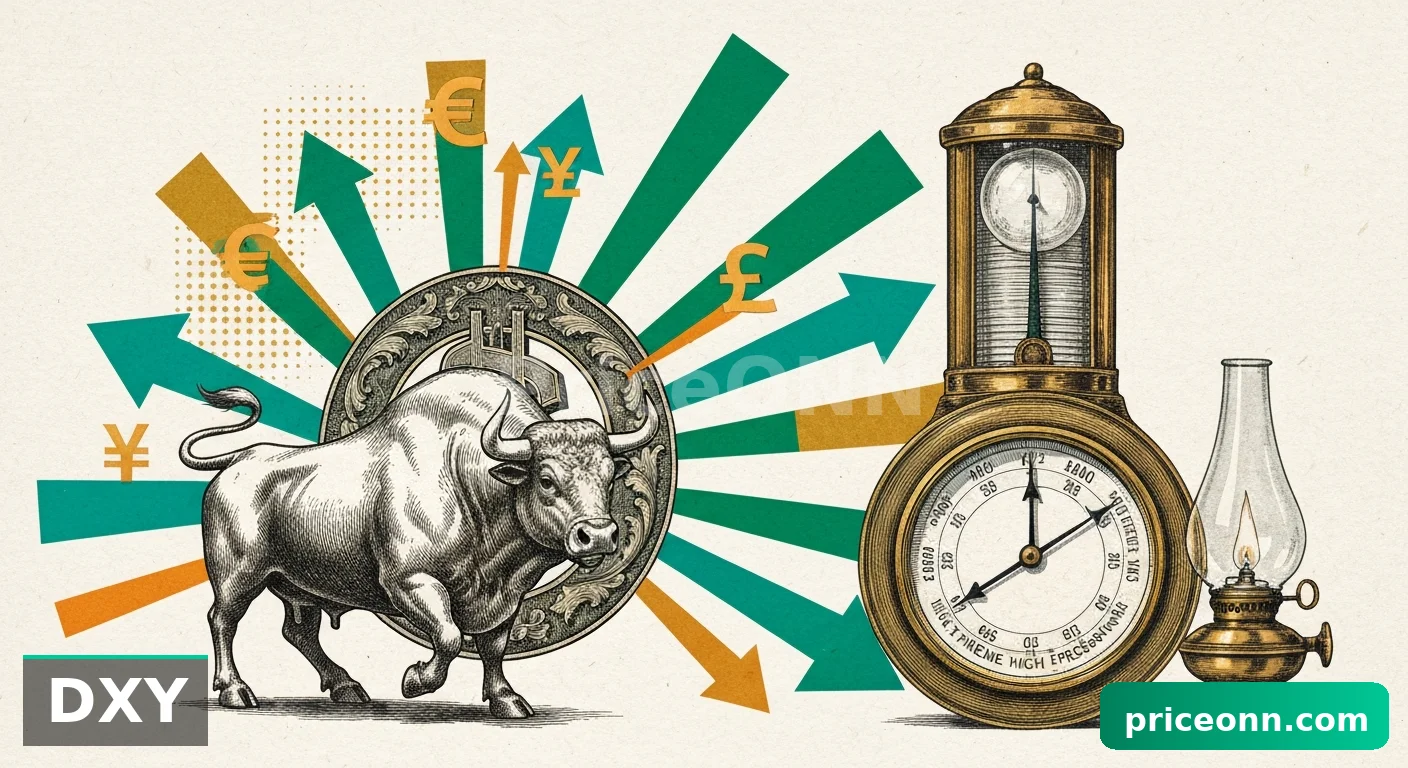
- The correlation with a strengthening DXY at 99.79 reinforces the bearish outlook for risk assets like the Nasdaq100, as a stronger dollar typically weighs on equities.
The Macroeconomic Crosscurrents Pressuring the Nasdaq100
Inflationary Headwinds and Central Bank Dilemmas
The specter of inflation continues to loom large over global financial markets, creating a complex environment for equities, particularly growth-oriented indices like the Nasdaq100. This past week saw renewed concerns about sticky inflation, fueled in part by a significant surge in oil prices. Brent crude futures, for instance, have experienced a remarkable rally, climbing by over 50% this month. This surge is not merely a statistical anomaly; it's a direct consequence of escalating geopolitical tensions in the Middle East and ongoing supply-side constraints. As oil prices climb, they exert upward pressure on inflation expectations across the board. This creates a challenging dilemma for central banks, especially the Federal Reserve. On one hand, they aim to curb inflation; on the other, they must consider the impact of higher energy costs on economic growth and employment. The current data, with a preliminary USD Non-Farm Payrolls figure of 210 against a forecast of 211, suggests the labor market remains robust but perhaps losing a touch of steam. However, any sign of inflation re-accelerating could force policymakers into a more hawkish stance, potentially leading to higher interest rates for longer. This macroeconomic backdrop is inherently bearish for growth stocks, as higher rates increase the discount rate applied to future earnings, thereby reducing their present value.
The correlation between rising oil prices and the Nasdaq100's performance is a critical one to monitor. When energy costs spike, businesses face higher operating expenses, which can squeeze profit margins. For technology companies, which often operate on thinner margins or rely heavily on consumer spending, this can be particularly damaging. Furthermore, sustained high inflation erodes consumer purchasing power, potentially leading to reduced demand for goods and services, including those offered by tech giants. Investors often react to these inflationary signals by rotating out of growth assets and into perceived safe havens or inflation-protected assets. This sentiment shift directly impacts the Nasdaq100, as it is heavily weighted towards companies whose valuations are sensitive to interest rate expectations and future earnings growth. The Fed's balancing act becomes even more precarious if inflation proves more persistent than anticipated. While the latest employment figures were largely in line with expectations, the underlying inflationary pressures from energy and other commodities create a persistent threat. This forces market participants to constantly reassess the probability of future rate hikes versus potential rate cuts, leading to increased volatility across all asset classes.
The interconnectedness of the global economy means that inflationary pressures are not confined to a single region. The geopolitical instability in the Middle East, as highlighted by news reports suggesting the potential for energy rationing, adds a layer of uncertainty that permeates global markets. This instability not only drives up oil prices but also fuels broader risk aversion. When geopolitical risks escalate, investors tend to seek refuge in assets perceived as safer, such as the US Dollar (DXY) or government bonds. This flight to safety often comes at the expense of riskier assets like equities. The Dollar Index (DXY) is currently trading at 99.79, and its strengthening trend is a significant headwind for companies in the Nasdaq100. A stronger dollar makes US exports more expensive and can reduce the repatriated earnings of multinational corporations, many of which are listed on the Nasdaq. Therefore, the current macro environment, characterized by elevated energy prices, potential stagflationary risks, and a strengthening dollar, paints a challenging picture for the Nasdaq100.
Geopolitical Tensions and Their Market Ripples
The global geopolitical landscape remains a significant source of market uncertainty, directly influencing investor sentiment and asset prices. The ongoing conflicts and tensions, particularly in the Middle East, are not just abstract headlines; they translate into tangible economic consequences. The surge in oil prices, a direct fallout from these geopolitical hotspots, is a prime example. As reported by various news outlets, the potential for energy rationing is a growing concern, prompting international bodies like the IEA to monitor the situation closely. This heightened risk environment naturally impacts market sentiment, often leading to a 'risk-off' appetite among investors. When fear takes hold, capital tends to flow away from speculative assets and towards perceived safe havens. This dynamic is particularly detrimental to growth-oriented indices like the Nasdaq100, which are often seen as barometer of market risk appetite.
This flight to safety often manifests as increased demand for the US Dollar. The DXY, currently trading around 99.79, has shown a tendency to strengthen amidst global uncertainty. A rising dollar, as previously discussed, creates headwinds for US equities by making exports more expensive and impacting the earnings of multinational corporations. Moreover, a stronger dollar can also put pressure on emerging markets, potentially leading to broader capital outflows and further dampening global growth prospects. The correlation between geopolitical risk and dollar strength is a well-established phenomenon, and its current manifestation is a key factor weighing on the Nasdaq100. Investors are closely watching developments in regions like the Middle East, as any further escalation could trigger significant market volatility.
Beyond energy prices, geopolitical developments can also influence other aspects of the global economy. Supply chain disruptions, which have been a persistent issue since the pandemic, can be exacerbated by geopolitical conflicts. These disruptions can lead to shortages of critical components, increased production costs, and ultimately, higher prices for consumers. For the technology sector, which relies heavily on complex global supply chains for everything from semiconductors to finished goods, these disruptions can significantly impact business operations and profitability. The interplay between geopolitical events, energy prices, currency strength, and supply chain dynamics creates a complex web of factors that investors must navigate. In this environment, the Nasdaq100, with its high concentration of growth and technology companies, remains particularly vulnerable to shifts in global risk sentiment and macroeconomic stability.
Technical Analysis: Decoding the Nasdaq100's Chart Patterns
Short-Term Signals: A Glimmer of Oversold Conditions?
Turning our attention to the technical picture, the Nasdaq100's chart presents a complex narrative, with short-term indicators flashing signals that warrant attention, albeit with significant caveats. On the 1-hour timeframe, the Relative Strength Index (RSI) stands at 19.98. This reading is deep within oversold territory, historically suggesting that the asset may be due for a bounce. This technical condition, combined with the MACD showing positive momentum and trading above its signal line, might tempt some traders to look for a short-term buying opportunity. The Stochastic Oscillator, with %K at 1.54 and %D at 8.54, also confirms this oversold state, indicating that the downward momentum may be exhausting itself in the very short term. However, it's crucial to temper this optimism with caution. The ADX on the 1-hour chart is at 32.68, indicating a strong downtrend is in play. An oversold RSI in the context of a strong downtrend does not necessarily signal a reversal; it can simply mean that the price has fallen too far, too fast, and a temporary pause or shallow retracement is possible before the downtrend resumes.
The Bollinger Bands on the 1-hour chart are currently situated below the middle band, reinforcing the bearish sentiment. While the price has touched the lower band, suggesting a potential bounce, the overall trend direction indicated by the ADX remains a significant factor. The general signal across multiple 1-hour indicators leans towards a 'SELL' (Al: 2, Sat: 6, Nötr: 0), highlighting the prevailing bearish sentiment despite the oversold readings. This divergence between short-term oversold indicators and the overwhelming trend strength is a classic characteristic of a strong downtrend. It suggests that any upward moves are likely to be corrective in nature rather than signaling a genuine trend reversal. For short-term traders, this might present an opportunity for scalping bounces, but it requires precise entry and exit timing, as well as strict risk management. The key level to watch on the upside in this short-term context would be the middle Bollinger Band, which is currently acting as resistance, and the immediate resistance level at $23,261.13.
The 4-hour timeframe presents a slightly different, though still predominantly bearish, perspective. The RSI here is at 26.78, still deep in oversold territory, but less extreme than on the 1-hour chart. The MACD continues to show negative momentum, with the histogram below the zero line and the MACD line below the signal line, confirming the bearish bias. The Stochastic Oscillator (%K: 2.51, %D: 14.09) also remains deeply oversold, reinforcing the idea that the selling pressure might be nearing a temporary exhaustion point. However, the ADX at 22.38 still indicates a moderate downtrend. The Bollinger Bands are again below the middle band, and the price is hugging the lower band. The general signal on the 4-hour chart is also a 'SELL' (Al: 2, Sat: 6, Nötr: 0). This consistency across timeframes suggests that while a short-term bounce is possible, the broader technical picture remains firmly in favor of the bears. The ability of the price to reclaim the middle Bollinger Band and subsequently the $23,189.19 resistance level would be the first signs of a potential shift, but until then, caution is advised.
The Daily Chart: A Strong Bearish Trend Confirmed
The daily chart provides the most compelling evidence for the prevailing bearish trend in the Nasdaq100. The current price of $23,076.09 is well below key moving averages, and the technical indicators paint a clear picture. The RSI(14) is sitting at 26.67, firmly entrenched in oversold territory. This has been the case for some time, indicating sustained selling pressure. Historically, readings this low on the daily chart can precede significant bounces, but in a strong downtrend, they can persist for extended periods. The MACD is deeply negative, with the MACD line significantly below the signal line and the histogram showing strong bearish momentum. This suggests that the downward trend has considerable force behind it. The Stochastic Oscillator, while showing %K (22.61) above %D (30.54), is still in oversold territory and trending downwards, indicating that further downside is possible before any meaningful recovery.
The ADX on the daily chart stands at a robust 47.68. This is a very strong reading, indicating a powerful and established trend. When the ADX is this high, it signifies that the market is not range-bound but is moving decisively in one direction. Combined with the fact that the primary trend direction indicated by the MACD and RSI is downwards, this ADX reading confirms a strong bearish trend. The Bollinger Bands are wide, and the price is consistently trading below the middle band, often touching or breaking the lower band. This pattern is characteristic of a strong downtrend, where price action is predominantly negative. The general signal on the daily chart is a strong 'SELL' (Al: 1, Sat: 6, Nötr: 0). This confluence of indicators on the daily timeframe strongly suggests that the path of least resistance is downwards. Any potential bounces are likely to be viewed as opportunities for further selling by market participants until key resistance levels are decisively broken and sustained.
The critical support level to watch on the daily chart is currently around $23,093.23 (based on S1 calculation). A decisive break below this level would signal further downside potential, with the next significant support at $22,736.12. On the resistance side, the middle Bollinger Band, currently around $23,384.39, acts as an immediate hurdle. A sustained move above this level would be the first indication that the bearish momentum might be waning. However, given the strength of the ADX and the persistent negative MACD, breaking through these resistance levels would require significant buying pressure, likely triggered by a fundamental shift in market sentiment or a major change in central bank policy expectations. For now, the technical data points towards continued weakness, with any rallies likely to be met with selling pressure.
Intermarket Analysis: The Dollar, Oil, and Risk Sentiment's Impact
DXY Strength and its Inverse Correlation with Nasdaq100
The Dollar Index (DXY) is a critical barometer for global liquidity and risk sentiment, and its current trajectory has significant implications for the Nasdaq100. Trading at 99.79, the DXY is exhibiting a strengthening trend, particularly evident on the 4-hour and daily charts, supported by an ADX of 19.8 and 31.93 respectively. This upward movement in the dollar index is often inversely correlated with risk assets like the Nasdaq100. When the dollar strengthens, it typically signifies increased demand for safe-haven assets, a reduced appetite for risk, and potentially tighter global financial conditions. For US-based technology companies listed on the Nasdaq, a stronger dollar can also negatively impact their international earnings when repatriated. This inverse relationship means that as the DXY pushes higher, the Nasdaq100 often faces headwinds.
The strength in the DXY can be attributed to several factors currently at play in the market. The ongoing geopolitical tensions, particularly in the Middle East, contribute to a global demand for perceived safe-haven assets. Additionally, if inflation concerns persist and lead to expectations of higher-for-longer interest rates from the Federal Reserve, this would also support dollar strength. The RSI on the DXY's 4-hour chart is at 64.9, indicating a healthy upward momentum without being excessively overbought, suggesting room for further appreciation. On the daily chart, the RSI is at 60.77, also showing a solid uptrend. This continued strength in the dollar reinforces the bearish outlook for the Nasdaq100, suggesting that the downward pressure on equities is likely to persist as long as the dollar remains in demand. Traders are closely watching the DXY's ability to break through the 100.00 psychological level, which, if sustained, could further exacerbate the selling pressure on risk assets.
The correlation between the DXY and the Nasdaq100 is not always perfect, but it serves as a vital piece of the puzzle. When the DXY is rising sharply, it often signals a 'risk-off' environment, where investors shed riskier assets like tech stocks in favor of perceived safety. This dynamic is currently playing out, with the Nasdaq100 showing significant weakness while the DXY strengthens. The question for traders is how long this trend will continue and what catalysts could shift this correlation. A significant change in Fed policy expectations, a de-escalation of geopolitical tensions, or a sharp downturn in US economic data could potentially weaken the dollar and provide some relief to the Nasdaq100. However, based on the current technical and fundamental data, the dollar's strength remains a significant headwind.
Oil Prices and Inflationary Impact on Equities
The dramatic surge in oil prices, with Brent crude futures climbing over 50% this month, is a major driver of current market sentiment and a significant concern for the Nasdaq100. This rise in energy costs has a multi-faceted impact. Firstly, it directly contributes to inflationary pressures. As highlighted in the economic calendar, while the latest US jobs data was somewhat mixed, the underlying trend of rising energy prices fuels broader inflation concerns. This can lead to expectations of tighter monetary policy from central banks, which is generally bearish for equities, especially growth stocks. Secondly, higher oil prices increase operating costs for businesses across various sectors, including the technology companies that dominate the Nasdaq100. This can squeeze profit margins and lead to downward revisions in earnings expectations. Thirdly, elevated energy prices can reduce consumer discretionary spending, impacting demand for goods and services, which affects corporate revenues.
The current price of Brent crude at $110.33, with a significant 6.48% daily gain, underscores the urgency of this inflationary pressure. The 1-hour and 4-hour charts for Brent show strong bullish momentum, with RSI readings in the 70s and 80s, indicating an overheated market but a strong trend. The daily chart for Brent shows an ADX of 62.63, confirming a very strong uptrend. This sustained rise in oil prices creates a challenging environment for the Nasdaq100. While some companies in the energy sector might benefit, the broader impact on inflation, consumer spending, and corporate costs is largely negative for the tech-heavy index. The correlation is clear: as oil prices surge, the risk of stagflation increases, putting pressure on equity valuations. The market is essentially pricing in a scenario where inflation remains stubbornly high, forcing central banks to maintain a restrictive policy stance, which is detrimental to growth stocks.
Furthermore, the geopolitical backdrop fueling the oil price surge adds another layer of complexity. News reports about potential energy rationing and Middle East conflicts create uncertainty and can lead to bouts of risk aversion in financial markets. This can trigger a flight to safety, further strengthening the DXY and weakening assets like the Nasdaq100. The current market environment is a perfect storm for growth stocks: high energy prices feeding inflation, a strong dollar acting as a headwind, and geopolitical risks suppressing risk appetite. This confluence of factors makes it difficult for the Nasdaq100 to find sustainable upward momentum. Traders are looking for signs of de-escalation in geopolitical tensions or a clear signal from the Fed that inflation is under control before considering a significant shift in sentiment towards risk assets.
Trading Scenarios for the Nasdaq100
Bearish Scenario: Trend Continuation Below Key Support
65% ProbabilityNeutral Scenario: Consolidation and Range-Bound Trading
25% ProbabilityBullish Scenario: Short-Term Oversold Bounce
10% ProbabilityKey Levels and What They Mean for Traders
Support Levels: The Last Line of Defense
The Nasdaq100 is currently teetering near significant support levels, and their ability to hold will be paramount in determining the near-term direction. The immediate support, S1, is located at $23,061.21. This is a critical psychological and technical level that has shown some resilience in the recent past. A failure to hold this level could trigger a cascade of selling, as stop-loss orders are likely to be triggered, pushing the price towards the next support level, S2, at $22,736.12. This level represents a more substantial area of potential buying interest, having acted as a floor during previous market consolidations. If even this level gives way, the bears could gain further momentum, targeting S3 at $22,300.00, a level that would signal a significant downturn and a potential test of broader market lows.
The strength of these support levels is intrinsically linked to the overall market sentiment and the prevailing trend. In a strong downtrend, as indicated by the daily ADX of 47.68, support levels often act as temporary pauses rather than firm floors. Buyers may step in to take advantage of oversold conditions, leading to short-lived bounces. However, if the fundamental macro pressures - such as persistent inflation, a strong dollar, and geopolitical uncertainty - remain in play, these bounces are likely to be sold into. For traders looking to enter long positions, waiting for clear signs of capitulation or a confirmed reversal pattern at these support levels would be prudent. Relying solely on a price reaching a support level without confirming buying pressure or a change in trend indicators can be a costly mistake. The key is to observe how price reacts *at* these levels, not just that it *reaches* them.
Resistance Levels: Hurdles for a Potential Recovery
On the upside, the Nasdaq100 faces several resistance levels that must be overcome for any sustainable recovery to take hold. The first significant hurdle is the $23,189.19 level, which is currently acting as a near-term resistance point. More importantly, the middle Bollinger Band on the daily chart, hovering around $23,384.39, represents a key area where selling pressure has historically emerged. Breaking above this level would be a crucial step for the bulls, suggesting that the bearish momentum might be starting to falter. Further up, the $23,481.69 mark acts as a more substantial resistance. This level, along with the upper Bollinger Band on the daily chart, needs to be decisively breached and held to signal a potential shift in trend. A sustained move above $23,481.69 could open the door for a move towards the $23,672.54 resistance.
The current technical indicators, particularly the daily MACD and RSI, do not strongly support a bullish breakout scenario in the immediate future. The negative MACD momentum and the oversold RSI readings, while indicating potential for short-term bounces, do not negate the prevailing downtrend. For a bullish scenario to gain traction, we would need to see a clear confluence of factors: a decisive break above key resistance levels, increasing trading volume, a weakening of the DXY, and perhaps a shift in inflation expectations or central bank rhetoric. Without these catalysts, any upward movement is likely to be viewed with skepticism by the market, and traders may look to fade these rallies, selling into strength as resistance levels are tested. The $23,076.09 current price is critically positioned between immediate resistance and support, making the next few trading sessions pivotal in determining the short-to-medium term direction.
The Week Ahead: What to Watch for the Nasdaq100
Economic Calendar and Potential Catalysts
Looking ahead, the economic calendar will be crucial in shaping the Nasdaq100's trajectory. While this past week saw the release of mixed employment data, the upcoming week holds several high-impact events that could significantly influence market sentiment. The focus will remain on inflation indicators and central bank commentary. Any data releases that suggest inflation is proving more stubborn than expected could reinforce the bearish case for equities, as it would imply a higher-for-longer interest rate environment. Conversely, signs of cooling inflation could provide some relief, potentially leading to a short-term rally in risk assets. The market will be particularly sensitive to any forward guidance from the Federal Reserve regarding its monetary policy stance. Fed officials' speeches and minutes from previous meetings are closely scrutinized for clues about future rate decisions.
The ongoing geopolitical situation will continue to be a background factor, with any escalations likely to trigger risk aversion and benefit safe-haven assets like the dollar, thereby pressuring the Nasdaq100. The surge in oil prices, driven by these geopolitical concerns, remains a key inflation driver. Traders will be watching closely for any developments that could stabilize or further increase energy costs. In the absence of clear positive catalysts, the prevailing bearish trend, supported by technical indicators and macro headwinds, is likely to continue. The Nasdaq100's ability to hold above the $23,061.21 support level will be the immediate test. A break below this could open the door to further declines, while a sustained move above the $23,261.13 resistance might signal a temporary reprieve.
For investors and traders, the key is to remain disciplined and patient. The current market environment is characterized by high volatility and uncertainty. It's essential to manage risk effectively, avoid chasing excessively volatile moves, and wait for clear setups that align with your trading strategy. The Nasdaq100's current price of $23,076.09 places it at a critical juncture. While oversold conditions on shorter timeframes might suggest a bounce, the dominant daily trend remains bearish. Therefore, a cautious approach is warranted, focusing on risk management and waiting for clearer signals before committing to significant positions. The interplay of inflation data, Fed policy expectations, and geopolitical developments will be the primary drivers to monitor in the coming week.
What happens if the Nasdaq100 breaks below the $23,061.21 support level?
A decisive break below $23,061.21 on a daily closing basis would invalidate the immediate consolidation scenario and reinforce the bearish trend. This could trigger further selling pressure, potentially leading to a test of the $22,736.12 support level as traders react to the breakdown and increasing risk aversion.
Should I buy the Nasdaq100 at current levels near $23,076.09 given the oversold RSI readings?
Buying solely based on oversold RSI readings near $23,076.09 is risky given the strong daily bearish trend (ADX 47.68). While a short-term bounce is possible, confirmation through a sustained close above $23,189.19 resistance and increasing volume would be needed for a higher-probability bullish setup.
Is the MACD histogram's negative momentum a sell signal for the Nasdaq100 at $23,076.09?
Yes, the negative MACD histogram on multiple timeframes, particularly the daily chart, indicates prevailing bearish momentum. While not a standalone buy/sell signal, it confirms the downward pressure and suggests that rallies are more likely to be sold into until this momentum shifts significantly.
How will the DXY strength at 99.79 affect the Nasdaq100's outlook this week?
The strengthening DXY at 99.79 typically exerts downward pressure on risk assets like the Nasdaq100. This inverse correlation suggests that as long as the dollar remains strong due to safe-haven demand or Fed policy expectations, it will act as a headwind for the index, potentially exacerbating any existing bearish trends.
Track markets in real-time
AI-powered analysis, technical indicators and real-time price data.
Join Our Telegram Channel
Breaking market news, AI analysis and trading signals instantly.
Join Channel