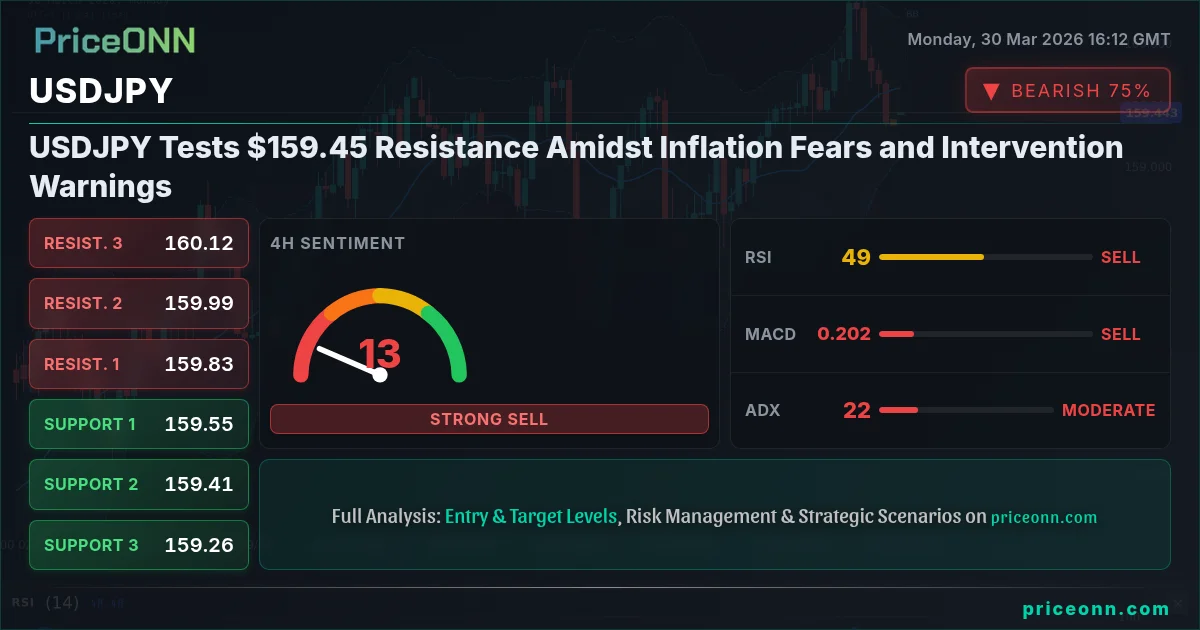
USDJPY Tests $159.45 Resistance Amidst Inflation Fears and Intervention Warnings
USDJPY is hovering near $159.45 resistance. With inflation concerns rising and Japan issuing intervention warnings, traders are on edge. This analysis delves into key levels and market correlations.
The Japanese Yen is once again at the forefront of trader attention as USDJPY hovers precariously near the psychologically significant $159.45 level. This critical juncture comes amidst a complex interplay of surging global inflation, particularly in energy prices, and increasing rhetoric from Japanese authorities about potential currency intervention. The Dollar Index (DXY) is showing strength, adding another layer of pressure on the Yen, while risk sentiment remains volatile. This analysis will dissect the current technical landscape, explore the correlating market forces, and assess the potential scenarios unfolding for USDJPY.
- RSI at 38.26 on the 1H chart signals bearish momentum, but the overall trend strength on the daily is a strong 92% bullish.
- Critical resistance sits at $160.65, a level that has seen significant price action and could trigger intervention warnings.
- The ADX at 30.5 on the 1H chart indicates a strong downtrend, contrasting with the daily's strong uptrend signal.
- The correlation with DXY, currently at 100.34, is strong, suggesting dollar strength will continue to pressure USDJPY downwards in the short term.
Navigating the Volatility: USDJPY's Tightrope Walk
USDJPY is currently caught in a tug-of-war, with strong daily bullish signals battling against short-term bearish momentum. The daily chart paints a picture of underlying strength, with a robust 92% trend power and a general upward bias. However, the 1-hour timeframe tells a different story, showing a bearish divergence with an RSI at 38.26 and a strong downtrend indicated by ADX at 30.5. This divergence is a classic sign that the short-term sentiment is cooling off, even if the longer-term trend remains intact. It's a scenario where traders must tread carefully, acknowledging both the prevailing upward force and the immediate headwinds.
The current price of $159.45 is not just a number; it's a battleground. The proximity to the 160 mark, a level widely discussed as a potential trigger for Japanese authorities to intervene, adds significant weight to any price action around this area. We've seen historical precedents where such levels have led to swift, albeit often temporary, shifts in currency pairs. The question on everyone's mind is whether this time will be different, or if the Ministry of Finance will step into the market to defend the Yen's value.
Japanese officials have been vocal about their concerns regarding rapid Yen depreciation. While they haven't explicitly stated a line in the sand, levels around 160 have been historically significant. Any sustained move above this psychological barrier could prompt verbal warnings or, more drastically, direct market intervention. Such actions can lead to sharp, unpredictable price swings, making risk management paramount for any trader exposed to USDJPY.
The Dollar's Dominance and Inflationary Pressures
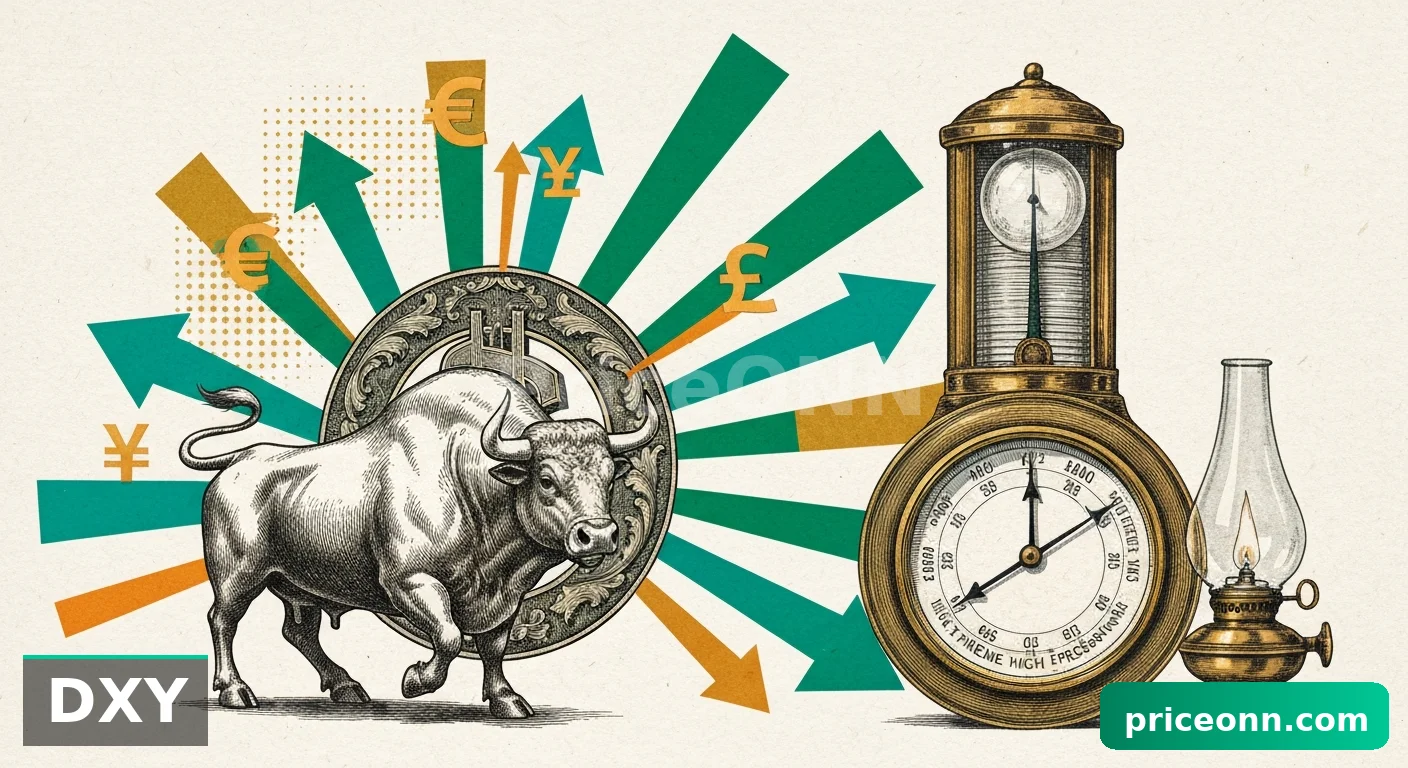
The strength of the US Dollar Index (DXY), currently trading at 100.34, is a significant factor underpinning USDJPY's upward trend on the daily chart. The DXY's robust daily trend, supported by strong ADX readings and an RSI nearing overbought territory (64.79), indicates a broad-based dollar strength narrative. This strength is often fueled by a combination of factors, including expectations surrounding Federal Reserve policy and global risk appetite. When the dollar strengthens across the board, it naturally exerts upward pressure on USDJPY, as the Yen weakens against it.
Compounding this dynamic are rising inflation concerns, particularly driven by energy prices. Recent news highlights that German inflation has surged to 2.7%, fueled by Middle East conflict. This global inflationary trend puts central banks in a difficult position. For the Federal Reserve, persistent inflation could mean a prolonged hawkish stance or delayed rate cuts, further supporting the dollar. Conversely, it puts pressure on the Bank of Japan, which has maintained ultra-loose monetary policy. The widening interest rate differential between the US and Japan is a fundamental driver for USDJPY's strength, creating a powerful tailwind for the pair.
The divergence between short-term (1H) bearish signals and the long-term (1D) bullish trend is a classic 'catch-22' for traders. On one hand, the daily trend suggests potential for further upside. On the other, the immediate technicals and the threat of intervention warrant caution. This setup often leads to choppy price action. A breakout above resistance, confirmed by increasing volume and a clear daily close above $160.65, would be needed to negate the short-term bearish signals and signal a continuation of the daily uptrend. Conversely, a failure to hold support levels around $159.09 could accelerate the short-term pullback.
Intermarket Correlations: Beyond the Pair
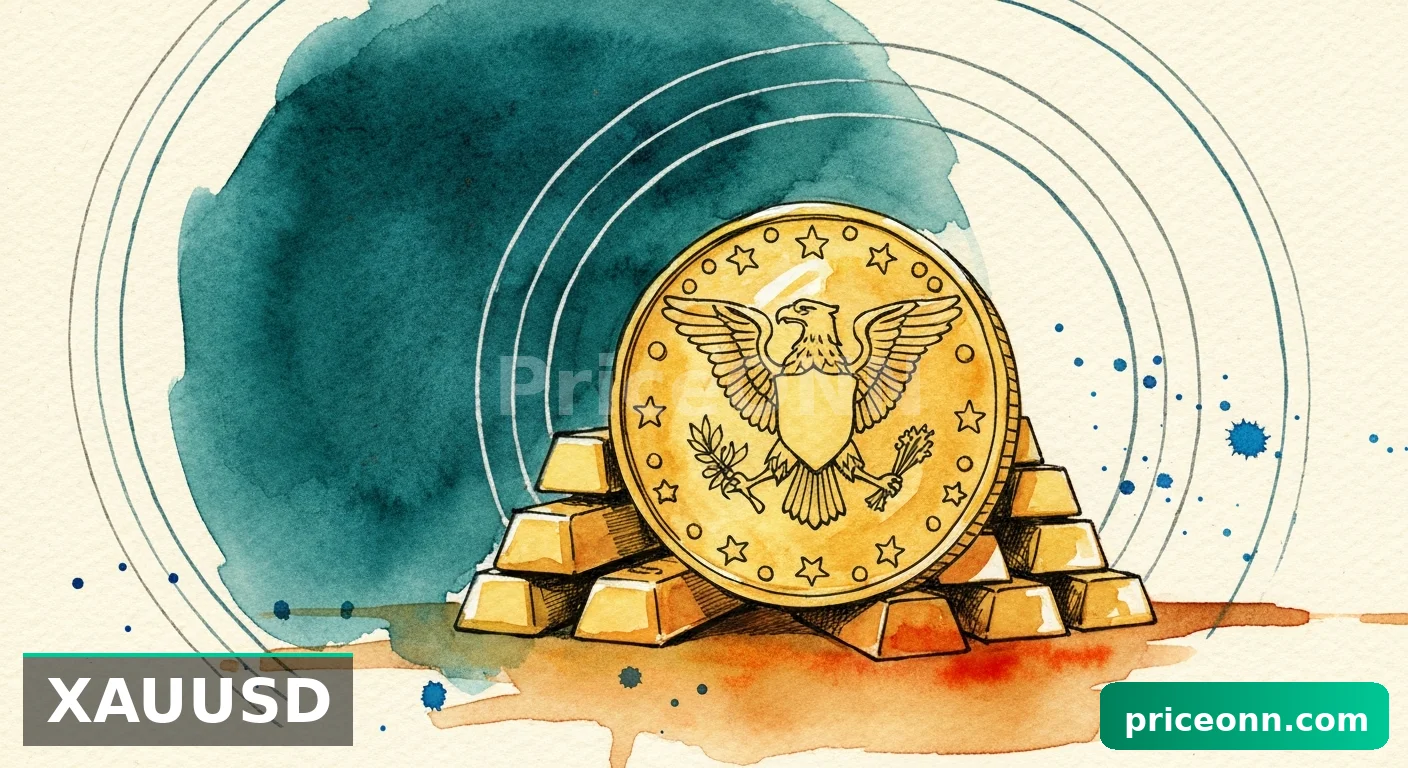
To understand USDJPY's trajectory, we must look beyond the pair itself and examine its correlations with other major markets. The Dollar Index (DXY), as mentioned, is a critical barometer. With DXY currently at 100.34 and showing a strong daily uptrend, it provides a foundational support for USDJPY's strength. A rising DXY typically correlates inversely with gold prices (XAUUSD), which are currently trading at $4541.73. We see this playing out, with gold showing a slight upward trend on the 1-hour and 4-hour charts but a daily downtrend, suggesting a potential struggle against broader dollar strength.
Equities, represented by the SP500 and Nasdaq, offer insights into risk sentiment. The SP500 is showing a daily downtrend, and the Nasdaq has entered correction territory according to recent news. This risk-off sentiment can sometimes lead to a flight to safety, which might benefit the Japanese Yen, acting as a counter-argument to the dollar's strength. However, the fundamental driver of interest rate differentials often overrides general risk sentiment in the case of USDJPY. The WTI crude oil price is surging past $100, indicating inflationary pressures that could influence Fed policy and, by extension, the dollar's strength. This complex web of correlations means that traders need to monitor a wide range of markets to get a complete picture.
The Technical Tapestry: Unraveling the Indicators
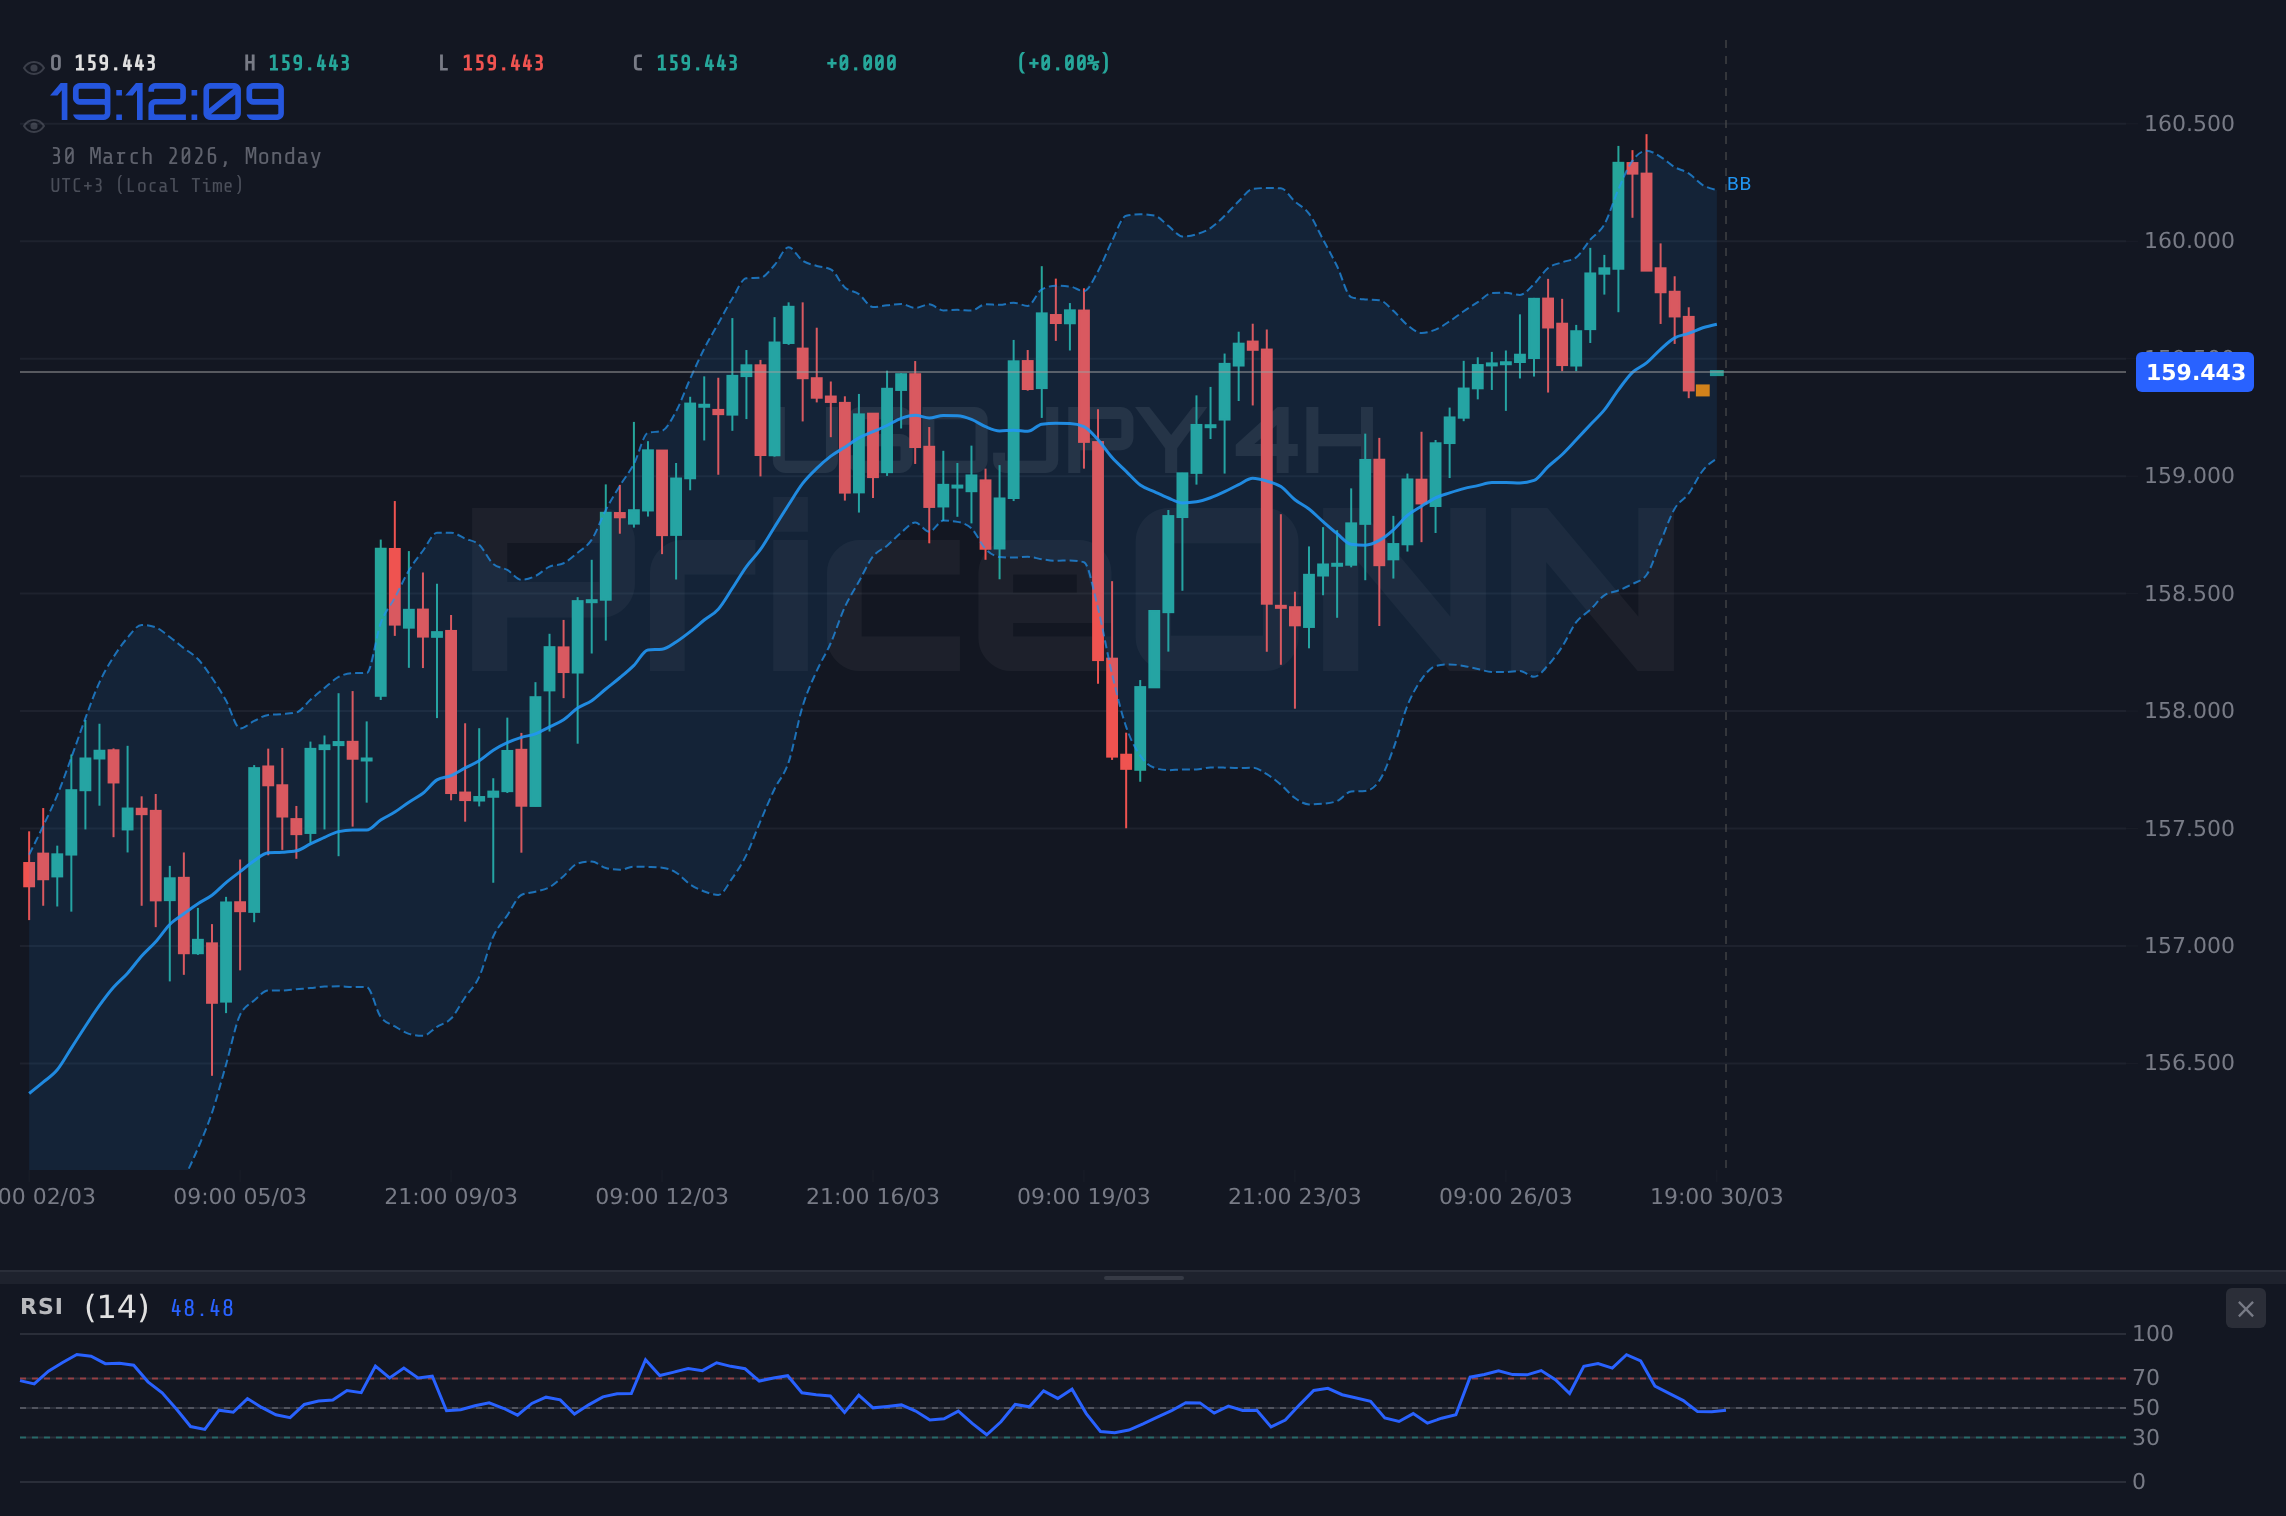
Let's dive deeper into the technical indicators for USDJPY across different timeframes. On the 1-hour chart, the RSI at 38.26 suggests the pair is in neutral territory but leaning towards oversold conditions, hinting at potential short-term buying opportunities. However, the MACD is showing negative momentum, and the Stochastic K line (33.77) is below the D line (22.79), confirming a bearish bias in this timeframe. The ADX at 30.5 indicates a strong downtrend on this short-term view, which contradicts the longer-term daily picture.
Moving to the 4-hour chart, the RSI at 48.92 is still in neutral territory, but the Stochastic K line (24.23) has crossed above the D line (62.29), suggesting a potential shift towards a bullish signal. The MACD remains in negative momentum territory. The ADX at 21.56 indicates a moderate uptrend, which is a slight departure from the 1-hour's strong downtrend but still not a clear directional conviction. This timeframe presents a mixed picture, highlighting the current indecision in the market.
The daily chart, however, offers the clearest directional signal. The RSI at 57.47 is comfortably in the neutral zone, showing room for further upside potential. The MACD is in positive momentum territory, with the MACD line above the signal line, and the Stochastic K line (83.7) is well above the D line (65.31), indicating strong bullish sentiment. Crucially, the ADX at 23.61 confirms a moderate uptrend. This daily strength is the primary reason why many analysts maintain a bullish outlook despite the short-term headwinds. The General Signal for the daily timeframe is AL (Buy: 7, Sell: 0, Neutral: 0), reflecting this dominant bullish sentiment.
Key Levels and Strategic Considerations
The support levels on the daily chart are located at $159.69, $159.09, and $158.73. These are the zones where buyers have historically stepped in, and a failure to hold these levels could signal a more significant correction. The resistance levels, on the other hand, are at $160.65, $161.01, and $161.61. The $160.65 level is particularly important, not only as a technical resistance but also as a psychological barrier that could trigger intervention concerns.
For short-term traders, the 1-hour resistance at $159.71 and support at $159.36 are key. A break above $159.71 could signal a temporary move higher, while a break below $159.36 might indicate further downside pressure in the immediate term. However, given the strong daily trend, these short-term levels may act more like noise rather than definitive trend indicators.
Bearish Scenario: Yen Reclaims Ground
45% ProbabilityNeutral Scenario: Consolidation Around Current Levels
30% ProbabilityBullish Scenario: Trend Continuation
25% ProbabilityThe Road Ahead: What to Watch
Looking forward, the economic calendar and geopolitical developments will be crucial in dictating USDJPY's next move. The upcoming US jobs data and any further inflation prints will significantly influence Fed policy expectations, which are a primary driver for dollar strength. Similarly, any explicit statements or actions from the Bank of Japan regarding intervention will directly impact the Yen's valuation. Traders should closely monitor the DXY for broader dollar sentiment and the performance of oil prices, as they signal underlying inflationary pressures that could shape central bank decisions.
The current technical setup presents a challenging environment. The divergence between short-term bearish signals and the longer-term bullish trend, coupled with the looming threat of intervention, suggests that choppiness is likely to continue. Patience and disciplined risk management will be key. A clear break above the $160.65 resistance, confirmed by daily price action and sustained volume, would lend more credibility to the bullish case. Conversely, a decisive break below the $159.09 support could open the door for a deeper correction, potentially invalidating the daily uptrend in the short to medium term.
Frequently Asked Questions: USDJPY Analysis
What happens if USDJPY breaks above the $160.65 resistance level?
A sustained break above $160.65 on the daily chart would invalidate the short-term bearish signals and suggest a continuation of the long-term bullish trend. This could target the next resistance at $161.01, but also increases the likelihood of Japanese intervention.
Should I consider buying USDJPY at current levels of $159.45 given the 1H RSI at 38.26?
Buying at current levels carries risk due to the short-term bearish momentum and potential for intervention. While the daily trend is bullish, waiting for confirmation, such as a break above $159.71 resistance or a retreat to stronger daily support near $159.09, might offer a better risk-reward ratio.
Is the RSI at 38.26 on the 1H chart a sell signal for USDJPY?
An RSI of 38.26 on the 1-hour chart indicates bearish momentum but is not yet in oversold territory. Combined with negative MACD momentum and a strong ADX at 30.5, it suggests short-term weakness. However, this needs to be weighed against the strong bullish daily trend, making it a signal for caution rather than an outright sell.
How will upcoming US jobs data and Fed expectations affect USDJPY this week?
Stronger-than-expected US jobs data could reinforce Fed hawkishness, boosting the dollar and potentially pushing USDJPY towards $160.65 and beyond. Conversely, weaker data might dampen rate hike expectations, leading to dollar weakness and a possible pullback towards $159.09.
| Indicator | Value | Signal | Interpretation |
|---|---|---|---|
| RSI (14) | 38.26 | Bearish | Bearish momentum on 1H, neutral on 1D |
| MACD Histogram | -0.31 | Bearish | Negative momentum on 1H |
| Stochastic | K=33.77, D=22.79 | Bearish | Bearish crossover on 1H |
| ADX | 30.5 | Strong Trend | Strong downtrend on 1H, strong uptrend on 1D |
| Bollinger Bands | Middle Band | Watch | Price trading below middle band on 1H, above on 1D |
Track markets in real-time
AI-powered analysis, technical indicators and real-time price data.
Join Our Telegram Channel
Breaking market news, AI analysis and trading signals instantly.
Join Channel