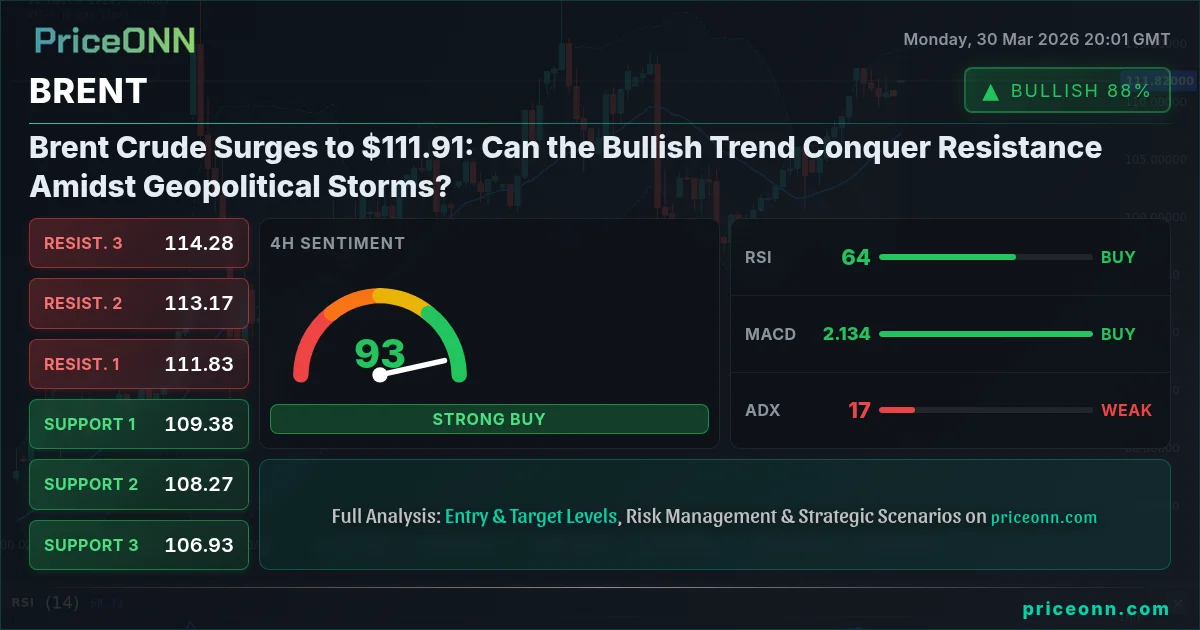
Brent Crude Surges to $111.91: Can the Bullish Trend Conquer Resistance Amidst Geopolitical Storms?
Brent Crude is trading at $111.91, pushing higher on geopolitical tensions. The RSI at 62.22 indicates bullish momentum, but ADX at 19.05 suggests a choppy trend. Can it break key resistance?
The relentless march of Brent Crude past $111.91 is not just a headline; it's a clear signal of escalating geopolitical tensions and a market grappling with supply fears. As prices climb, the question on every trader's mind is whether this bullish momentum can overcome the formidable resistance levels ahead, or if we're heading for a correction. Having tracked Brent through its volatile journey, the current setup presents a fascinating confluence of factors, demanding a close look at both the technicals and the ever-present geopolitical undercurrents.
- Brent Crude is currently trading at $111.91, driven by rising geopolitical risks and supply concerns.
- The 1-hour RSI at 62.22 signals bullish momentum, but the ADX at 19.05 indicates a weaker trend, suggesting potential choppiness.
- Key resistance is observed at $112.30 on the 1-hour chart, while support lies at $110.70.
- The broader market context shows a strengthening DXY near 100.22, which typically pressures oil prices, but current geopolitical events are overriding this correlation.
The narrative driving oil prices higher is undeniably compelling. Escalating geopolitical tensions, particularly in the Middle East, are creating significant anxiety about global energy supply stability. Reports of potential disruptions, even if not fully materialized, are enough to spook markets and send traders scrambling for the safety of energy assets. This fear-driven demand is a powerful catalyst, pushing Brent Crude prices up by a significant 1.29% today, reaching $111.91. The WTI crude oil, following suit, has also seen a substantial jump, nearing $103. This correlation between geopolitical flare-ups and oil price surges is a well-trodden path, but the current intensity adds another layer of urgency to the market's reaction. We've seen this play out before, but the speed and scale of the current price action warrant particular attention.
On the technical front, the 1-hour chart paints a picture of cautious optimism. The RSI at 62.22 is comfortably within bullish territory, suggesting that buyers are in control and momentum is to the upside. However, it's not yet in the extreme overbought zone that would signal an immediate reversal. The Stochastic indicator also supports this view, with the %K line above the %D line and heading towards overbought conditions, indicating sustained buying interest. The MACD, while showing positive momentum, is hovering near its signal line, hinting that the upward force might be stabilizing rather than accelerating aggressively. This is where the ADX reading of 20.06 becomes crucial. It signifies a trend of moderate strength, meaning that while an uptrend is present, it lacks the conviction to suggest a runaway rally. This suggests that the path of least resistance might be higher, but not without potential pauses or pullbacks.
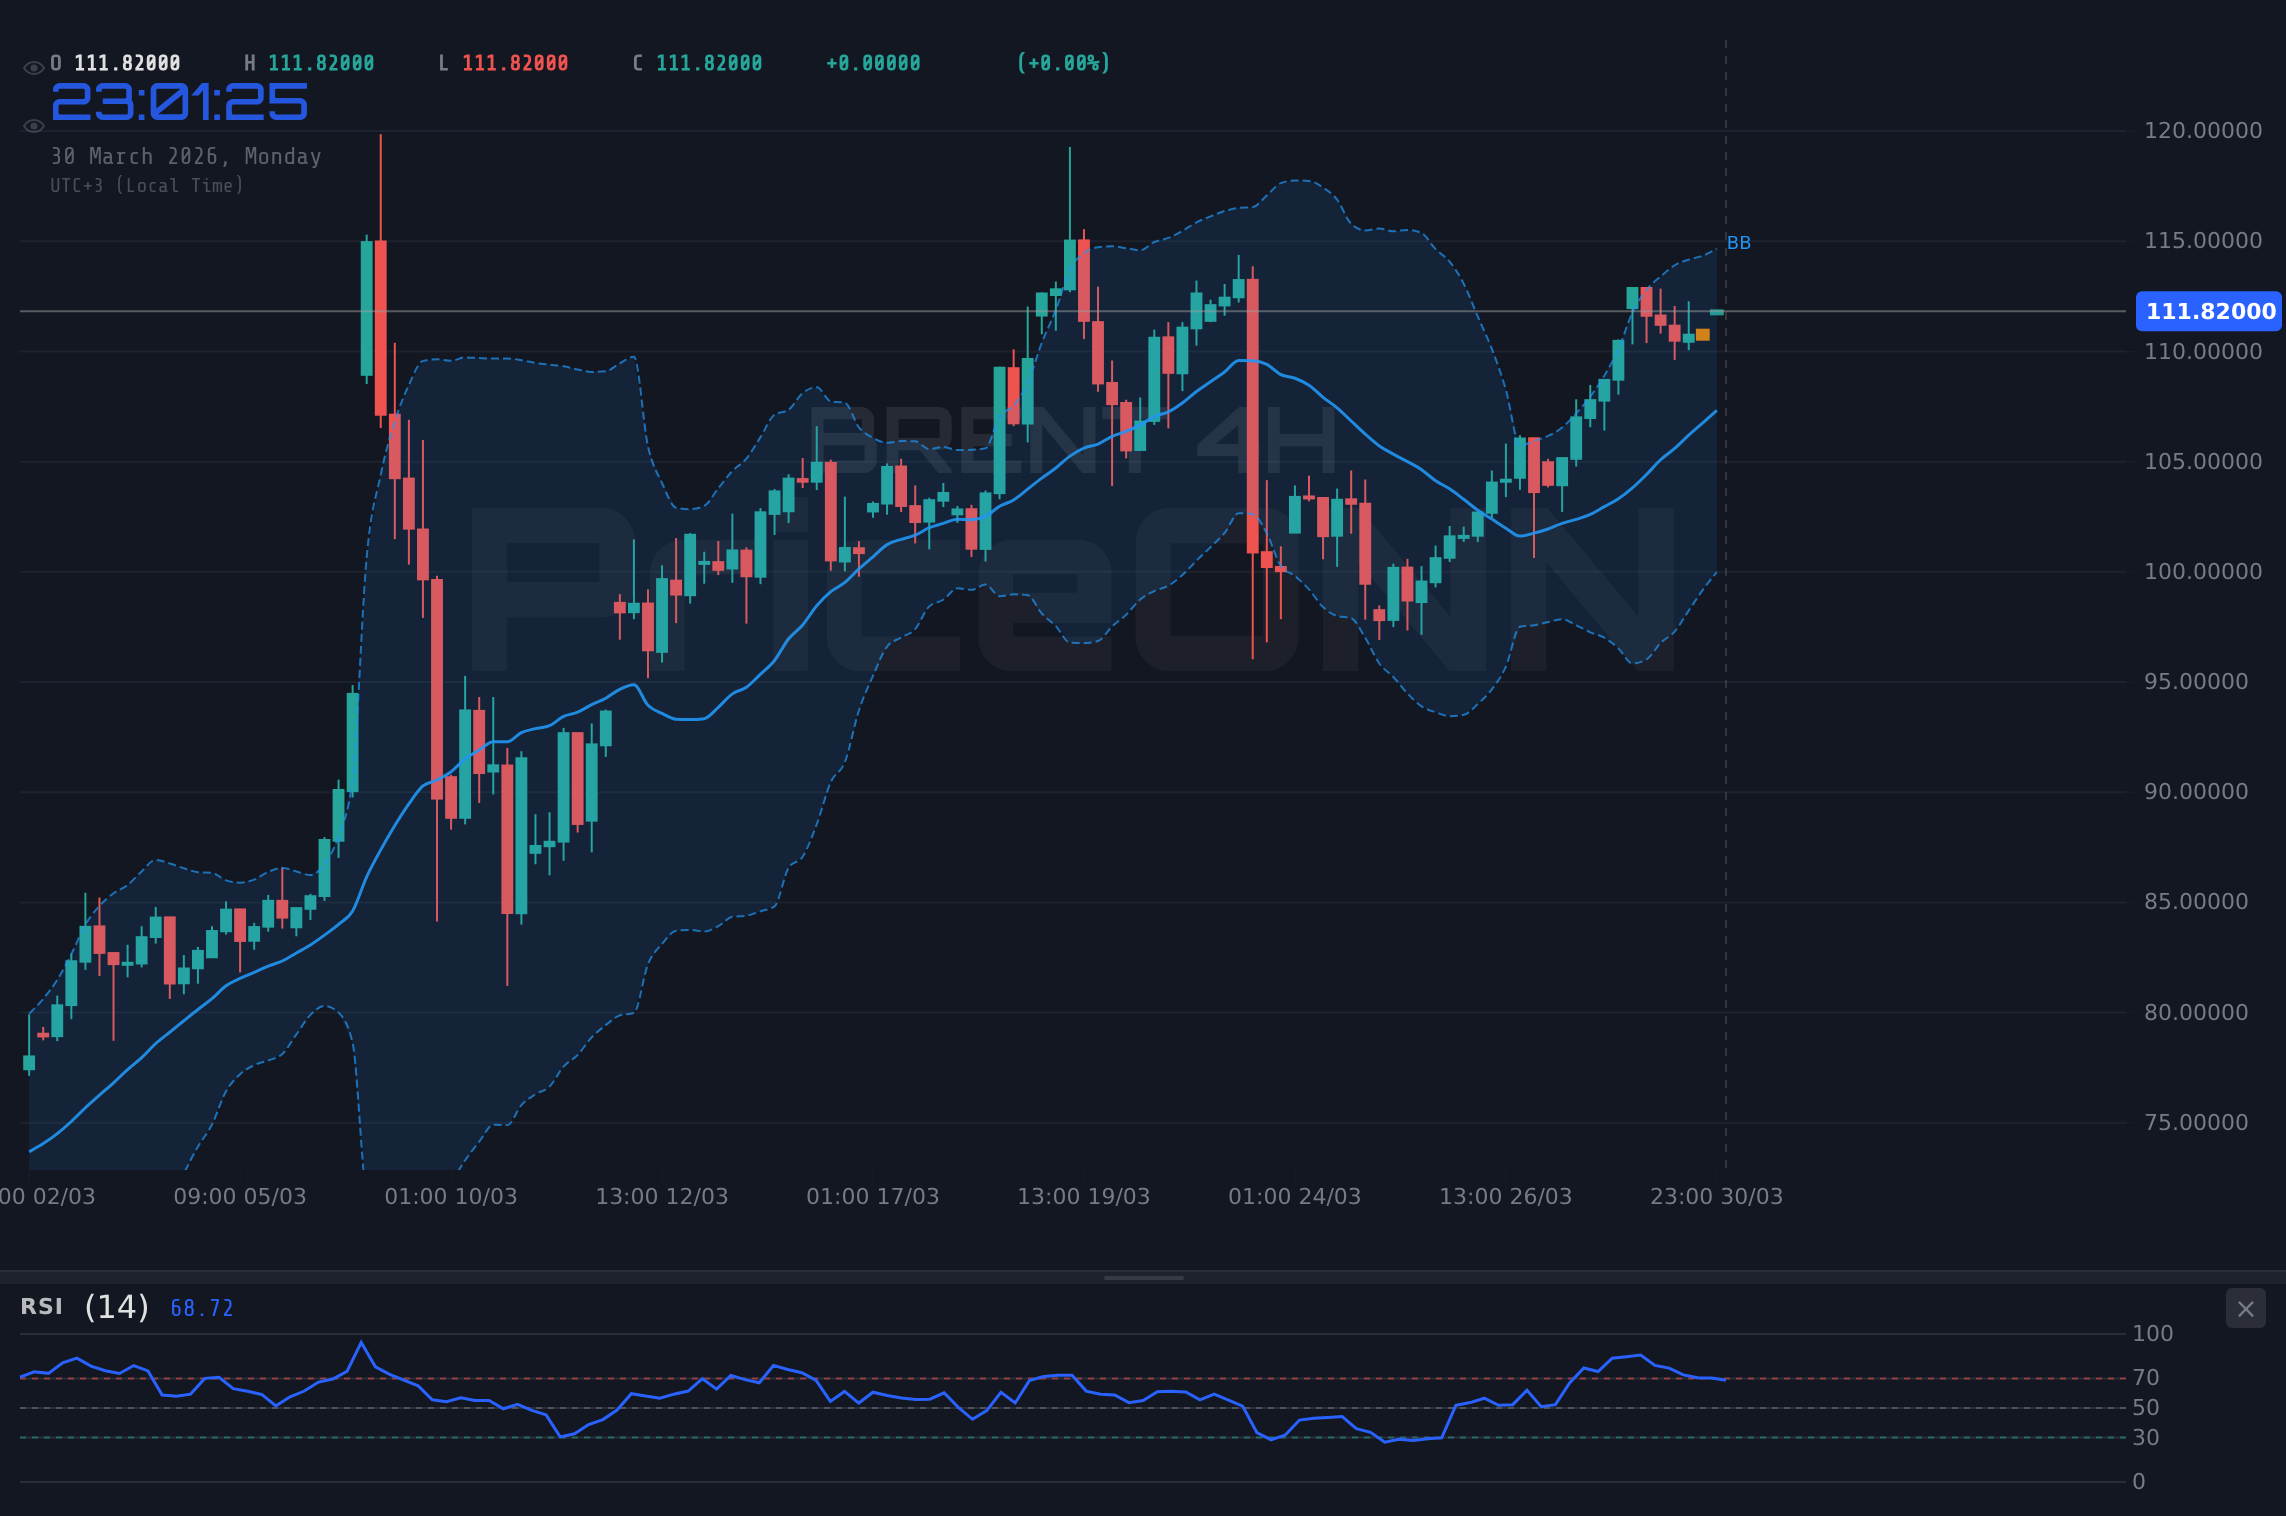
The 4-hour timeframe offers a slightly different, though still largely positive, perspective. Here, the RSI sits at 63.9, reinforcing the idea of bullish sentiment without hitting extreme levels. The MACD is clearly above its signal line, indicating positive momentum building on this slightly longer timeframe. Crucially, the price is trading above the middle Bollinger Band, which often acts as a dynamic support in an uptrend. The Stochastic is nearing overbought territory, with %K at 82.31 and %D at 91.46, hinting that a period of consolidation or a slight pullback might be on the horizon after this latest surge. However, the ADX here is at a relatively weak 16.6, confirming the choppiness observed on the shorter timeframe. This lack of a strong trend on the 4-hour chart suggests that the current price action might be more reactive to news flow than driven by a sustained, technical trend. It’s a market that’s sensitive to headlines.
Navigating the Resistance: What the Daily Chart Reveals
The Long-Term View: A Bullish Trend in Force
Turning to the daily chart, the overarching trend for Brent Crude remains decidedly bullish, with a strength rating of 100%. This longer-term perspective provides a crucial backdrop to the intraday fluctuations. The price is currently pushing against the $111.91 mark, a level that has significant psychological and technical importance. The daily support levels are well-defined, with the first significant floor at $105.28, followed by $100.09 and $97.45. These are substantial cushions that would need to be breached for the bullish thesis to be seriously challenged. On the resistance side, the path higher could see prices targeting $113.11, then $115.75, and potentially $120.94 if momentum continues to build and geopolitical factors remain supportive.
The daily RSI at 70.24 is indeed touching the edge of the overbought territory. While this often signals a potential for a pullback or consolidation, in the context of a strong uptrend and significant geopolitical drivers, it can also indicate strong underlying demand. It’s a signal that warrants attention but not necessarily a reason to bet against the trend just yet. The MACD is firmly in positive territory, with its histogram showing robust upward momentum, reinforcing the daily bullish bias. The price is also hugging the upper Bollinger Band, a classic sign of a strong uptrend. The Stochastic indicator, with %K at 54.36 and %D at 43.03, still shows room for upward movement before hitting extreme overbought conditions. The ADX at a very strong 62.65 confirms a powerful, established trend. This daily picture suggests that while short-term pullbacks are possible, the dominant force is currently bullish.
Correlation Analysis: DXY and Equities in the Crosshairs
In normal market conditions, a strengthening US Dollar Index (DXY) would typically put a lid on oil prices. The DXY is currently trading near 100.22, showing resilience. A higher dollar makes oil, priced in dollars, more expensive for holders of other currencies, potentially dampening demand. However, the current geopolitical climate is creating a unique divergence. Despite the DXY's upward movement, Brent Crude is surging. This highlights how significantly the supply-side fears are dominating market sentiment, overriding the usual inverse correlation. It's a classic case of geopolitical risk premium trumping currency dynamics.
Similarly, the performance of major equity indices like the S&P 500 and Nasdaq provides context for risk appetite. With the Nasdaq down 0.59% and the S&P 500 down 0.22% today, we are seeing a slight risk-off sentiment in the equity markets. Typically, a decline in equities would coincide with a move towards safe-haven assets and potentially pressure riskier commodities like oil. Yet, Brent is climbing. This decoupling further emphasizes the dominant role of supply-side anxieties. The market is prioritizing the immediate threat to oil supply over broader risk sentiment, a stark indicator of the current geopolitical premium being priced into energy markets. This divergence is key; it tells us that the oil market is currently operating on its own set of powerful drivers.
The Geopolitical Premium: Fueling the Fire
The news flow over the last 48 hours has been dominated by escalating geopolitical tensions, particularly concerning the Middle East. Reports of potential supply disruptions, even if not yet fully realized, have sent shockwaves through the energy markets. This has created a significant 'geopolitical risk premium' that is being factored into oil prices. When supply routes are threatened, or production capacity is perceived to be at risk, the market reacts swiftly, often overshooting to price in potential future shortages. This is precisely what we are witnessing with Brent Crude now trading at $111.91. The German inflation surge to 2.7% in March, directly linked to rising energy prices due to the Iran conflict, further underscores the inflationary pressures stemming from these events. This adds another layer of complexity, as it could force the ECB into a hawkish stance, potentially strengthening the Euro, or conversely, lead to stagflation fears.
The implication for traders is clear: while technical indicators provide valuable insights into momentum and potential turning points, the geopolitical backdrop is currently the primary driver. Any news that suggests a de-escalation of tensions could lead to a rapid unwinding of this risk premium, resulting in a sharp price correction. Conversely, any further escalation or confirmed supply disruption would likely propel prices even higher. The market is hypersensitive to headlines from the region, making it crucial to monitor news flow alongside technical analysis. This is not a typical supply-demand scenario; it's a market heavily influenced by fear and uncertainty, which can lead to exaggerated price movements in both directions.
Trading Scenarios: Navigating the Uncertainty
Bearish Scenario: Profit-Taking and De-escalation
25% ProbabilityNeutral Scenario: Consolidation and Choppy Trend
40% ProbabilityBullish Scenario: Geopolitical Premium Extends
35% ProbabilityThe current ADX reading across multiple timeframes, particularly the moderate strength on the 1-hour (20.06) and the weak trend on the 4-hour (16.6), supports the higher probability of consolidation or a choppier trend in the immediate short term. However, the strong daily ADX (62.65) cannot be ignored; it signifies that when a trend does take hold, it is powerful. The immediate focus for traders must be on the $111.50-$112.30 range. A break above $112.30, especially on increased volume and sustained by geopolitical headlines, could indeed propel Brent towards higher targets. Conversely, failure to hold the current levels and a slip below $110.70 could signal a short-term reversal, potentially driven by profit-taking or a slight easing of tensions.
The Trader's Imperative: Patience and Risk Management
For active traders, the current environment demands a high degree of patience and disciplined risk management. The interplay between geopolitical fear and technical signals creates a complex trading landscape. While the daily trend is strongly bullish, the intraday indicators suggest caution. A breakout above $112.30, confirmed by a daily close above this level, would be a significant bullish signal, potentially opening the door for a move towards $113.11 and beyond. Conversely, a failure to sustain the current levels and a break below $110.70 could signal a shift, but confirmation is key. It’s crucial not to chase the market higher without clear technical validation or to prematurely bet against the trend based solely on intraday overbought readings.
The key takeaway is that the market is currently priced for significant geopolitical risk. Any de-escalation, however unlikely it may seem now, could lead to a rapid unwinding of this premium. Therefore, managing risk by using appropriate stop-losses is paramount. For those looking to enter long positions, waiting for a clear confirmation of strength above resistance, or a pullback to a well-defined support level like $110.70, would offer a more favorable risk-reward setup. The strong daily trend suggests that dips might be buying opportunities, but only if they are confirmed by technical signals and do not represent a fundamental shift in the geopolitical landscape. The market is giving us signals, but the ultimate direction will be dictated by headlines and the willingness of buyers to absorb potential selling pressure.
Frequently Asked Questions: BRENT Analysis
What happens if Brent Crude breaks above the $112.30 resistance level?
A decisive break and daily close above $112.30, especially if fueled by ongoing geopolitical tensions, would likely trigger further upside momentum. This could open the door for Brent to target the next significant resistance level at $113.11, with potential follow-through towards $115.75 if the bullish sentiment persists.
Is the RSI at 62.22 a buy signal for Brent Crude at $111.91?
An RSI reading of 62.22 on the 1-hour chart indicates bullish momentum but is not yet in extreme overbought territory. While it suggests buyers are active, it's not a standalone buy signal. Confirmation from price action breaking resistance or a pullback to support levels like $110.70 would be needed for a higher-probability trade.
How will the German inflation surge affect Brent Crude prices this week?
The surge in German inflation to 2.7%, driven by energy prices, reinforces the bullish narrative for Brent Crude by highlighting the inflationary impact of geopolitical supply concerns. This could signal stronger demand for oil as an inflation hedge and pressure central banks like the ECB, potentially leading to higher oil prices if supply fears continue.
Should I consider buying Brent Crude at current levels of $111.91 given the choppy trend?
Buying at current levels of $111.91 carries risk due to the choppy trend indicated by the ADX at 16.6 on the 4-hour chart. A more prudent approach would be to wait for a clear breakout above $112.30 or a pullback to support around $110.70, offering better defined risk-reward parameters and confirmation of direction.
Track markets in real-time
AI-powered analysis, technical indicators and real-time price data.
Join Our Telegram Channel
Breaking market news, AI analysis and trading signals instantly.
Join Channel