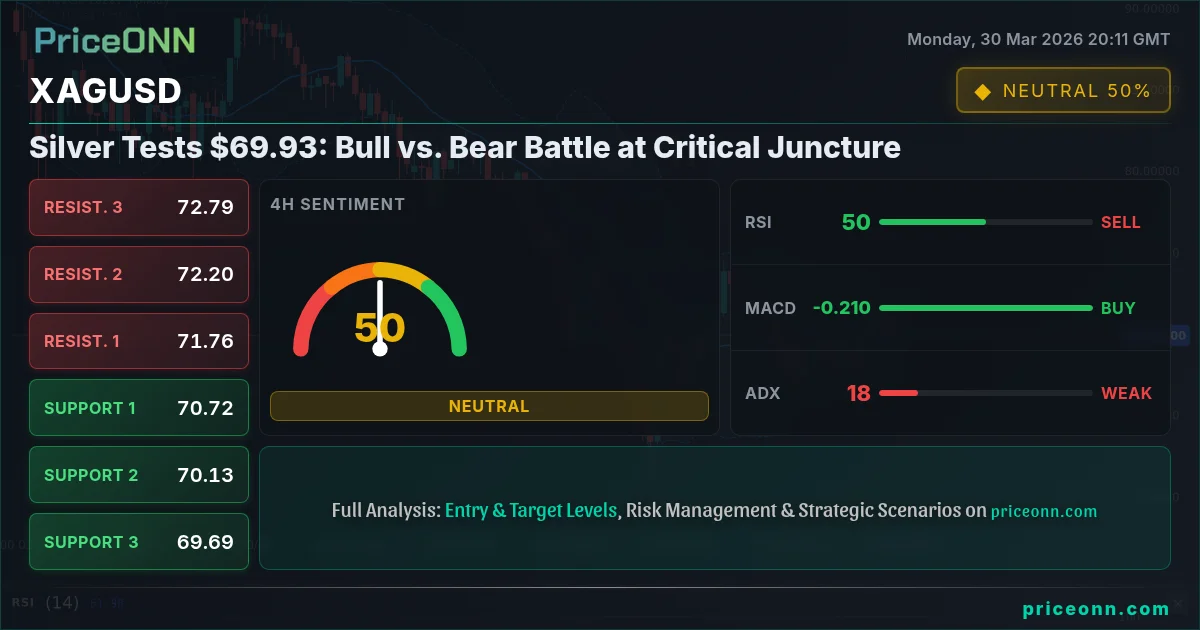
Silver Tests $69.93: Bull vs. Bear Battle at Critical Juncture
Silver hovers around $69.93 as conflicting indicators and key levels create a tug-of-war. Is the metal poised for a breakout or a pullback?
The battle lines are drawn for silver. As XAGUSD hovers precariously around the $69.93 mark, a fierce debate is unfolding between the bulls and bears. This critical juncture, marked by conflicting technical signals and intense macroeconomic crosscurrents, demands a closer look. Can silver break decisively above the psychological $70 level, or will prevailing bearish pressures reassert control? We delve into the arguments for both sides, examining the data that could tip the scales.
- RSI at 48.15 on the 1H chart suggests waning bullish momentum, while the 4H RSI at 49.57 indicates a neutral stance, with the daily RSI at 38.87 leaning bearish.
- Key support for XAGUSD is identified at $69.63, $69.39, and $68.93 on the 1H timeframe, while resistance looms at $70.34, $70.80, and $71.04.
- The US Dollar Index (DXY) is trading strong at 100.31, a factor that typically exerts downward pressure on silver prices.
- Geopolitical tensions, evidenced by Brent Crude surging past $116, are adding volatility to commodities, potentially creating safe-haven demand for silver.
The narrative surrounding silver is complex, caught between the persistent strength of the US dollar, which is currently testing 100.31 on the DXY, and escalating geopolitical risks that historically favor precious metals. On the 1-hour chart, silver presents a mixed picture: the trend is neutral with 50% power, but the RSI is drifting lower at 48.15, hinting at a potential loss of upward momentum. However, the 4-hour chart offers a contrasting view, showing a neutral trend with a rising RSI at 49.57 and Stochastic flashing a buy signal with %K above %D. This divergence across timeframes encapsulates the current indecision in the market.
Let's build the case for the bulls first. The primary argument for higher silver prices rests on the broader inflationary environment and the potential for safe-haven flows amidst rising geopolitical tensions. Crude oil prices, for instance, are surging, with Brent crude reaching $112.33 and WTI at $104.98. Such spikes in energy costs often fuel inflation concerns, making hard assets like silver an attractive hedge. Furthermore, the news flow highlights escalating geopolitical risks, with conflicts in the Middle East potentially driving investors towards perceived safe havens. While the DXY is currently strong at 100.31, a sustained increase in global uncertainty could override dollar strength and boost demand for silver, especially if central banks begin to signal a pause in aggressive tightening cycles due to inflation fears. The 4H Stochastic indicator, showing %K at 81 and %D at 68.87, is in overbought territory but still points to bullish momentum, suggesting that buyers might be accumulating positions, anticipating a move above the $70 psychological barrier.
Adding to the bullish sentiment, the daily chart, despite showing a bearish trend with 91% power for gold (XAUUSD), presents support levels for silver at $67.52, $65.34, and $63.31. While these are significantly below the current price, the fact that silver has managed to hold near the $70 mark suggests resilience. The daily Stochastic, with %K at 38.68 and %D at 30.34, actually shows a bullish signal, indicating that despite the overall bearish trend, a potential bottoming process might be underway. This is a classic scenario where underlying asset strength can emerge even within a broader downtrend, particularly if external factors like geopolitical instability intensify. The ADX on the daily chart at 32.53 indicates a strong downtrend, but this strength can also mean that once a reversal begins, it could be swift and powerful, catching many bears off guard.
On the flip side, the bears have a compelling argument, primarily anchored in the strength of the US dollar and the mixed signals from technical indicators. The DXY's climb to 100.31 is a significant headwind for silver, as a stronger dollar typically makes dollar-denominated commodities more expensive for holders of other currencies, thus dampening demand. The 1-hour technicals are particularly concerning for bulls, with a general 'SELL' signal across multiple indicators. The RSI at 49.52 is trending down, MACD is showing negative momentum with the MACD line below the signal line, and Stochastic is giving a clear sell signal (%K < %D). The ADX at 21.26 suggests a moderately trending market, but the overall tenor of these 1H indicators points towards immediate selling pressure, suggesting that the push above $70 might be a 'bull trap' designed to lure unsuspecting buyers before a sharp reversal.
The 1-day technical picture also provides ammunition for the bears, despite the Stochastic's bullish signal. The daily RSI at 37.01 is firmly in neutral territory but trending down, and the MACD remains in negative momentum. Bollinger Bands on the daily chart are below the middle band, indicating a bearish inclination. While the ADX at 32.53 signals a strong downtrend, this also means that any upward move could be met with strong resistance as sellers step in to defend the established trend. The fact that XAGUSD is trading below its 1-hour middle Bollinger Band further reinforces the idea that immediate price action is favoring sellers. This suggests that any rallies towards the $70 level might be met with profit-taking or fresh short positions being initiated by traders who believe the downtrend is set to resume.
Cross-market correlations add another layer of complexity. The S&P 500 (SP500) is showing a bearish trend on the 1-hour chart with a general 'SELL' signal, and the Nasdaq (Nasdaq100) is also firmly in a downtrend on all timeframes. A risk-off sentiment in equities typically correlates with a stronger dollar and, often, weaker commodity prices, unless geopolitical fears specifically drive commodity demand. Currently, the DXY is strong, aligning with the bearish equity sentiment. This suggests that the broader market environment is not conducive to a sustained rally in silver. The inverse relationship between the dollar and silver is a well-established phenomenon; as the DXY strengthens, silver tends to face headwinds. With the DXY at 100.31 and showing strong upward momentum across timeframes, this correlation is likely to remain a dominant factor in the near term.
The economic calendar, though sparse on high-impact data releases today (March 30th), looms large with upcoming events. Past data for EUR and GBP showed moderate figures, and USD data has been mixed. However, the market is clearly pricing in future inflation and potential central bank reactions. The surge in oil prices, driven by geopolitical tensions, is a significant inflationary pressure. If this translates into higher-than-expected inflation readings in the coming weeks, it could complicate central bank decisions. For instance, if the ECB is forced to signal a more hawkish stance due to rising German inflation (currently at 2.7% according to analysts), it could strengthen the Euro, which might indirectly benefit silver if it coincides with a broader risk-asset rally. Conversely, persistent dollar strength driven by global uncertainty could mute any inflationary benefits for silver.
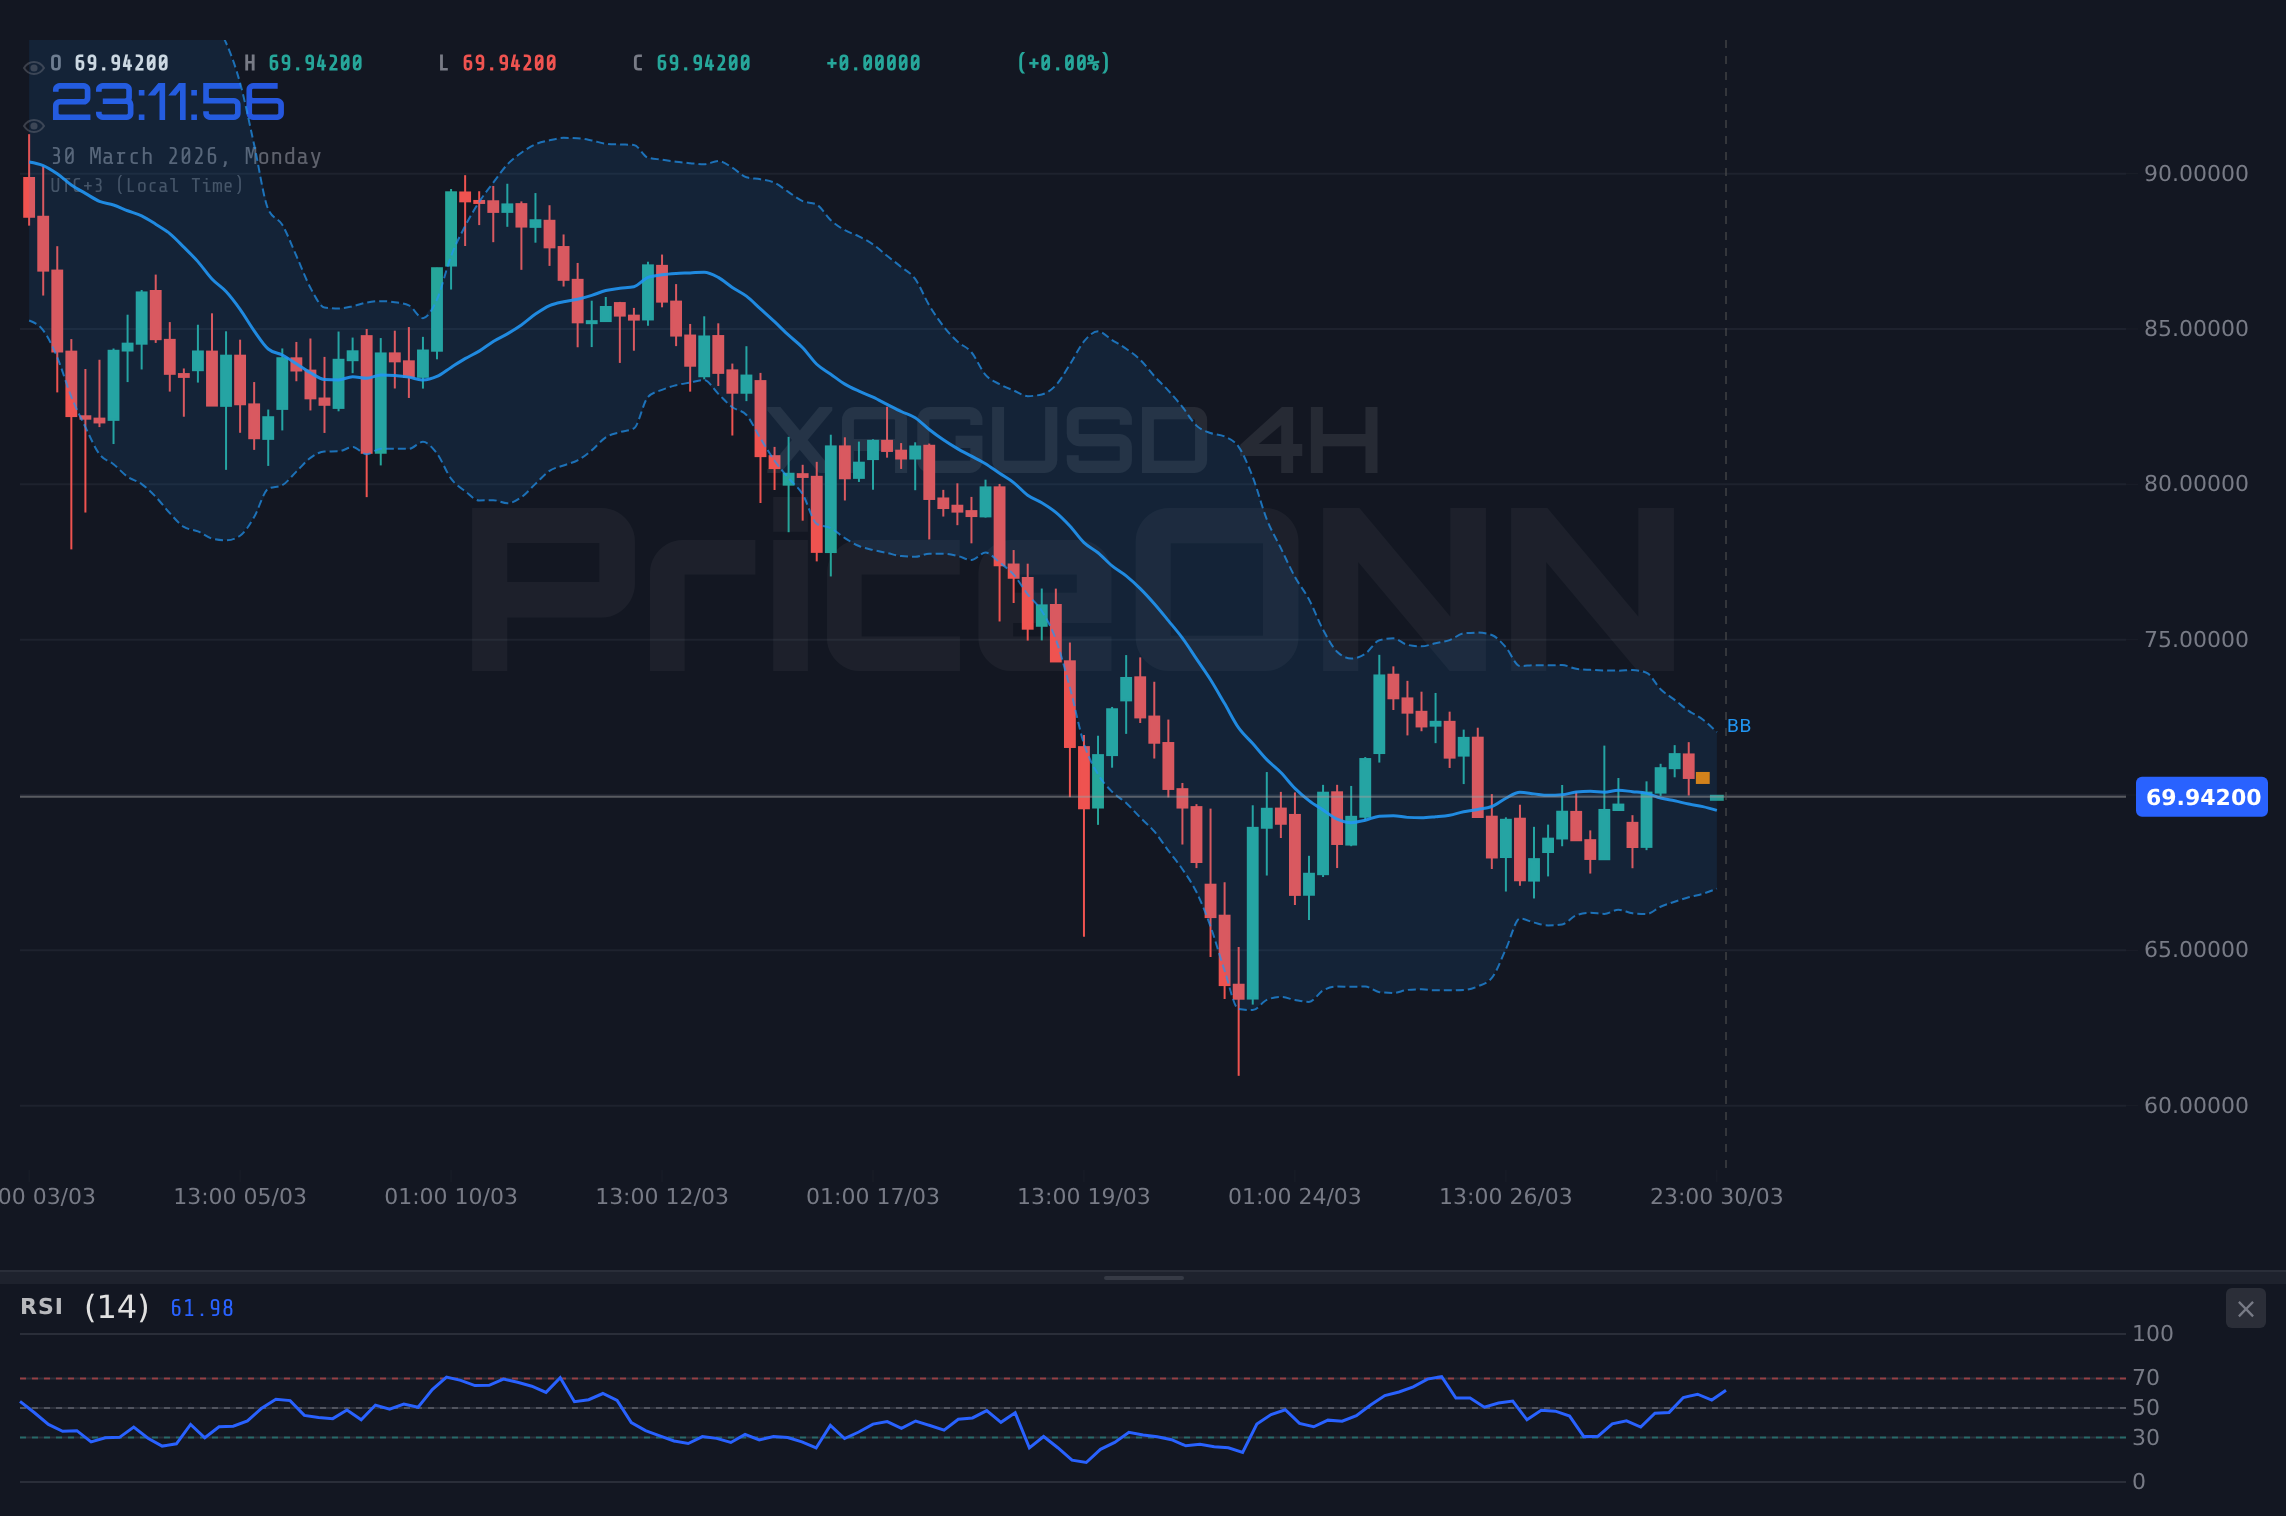
Looking at the specific price action, the 1-hour chart shows immediate resistance at $70.34 and $70.80. A decisive close above these levels would be required to challenge the bearish short-term outlook. Conversely, a break below the immediate support at $69.63 could signal a resumption of the downtrend, with further targets at $69.39 and $68.93. The daily chart's resistance level at $71.73 becomes crucial if the bulls manage to regain control. However, the prevailing daily trend is bearish, and the ADX at 32.53 indicates strong directional movement, making it difficult for prices to climb against such a powerful trend without significant catalysts.
The intraday volatility is a key characteristic of the current silver market. While the 4-hour chart offers some comfort to bulls with its Stochastic buy signal and RSI pointing upwards, the overwhelming 'SELL' signals on the 1-hour chart and the bearish daily trend cannot be ignored. This is a market where short-term traders might find opportunities on pullbacks, but long-term investors face a dilemma. The conflict between inflation hedges and dollar strength is creating a choppy environment. The fact that silver is currently trading below its 1-hour middle Bollinger Band at $69.93 reinforces the immediate bearish bias, suggesting that any upward movement might be capped near the current levels unless a significant shift in market sentiment occurs.
The ADX indicator across all timeframes offers a crucial perspective. On the 1H chart, it's at 14.78, indicating a weak trend. The 4H ADX is at 18.32, also suggesting a weak trend. However, the daily ADX jumps to 32.53, indicating a strong trend. This inconsistency highlights the lack of a clear directional conviction across different time scales. A weak trend environment often leads to range-bound trading and potential 'whipsaws' – false breakouts followed by sharp reversals. Traders need to be particularly cautious in such conditions, waiting for clearer signals or higher probability setups. The current readings suggest that while a strong daily trend exists, the shorter timeframes are exhibiting choppiness, making immediate entries risky.
The current price of $69.93 sits just below the critical $70 psychological level and the 1-hour resistance at $70.34. This proximity to a major round number, combined with the technical indicators, creates a tense standoff. Bulls need to force a clear break and hold above $70.34, ideally with increasing volume, to suggest a genuine trend reversal. Bears, on the other hand, are looking for confirmation of the bearish momentum, aiming to push prices back towards the $69 support levels and potentially lower. The strong DXY at 100.31 and the risk-off sentiment in global equities provide a backdrop that favors the bears in the immediate term, despite the potential safe-haven appeal of silver in the longer run due to geopolitical instability.
Ultimately, the market is grappling with conflicting forces: inflationary pressures and geopolitical risk versus dollar strength and risk aversion in equities. The technicals offer a mixed bag, with short-term indicators leaning bearish while longer-term outlooks are more nuanced. The resilience shown around the $69 mark is notable, but the immediate resistance at $70.34, coupled with the strong dollar, presents a formidable barrier. Patience appears to be the most prudent strategy here. Waiting for a clear break above resistance or a decisive move below support, confirmed by volume and broader market sentiment, will likely offer a higher probability trade setup than trying to anticipate the next move in this indecisive environment.
The path forward for silver hinges on several key factors. Geopolitical developments will undoubtedly play a crucial role; any escalation could trigger significant safe-haven demand. Simultaneously, the trajectory of the US dollar and the Federal Reserve's stance on inflation will be critical. If the DXY falters and inflation concerns mount, silver could find strong footing. However, until these conditions clearly materialize, the current technical picture suggests a cautious approach. The battle at $69.93 is far from over, and observing how price action unfolds around the $70 level in the coming hours and days will be essential for discerning the next directional move.
The market is in a delicate balance, with both bulls and bears having valid points. The immediate technicals on the 1-hour chart lean bearish, signaling caution. However, the underlying inflationary pressures and geopolitical uncertainties offer a bullish undercurrent. For traders, this means waiting for confirmation. A break above $70.34, coupled with a weaker DXY and positive equity market sentiment, could signal a bullish continuation. Conversely, a failure to overcome this resistance and a drop below $69.39 would reinforce the bearish outlook. The key now is to watch for these specific catalysts and price reactions, managing risk diligently in this choppy, yet potentially rewarding, market environment.
Bearish Scenario: Downtrend Resumes
65% ProbabilityNeutral Scenario: Range-Bound Consolidation
25% ProbabilityBullish Scenario: Breakout Above $70
10% ProbabilityFrequently Asked Questions: XAGUSD Analysis
What happens if XAGUSD breaks below the $69.63 support level?
A break below $69.63 would likely trigger further selling pressure, invalidating the short-term bullish attempts. Bears would target the next support at $69.39, potentially extending towards $68.93 if momentum accelerates.
Is the RSI at 48.15 a sell signal for XAGUSD right now?
While not an outright sell signal, the RSI at 48.15 on the 1H chart, trending downwards, suggests waning bullish momentum. It indicates that sellers are present and could cap any immediate upside, reinforcing the bearish bias for short-term moves.
How will the strong DXY at 100.31 affect XAGUSD around the $70 mark?
The strong DXY typically exerts downward pressure on silver prices. At $69.93, this strengthens the case for bears, suggesting that any rally towards $70 might face significant headwinds unless dollar weakness emerges concurrently.
Should I buy XAGUSD at current levels of $69.93 given the geopolitical risks?
Buying at $69.93 is speculative given the bearish technical signals on the 1H chart and strong DXY. While geopolitical risks could offer long-term support, immediate price action suggests waiting for a confirmed break above $70.80 or a pullback to stronger support levels for a higher probability setup.
The market always presents opportunities, but patience and discipline are key. Wait for high-probability setups and manage your risk meticulously.
Track markets in real-time
AI-powered analysis, technical indicators and real-time price data.
Join Our Telegram Channel
Breaking market news, AI analysis and trading signals instantly.
Join Channel