Brent Crude Tests $110.28 Resistance: A Deep Dive into Market Forces
Brent Crude hovers near $110.28, facing resistance amid mixed signals. Analysis reveals key levels and macro drivers shaping its outlook.
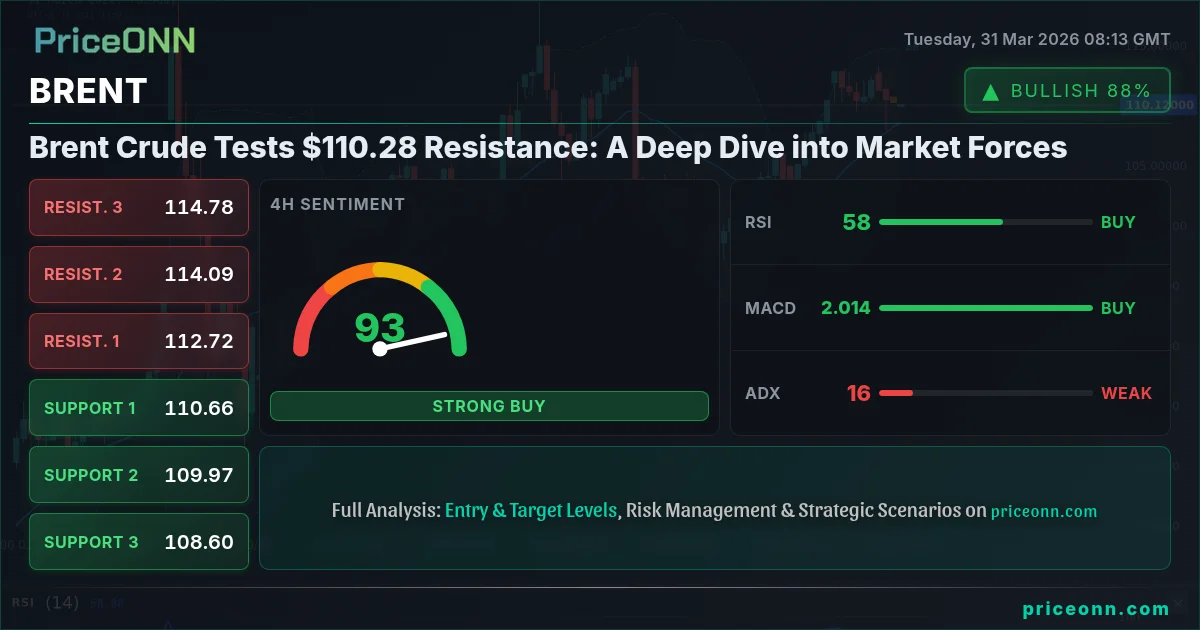
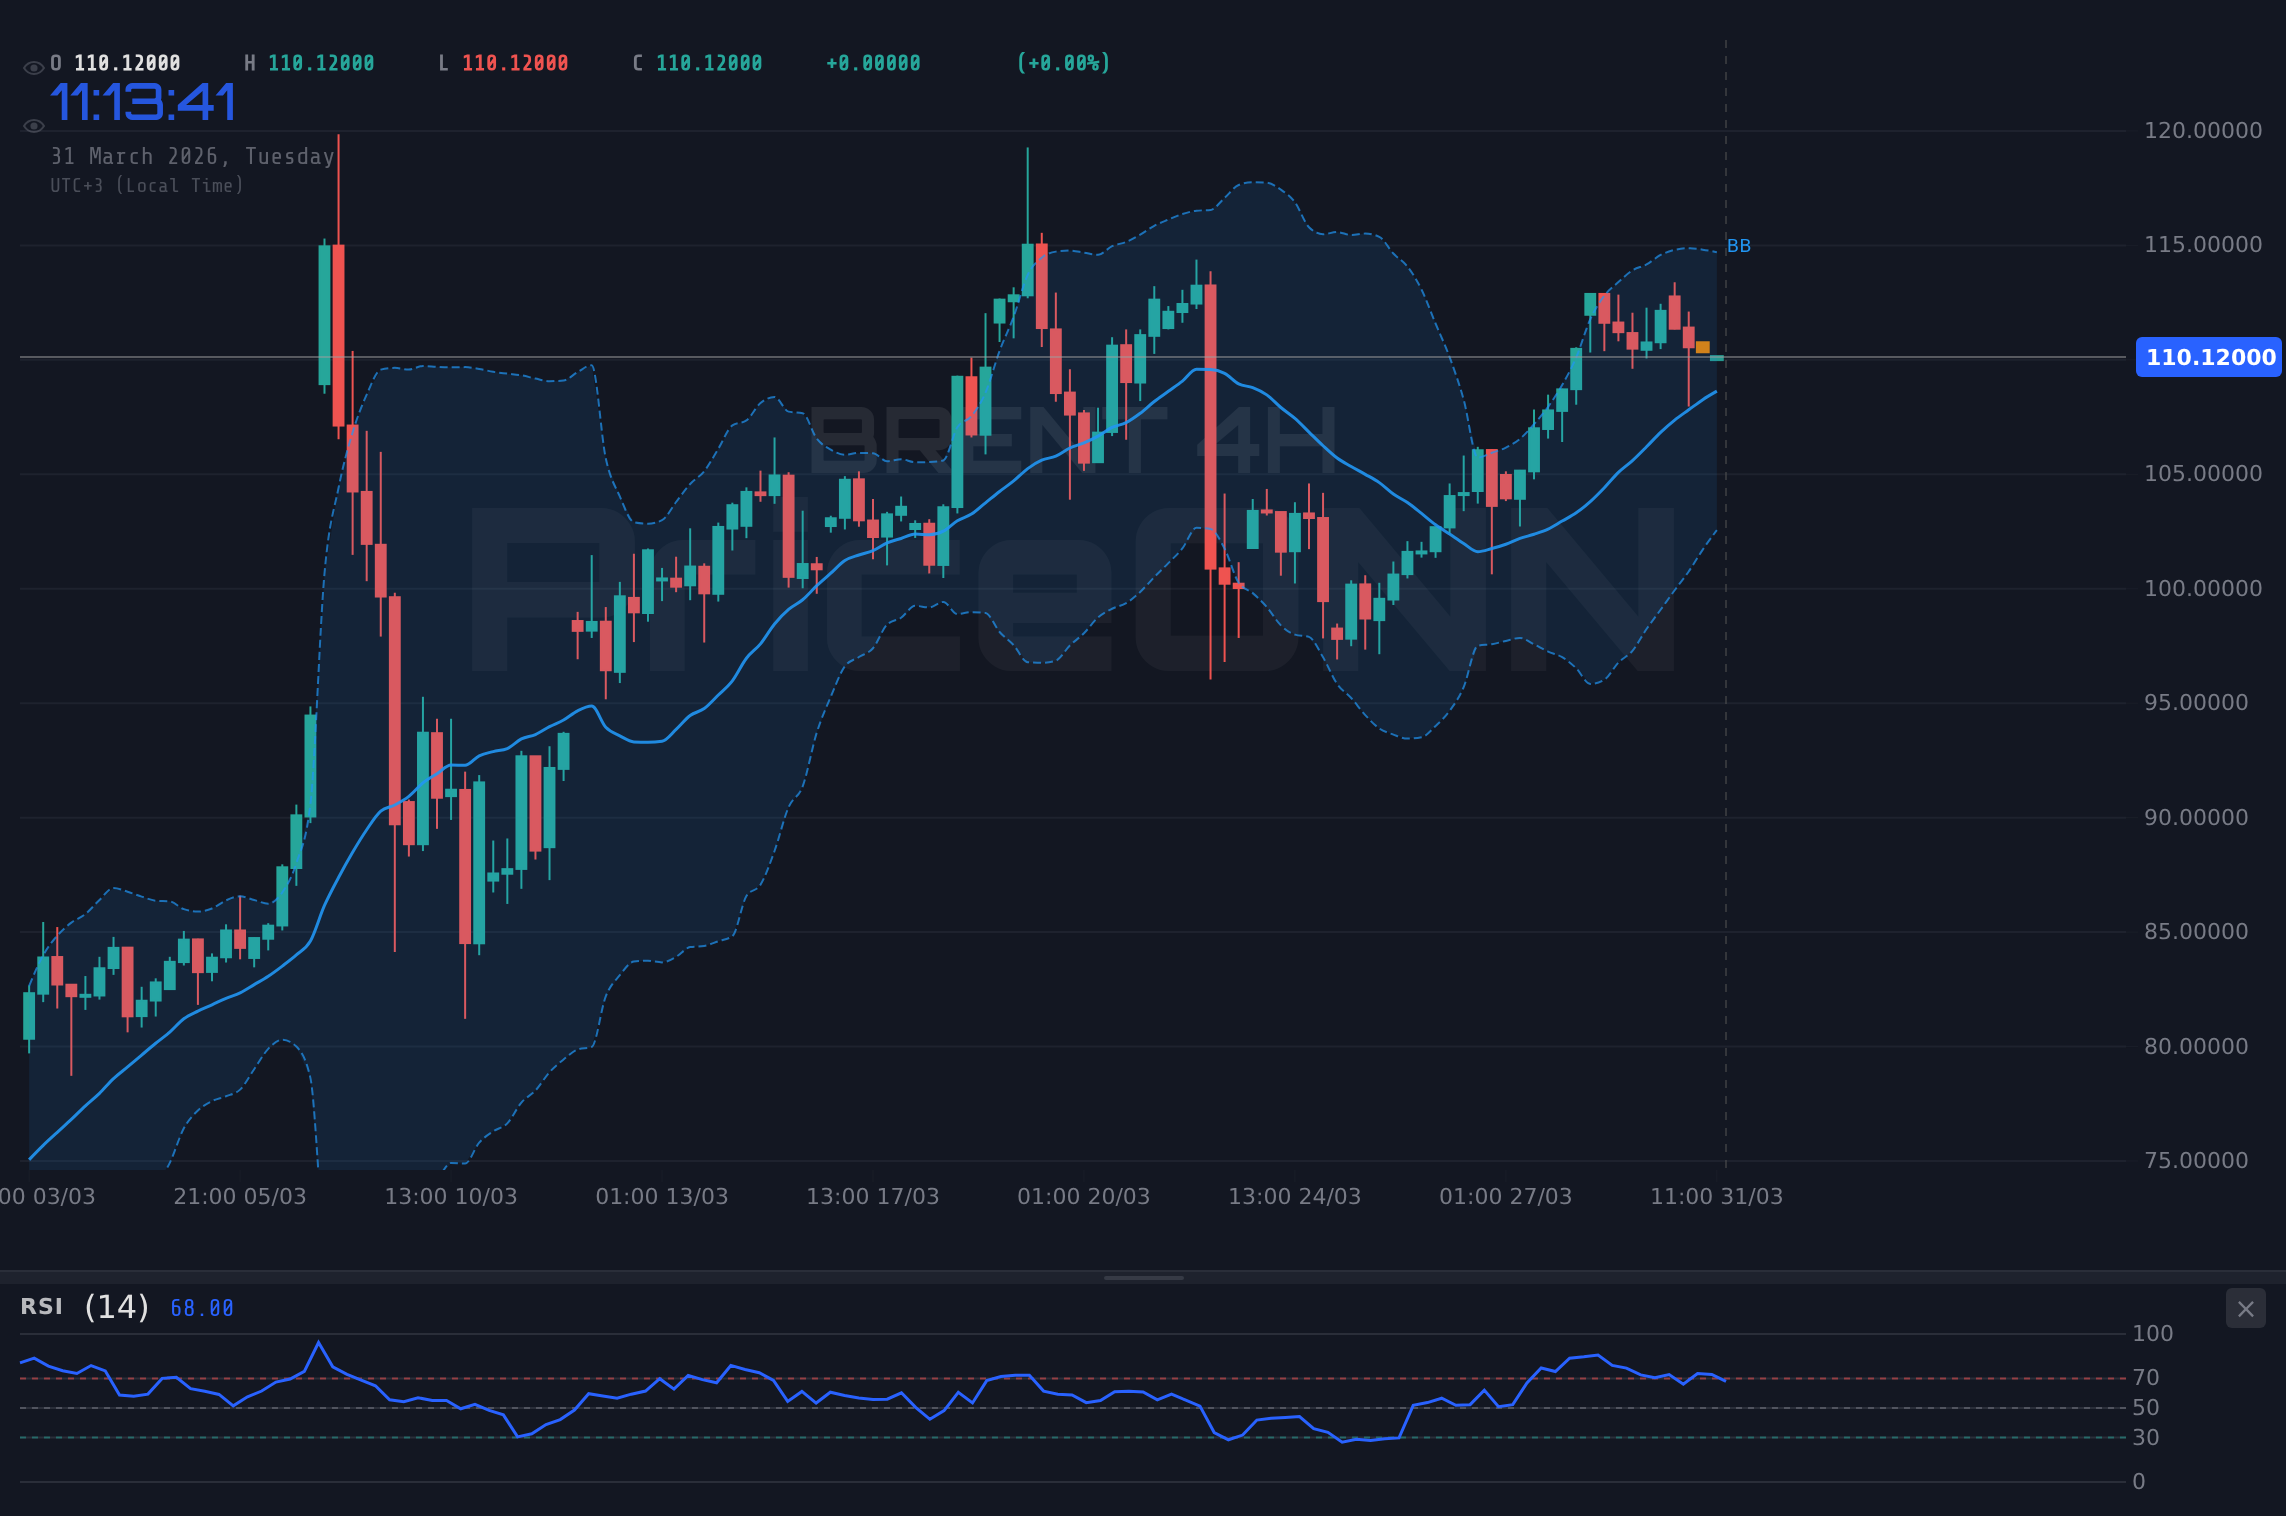
Brent crude oil is currently trading around $110.28, a critical juncture where the market is grappling with conflicting signals from technical indicators and a complex global geopolitical landscape. The recent price action, while showing some upward momentum on a 4-hour and daily basis, is encountering significant resistance, as evidenced by the intraday price action and the overall mixed signals across different timeframes. This juncture demands a closer look at not just oil-specific factors but also the broader macroeconomic environment, including the US Dollar's strength, equity market sentiment, and ongoing geopolitical tensions, particularly in the Middle East. Understanding these intermarket dynamics is crucial for deciphering the next potential move for Brent.
- Brent crude is trading near $110.28, testing resistance levels with mixed signals across timeframes.
- Daily RSI at 67.43 indicates upward momentum but remains in neutral territory, suggesting caution.
- Key resistance is noted at $113.50, while support lies around $110.19, a crucial level to watch.
- Geopolitical risks, particularly in the Middle East, continue to be a significant driver, alongside DXY movements and equity market sentiment.
- A confirmed daily close above $113.50 is needed to signal a stronger bullish continuation.
Navigating the Brent Crude Price Action at $110.28
The current price of Brent crude at $110.28 presents a fascinating technical puzzle. On the 1-hour chart, the trend is described as 'Uplifting (Strength: 82%)' with a neutral RSI reading of 49.45, indicating a lack of strong conviction. However, the MACD is showing negative momentum, with the histogram below the signal line, and the Stochastic Oscillator is in a tradeable zone (K=42.97, D=39.6), suggesting potential upward movement. This 1-hour picture, however, contrasts with the daily timeframe where the ADX stands at a robust 62.25, signaling a very strong uptrend. This divergence across timeframes underscores the complexity of the current market environment for Brent. The ADX at 13 on the 1-hour chart is particularly noteworthy; such a weak trend reading implies that the market is choppy and a breakout lacks commitment, making it a risky environment for aggressive trades. This is precisely the condition that would create a valid setup: a sustained move above resistance or a clear breakdown below support, confirmed by increasing volume and clearer indicator signals, would be needed to establish a high-probability trade.
The 4-hour chart paints a slightly more optimistic picture for the bulls, with a trend strength of 88% and positive momentum indicated by the MACD. The RSI at 57.88 is in neutral territory, showing room for upward movement, while the Stochastic's K line crossing above the D line suggests buyers are gaining traction. Yet, the ADX of 16.13 still points to a weak trend, indicating that this upward movement might be more of a consolidation phase within a larger range rather than a definitive breakout. The conflict between the strong daily uptrend signal (ADX 62.25) and the weaker, more range-bound signals on shorter timeframes is the core of the current trading dilemma. Traders are left to weigh the long-term bullish conviction against the short-term indecision.
The Critical Role of Support and Resistance Levels
At $110.28, Brent crude is hovering near a significant resistance zone. The immediate resistance level on the 1-hour chart is identified at $110.65, followed by $111.08 and $111.34. A decisive break and hold above these levels would be necessary to confirm a bullish continuation. Conversely, support is found at $109.96 on the 1-hour chart, with further levels at $109.70 and $109.27. The daily timeframe presents more substantial levels: resistance at $113.50, $114.87, and $116.81, and support at $110.19, $108.25, and $106.88. The current price is precariously positioned between the immediate 1-hour resistance and the more significant daily support. A failure to overcome the $110.65-$111.34 resistance zone could see prices retreat towards the $109.96 support level. The $110.19 level on the daily chart is particularly critical; a sustained hold above this point is essential for maintaining the bullish bias derived from the longer-term trend. A break below $109.27 on the 1-hour chart would signal a short-term bearish reversal, potentially targeting the daily support at $110.19.
Intermarket Analysis: DXY, Equities, and Brent's Dance
The performance of Brent crude cannot be viewed in isolation. The US Dollar Index (DXY), currently trading at 100.28, is a key correlated asset. A rising DXY typically exerts downward pressure on commodities priced in dollars, including oil. With the DXY showing a strong uptrend on the daily chart (ADX 33.32) and currently testing resistance, the dollar's strength could be a headwind for Brent. The RSI at 71.25 on the 1-hour DXY chart is also flashing an overbought signal, suggesting a potential pullback in the dollar, which could offer some relief to oil prices. However, the overall daily trend for DXY remains firmly bullish, indicating that any dollar weakness might be temporary.
Equity markets also play a crucial role. The S&P 500 is currently at 6405.15, showing a strong daily uptrend, but its 1-hour chart suggests a potential pullback with an RSI of 55.73 and Stochastic in the overbought zone. Similarly, the Nasdaq 100, trading at 23174.74, shows a bearish trend on the 4-hour and daily charts, despite some 1-hour strength. This mixed sentiment in equities suggests a cautious risk appetite, which could limit demand for riskier assets like oil, or conversely, lead to a flight to safety, potentially benefiting oil if geopolitical risks escalate. The Dow Jones Industrial Average at 45669 is also showing a similar mixed picture, with a strong daily downtrend contradicting short-term bullish signals. This overall cautious sentiment in major US indices creates an uncertain backdrop for Brent, making the geopolitical narrative even more influential.
The correlation between oil prices and inflation expectations is undeniable. With Brent crude trading above $110, it contributes to inflationary pressures globally. This dynamic puts central banks in a difficult position. The Federal Reserve, for instance, is navigating a complex path, and higher oil prices could complicate their efforts to manage inflation. The market is keenly watching for any signals from central bank policy shifts that could impact global growth and, consequently, oil demand. The recent news about Japan tapping strategic reserves due to Middle East tensions highlights the sensitivity of supply to geopolitical events. This move, while aimed at stabilizing prices, also underscores the underlying supply-side risks that continue to support a higher floor for oil prices, even amidst demand concerns.
Geopolitical Tensions: The Unseen Hand on Oil Prices
The ongoing geopolitical situation, particularly in the Middle East, remains a significant factor underpinning oil prices. While specific news regarding direct escalations might be muted at times, the underlying tensions create a persistent risk premium in the oil market. Any flare-up, whether in the form of supply disruptions, increased shipping risks, or political rhetoric, can trigger sharp price movements. The market's sensitivity to these events is amplified by the already tight supply-demand balance. Analysts are closely monitoring developments in regions critical for oil production and transit. The release of strategic reserves by Japan is a direct response to these heightened risks, signaling a level of concern among major consuming nations. This geopolitical backdrop provides a fundamental floor for Brent prices, even when technical indicators suggest a potential pullback. The price action at $110.28 is, therefore, not just a function of supply and demand but also a reflection of perceived geopolitical risk.
The recent news highlighting the surge in crude oil prices amidst global growth fears is a prime example of this dynamic. It suggests that supply-side concerns, driven by geopolitical events, are currently outweighing demand-side worries stemming from a potentially slowing global economy. This is a crucial divergence from typical market behavior where weak growth usually leads to lower commodity prices. For Brent, this means that while macroeconomic headwinds exist, the geopolitical risk premium is playing a dominant role. This narrative also influences the US Dollar, as highlighted by the Forex news mentioning the dollar resisting inflationary pressures as oil prices surge past $100. A sustained period of high oil prices, fueled by geopolitics, could force central banks to maintain a tighter monetary policy stance for longer, which in turn could dampen global growth prospects but also support the dollar as a safe-haven asset.
Trading Scenarios: What the Charts Suggest
Considering the current technical setup and the prevailing market conditions, several scenarios are plausible for Brent crude. The most immediate technical challenge is breaking through the resistance cluster around $110.65-$111.34. If Brent can achieve a decisive daily close above $113.50, it would likely trigger a significant bullish move, targeting higher resistance levels. This scenario hinges on sustained positive momentum, confirmation from indicators like RSI moving above 70, and a potential weakening of the DXY. Conversely, a failure to break higher could lead to a retracement. A break below the critical daily support at $110.19, followed by a close below $109.27 on the 1-hour chart, would invalidate the bullish thesis and open the door for a move towards the $108.25 level. The current ADX readings suggest that any move might be choppy until clearer directional signals emerge.
Bearish Scenario: Consolidation and Retreat
65% ProbabilityBullish Scenario: Breakout Above Resistance
25% ProbabilityNeutral Scenario: Range-Bound Trading
10% ProbabilityThe Path Forward: What to Watch for Brent Crude
The market is currently in a delicate balance. While the daily trend for Brent crude remains bullish, supported by strong ADX readings and the underlying geopolitical risk premium, the shorter-term charts present a more cautious picture. The price action around $110.28 is a critical test. A sustained push above the $110.65-$111.34 resistance zone, confirmed by rising RSI and positive MACD momentum on shorter timeframes, could signal a continuation of the uptrend. However, failure to do so, coupled with a DXY rally or a significant shift in risk sentiment, could lead to a pullback towards the $110.19 daily support level. Traders should remain vigilant, paying close attention to the interplay between geopolitical news, central bank policy expectations, and the technical levels. Patience will be key; waiting for a clear breakout above resistance or a confirmed breakdown below support will be crucial for a higher probability trade setup. The market always gives a second chance, and in this choppy environment, it's wise to wait for confirmation rather than forcing a trade.
Technical Outlook Summary
| Indicator | Value | Signal | Interpretation |
|---|---|---|---|
| RSI (14) | 67.43 | Neutral | Suggests upward momentum but room to move higher; nearing overbought territory. |
| MACD Histogram | 0.17 | Bullish | Positive momentum building on the daily chart. |
| Stochastic | 64.24 / 43.09 | Bullish | %K above %D signals potential upside. |
| ADX | 62.25 | Strong Trend | Indicates a very strong established uptrend on the daily chart. |
| Bollinger | Middle Band | Bullish | Price is trading above the middle band, indicating bullish bias. |
Frequently Asked Questions: BRENT Analysis
What happens if BRENT breaks decisively above $113.50 resistance?
A confirmed daily close above the $113.50 resistance level would likely trigger a significant bullish continuation. This would suggest that the market is pricing in sustained geopolitical risk premium and potentially stronger global demand, opening the door for further upside towards $114.87 and potentially $116.81.
Should I buy BRENT at current levels of $110.28 given the mixed signals?
Buying at current levels carries risk due to conflicting signals across timeframes and the proximity to resistance. A higher probability setup would involve waiting for a confirmed breakout above $113.50 or a clear bounce from daily support around $110.19, ideally with improved indicator alignment.
Is the daily RSI at 67.43 a sell signal for BRENT right now?
An RSI of 67.43 on the daily chart indicates strong upward momentum but is not yet in overbought territory (typically considered above 70). While it suggests caution and potential for consolidation, it does not inherently signal a sell. A move above 70 would increase the probability of a pullback or consolidation.
How will the ongoing Middle East tensions affect BRENT prices this week?
Heightened geopolitical tensions in the Middle East are a primary driver supporting Brent prices by introducing a significant risk premium. Any escalation or perceived threat to supply routes could push prices higher, potentially testing resistance levels, even if broader economic concerns suggest otherwise.
Track markets in real-time
AI-powered analysis, technical indicators and real-time price data.
Join Our Telegram Channel
Breaking market news, AI analysis and trading signals instantly.
Join Channel