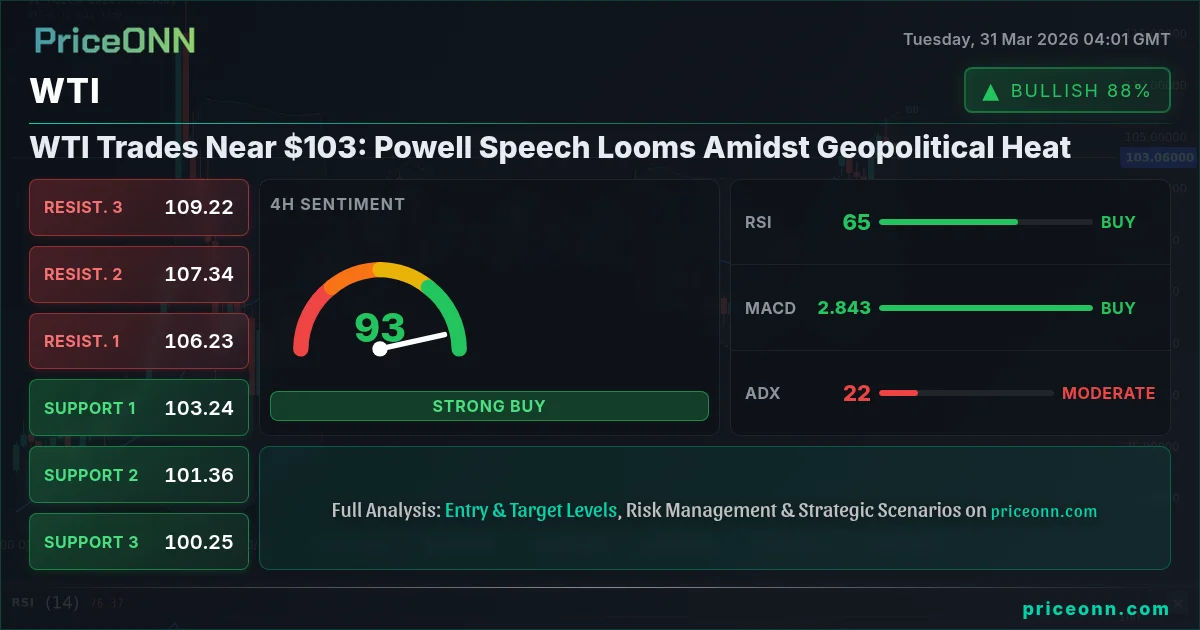
WTI Trades Near $103: Powell Speech Looms Amidst Geopolitical Heat
WTI crude hovers around $103.26 as geopolitical tensions and upcoming Fed commentary create market uncertainty. Analysis suggests a cautious outlook.
The volatile dance around the $103 mark for WTI crude oil continues, as traders grapple with a complex tapestry of geopolitical tensions, central bank anticipation, and shifting market sentiment. With the price currently sitting at $103.26, the market is at a critical juncture, caught between the potential for further upside driven by supply fears and the risk of a pullback should demand falter or a diplomatic breakthrough emerge. This analysis delves into the competing forces shaping WTI's trajectory, dissecting the bull and bear arguments to provide a clear roadmap for traders navigating this complex environment.
- WTI crude is trading at $103.26, a critical level influenced by geopolitical events and upcoming Fed commentary.
- Critical support for WTI is observed at $103.24, with key resistance looming at $104.08.
- The ADX at 22.2 indicates a moderate trend, while RSI at 54.12 suggests room for upward movement but caution is advised.
- Geopolitical factors, particularly Middle East tensions and Russian energy movements, are key drivers, while Powell's speech will be crucial for demand outlook.
The Bulls' Case: Supply Shocks and Inflationary Pressures
The bullish sentiment surrounding WTI crude oil finds strong footing in the escalating geopolitical landscape. The ongoing conflict in the Middle East, as highlighted by recent news of Russian fuel voyages testing U.S. policy and escalating conflict triggering global fuel price surges, continues to cast a long shadow over supply stability. When crude oil prices jump over 3%, as they did recently reaching $102.69 per barrel, it's a clear signal that the market is pricing in significant supply disruptions. This fear premium is a potent driver for prices, especially when combined with Europe's recurring energy crisis, exacerbated by geopolitical tensions affecting vital supplies. The current price of $103.26 for WTI reflects this underlying anxiety about potential supply shortfalls, a sentiment that is difficult to ignore.
Furthermore, the correlation between oil prices and inflation expectations cannot be overstated. As crude oil prices push higher, they directly contribute to rising energy costs, which then ripple through the economy, impacting transportation, manufacturing, and consumer goods. The news that Middle East conflict fuels global fuel price surges leading to steep increases underscores this inflationary pressure. This creates a challenging environment for central banks, including the Federal Reserve, which are already battling persistent inflation. The market's reaction to this inflationary pressure often involves a preemptive move into commodities as a hedge, further supporting prices. The resilience of WTI around the $103.26 level, despite broader market fluctuations, speaks to the persistent demand for oil as an inflation hedge.
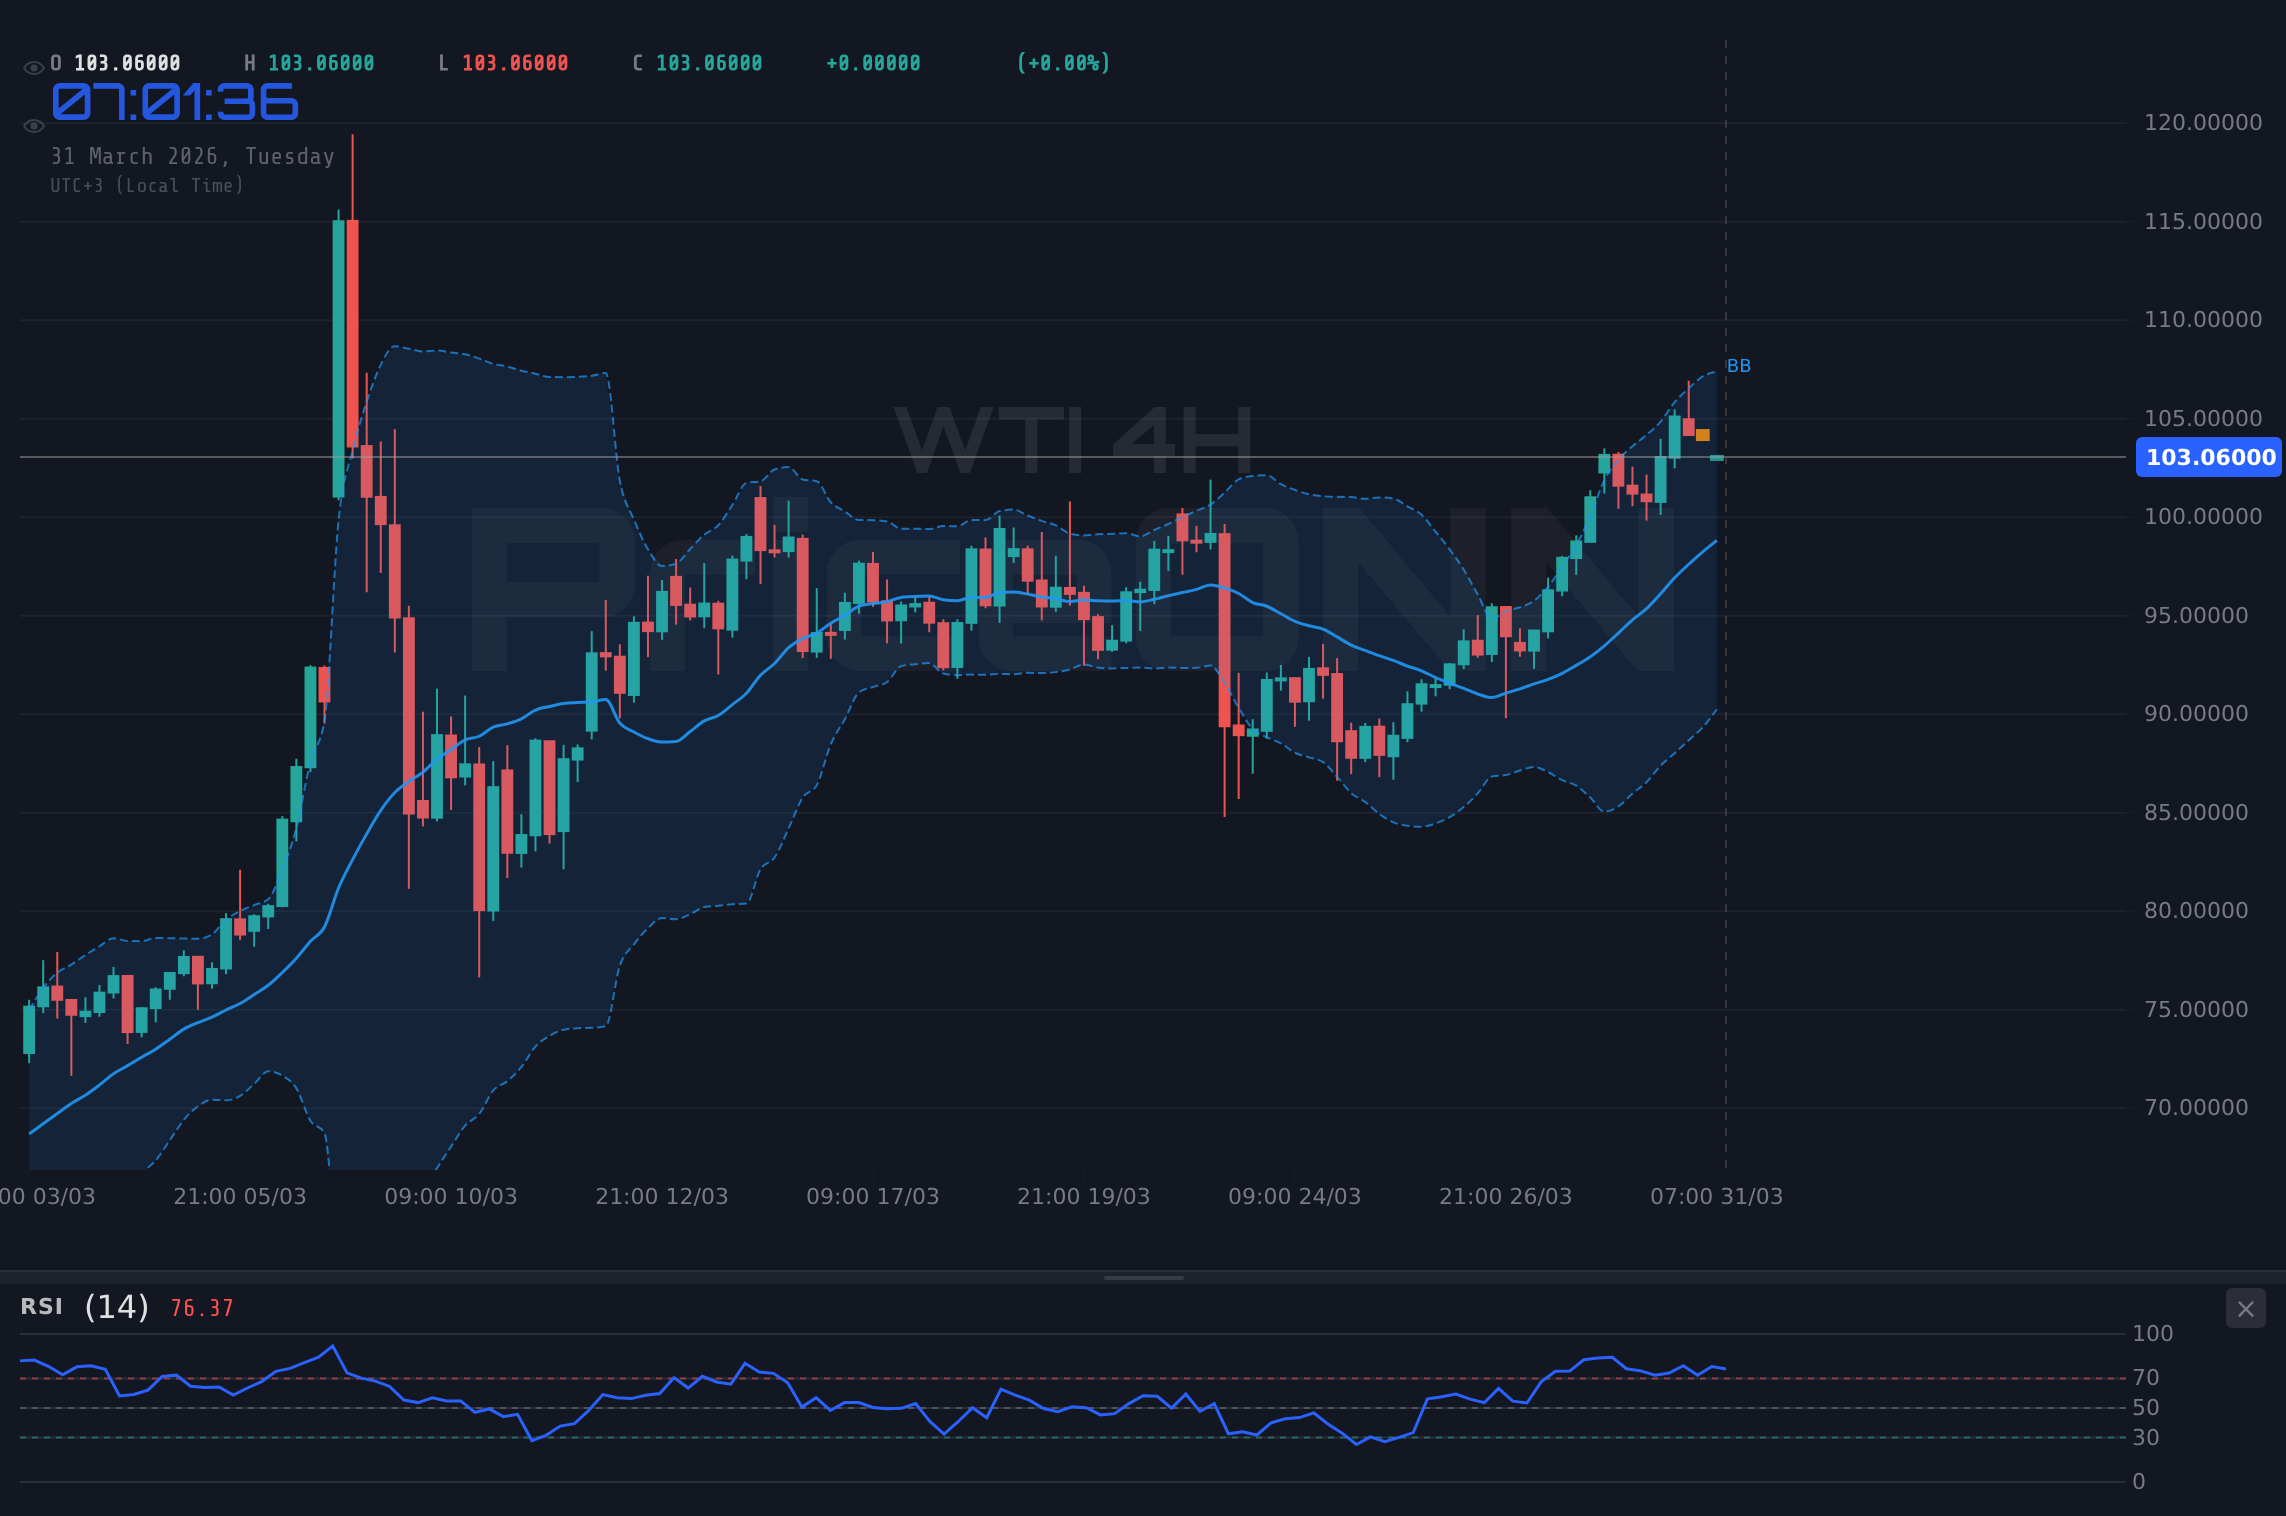
Technically, the 1H chart presents a cautiously optimistic picture for the bulls. The RSI(14) at 54.12, while not yet in overbought territory, shows an upward eğilim, suggesting room for prices to climb. The MACD is also exhibiting positive momentum, with the MACD line sitting above its signal line. The Stochastic oscillator, with K=33.48 and D=73.98, is currently showing a bearish signal (%K < %D), which tempers immediate upside enthusiasm, but the overall trend strength indicated by ADX at 26.16 suggests that any upward move could gain traction if confirmed by other indicators. The 4H chart echoes this, with RSI at 64.68 and MACD positive, albeit with Stochastic showing an overbought condition and ADX at a moderate 22.2. The daily chart, however, paints a more robust bullish picture, with RSI at 67.17 in the neutral-to-bullish zone and a very strong ADX of 62.25 indicating a powerful uptrend is in place. This confluence of upward-leaning technicals on multiple timeframes, particularly the daily, provides a solid foundation for the bullish argument, suggesting that the $103.26 price point could be a launchpad for further gains.
The Bears' Case: Demand Worries and Fed's Shadow
Despite the bullish narrative fueled by supply-side anxieties, the bearish case for WTI crude oil is equally compelling, primarily centered on concerns about global demand and the looming specter of tighter monetary policy. The fact that the Dow Jones Industrial Average surged on hints of geopolitical easing, as reported by WSJ, suggests that any de-escalation in the Middle East could quickly extinguish the current risk premium embedded in oil prices. If tensions subside, the price of WTI could rapidly shed its geopolitical premium, potentially falling back towards levels dictated by fundamental supply and demand dynamics, which may not currently support prices above $103.26. The recent news about Russia-Cuba fuel voyages testing U.S. policy, while potentially disruptive in the short term, also hints at a complex global energy scramble where supply routes are constantly being rerouted and adapted, potentially mitigating immediate supply shocks.
More significantly, the Federal Reserve's stance on inflation and interest rates casts a long shadow over demand prospects. While the market is currently trading around $103.26, any indication from Fed Chair Powell's upcoming speech that suggests a more hawkish approach to inflation control could dampen economic activity and, consequently, oil demand. Higher interest rates typically translate to slower economic growth, reduced consumer spending, and lower industrial output, all of which directly impact the appetite for crude oil. The historical correlation is clear: when central banks prioritize inflation reduction through monetary tightening, risk assets and commodities often suffer. The market's sensitivity to Fed commentary is paramount, and any hint of sustained higher rates could trigger a significant sell-off in oil, invalidating the current bullish setup.
Technically, the bearish argument finds support in the conflicting signals across different timeframes. While the 1H chart shows some bullish signs, the Stochastic indicator flashing a bearish signal and the ADX at 26.16 indicating a strong downtrend on the daily chart cannot be ignored. The 4H chart presents a mixed picture, but the daily timeframe reveals a more concerning trend for the bulls. The RSI(14) at 39.74 on the daily chart is in the neutral-to-bearish zone, and while the MACD shows positive momentum on the 1H, it's negative on the 4H and 1D charts, indicating a potential weakening of the upward trend. The ADX at 62.25 on the daily chart, while indicating a strong trend, could be interpreted as the tail end of a bullish move if other oscillators turn bearish. The fact that WTI is trading near its 1H resistance of $104.08, while having significant support at $103.24, suggests a potential for a reversal if key levels fail to hold. The immediate resistance at $104.08 and the potential for a bearish divergence on shorter timeframes are key concerns for the bulls.
The Verdict: Navigating the Crossroads at $103.26
The current technical and fundamental landscape for WTI crude oil presents a classic bull vs. bear debate, with the price action hovering precariously around the $103.26 level. The bullish case is compelling, driven by persistent geopolitical risks in the Middle East and Europe, which threaten supply and fuel inflationary concerns. The very real possibility of further supply disruptions provides a solid floor under prices, as evidenced by the strong daily uptrend indicators. However, the bearish counterarguments are equally potent. Concerns over global demand, amplified by the prospect of aggressive monetary tightening from the Federal Reserve, could quickly erase any geopolitical premium. Powell's upcoming speech is the wildcard here; a hawkish tone could trigger a significant risk-off sentiment, impacting oil demand and prices. The conflicting signals across technical indicators, particularly the bearish Stochastic on the 1H and 4H charts, and the strong downtrend indicated by the daily ADX, suggest that the market is at an inflection point.
Considering the confluence of factors, the immediate outlook appears to favor caution. While geopolitical events continue to provide a floor, the potential for a demand-side shock stemming from central bank policy cannot be underestimated. The $103.26 level represents a battleground where these opposing forces are clashing. A decisive break above the 1H resistance at $104.08, supported by positive news flow and a dovish signal from Powell, could embolden the bulls to target higher levels. Conversely, a failure to hold the immediate support at $103.24, coupled with hawkish Fed rhetoric or a de-escalation in the Middle East, could see prices quickly retreat. The strength of the daily uptrend indicated by ADX 62.25 is a significant factor for the bulls, but the conflicting signals from shorter-term oscillators and the broader macro uncertainty necessitate a risk-aware approach.
The key for traders will be to watch for confirmation signals. A bullish scenario requires a clear break and hold above the $104.08 resistance, ideally accompanied by a softening in geopolitical tensions or a dovish Fed outlook. On the flip side, a bearish scenario would be confirmed by a break below the $103.24 support, especially if accompanied by hawkish Fed commentary or positive news from the Middle East. The neutral scenario, characterized by consolidation around the $103.26 level, remains a distinct possibility as the market awaits definitive catalysts.
Bearish Scenario: Geopolitical De-escalation & Fed Tightening Fears
60% ProbabilityBullish Scenario: Supply Shock Reinforcement & Dovish Fed
30% ProbabilityNeutral Scenario: Consolidation Ahead of Powell Speech
10% ProbabilityFrequently Asked Questions: WTI Analysis
What happens if WTI breaks below the $103.24 support level amid Fed tightening fears?
If WTI breaks below $103.24, the bearish scenario gains strong traction. This could trigger a move towards the $102.99 level, influenced by potential demand destruction from a hawkish Fed outlook. The daily support at $101.47 would become the next significant downside target.
Should I buy WTI at current levels of $103.26 given the bullish daily ADX reading?
Buying at current levels requires caution. While the daily ADX at 62.25 supports a bullish trend, the immediate 1H resistance at $104.08 and conflicting shorter-term oscillators suggest a potential pullback. A confirmed break above $104.08, especially with dovish Fed signals, would offer a higher-probability bullish entry.
Is the RSI at 54.12 on the 1H chart a buy signal for WTI?
An RSI of 54.12 on the 1H chart indicates neutral to slightly bullish momentum, suggesting room for upward movement without being overbought. However, it's not a standalone buy signal. Confirmation from other indicators like MACD and price action breaking key resistance levels would be needed for a stronger bullish conviction.
How will Fed Chair Powell's upcoming speech affect WTI prices around $103.26 this week?
Powell's speech is a critical catalyst. A hawkish tone regarding inflation control could dampen oil demand expectations, potentially pushing WTI below $103.24. Conversely, a dovish stance might reinforce the bullish geopolitical premium, supporting prices above $104.08, especially if Middle East tensions persist.
Navigating the WTI market at $103.26 demands a keen eye on both geopolitical developments and central bank policy. The tension between supply-driven price support and demand-side risks creates a challenging but potentially rewarding environment for disciplined traders. Patience and a clear strategy, focusing on key price levels and confirmation signals, will be crucial in capitalizing on the opportunities that emerge from this dynamic interplay.
| Indicator | Value | Signal | Interpretation |
|---|---|---|---|
| RSI (14) | 54.12 | Neutral | Suggests room for upward movement, but caution needed. |
| MACD Histogram | Positive | Bullish Momentum | MACD line above signal line indicates positive momentum. |
| Stochastic | K=33.48, D=73.98 | Bearish Signal | %K below %D suggests potential short-term pullback. |
| ADX | 26.16 | Moderate Trend | Indicates a developing trend, but not yet strongly established. |
| Bollinger Bands | Mid Band | Above Mid Band | Price trading above the middle band suggests upward pressure. |
Track markets in real-time
AI-powered analysis, technical indicators and real-time price data.
Join Our Telegram Channel
Breaking market news, AI analysis and trading signals instantly.
Join Channel