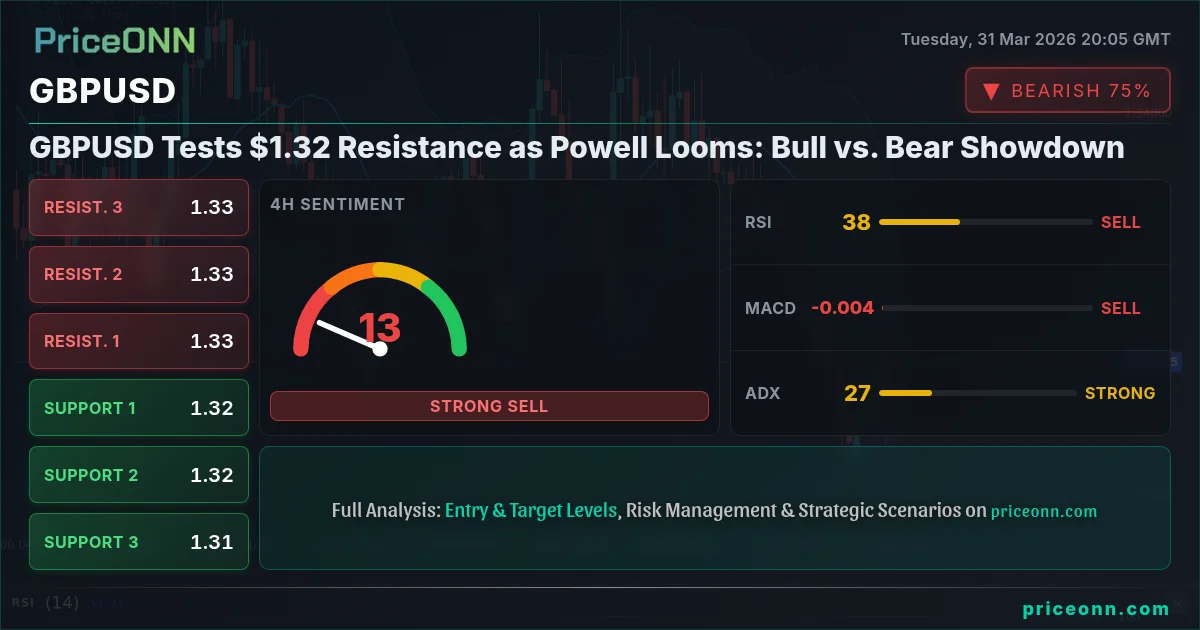
GBPUSD Tests $1.32 Resistance as Powell Looms: Bull vs. Bear Showdown
GBPUSD hovers near $1.32, facing key resistance. With Powell's speech imminent, traders brace for volatility. Bullish hopes clash with bearish signals.
The currency pair GBPUSD is currently locked in a fierce battle near the critical $1.32 level, a price point that is proving to be a significant battleground between bulls and bears. As traders digest a complex mix of technical signals and anticipate the influential words of Federal Reserve Chair Jerome Powell, the market sentiment remains decidedly mixed. This pivotal juncture demands a closer look at the forces at play, from the immediate technical landscape to the broader macroeconomic currents shaping the pair's trajectory. The question on everyone's mind is whether the upward momentum can conquer the looming resistance and Powell's potential hawkish pronouncements, or if a reversal is on the horizon.
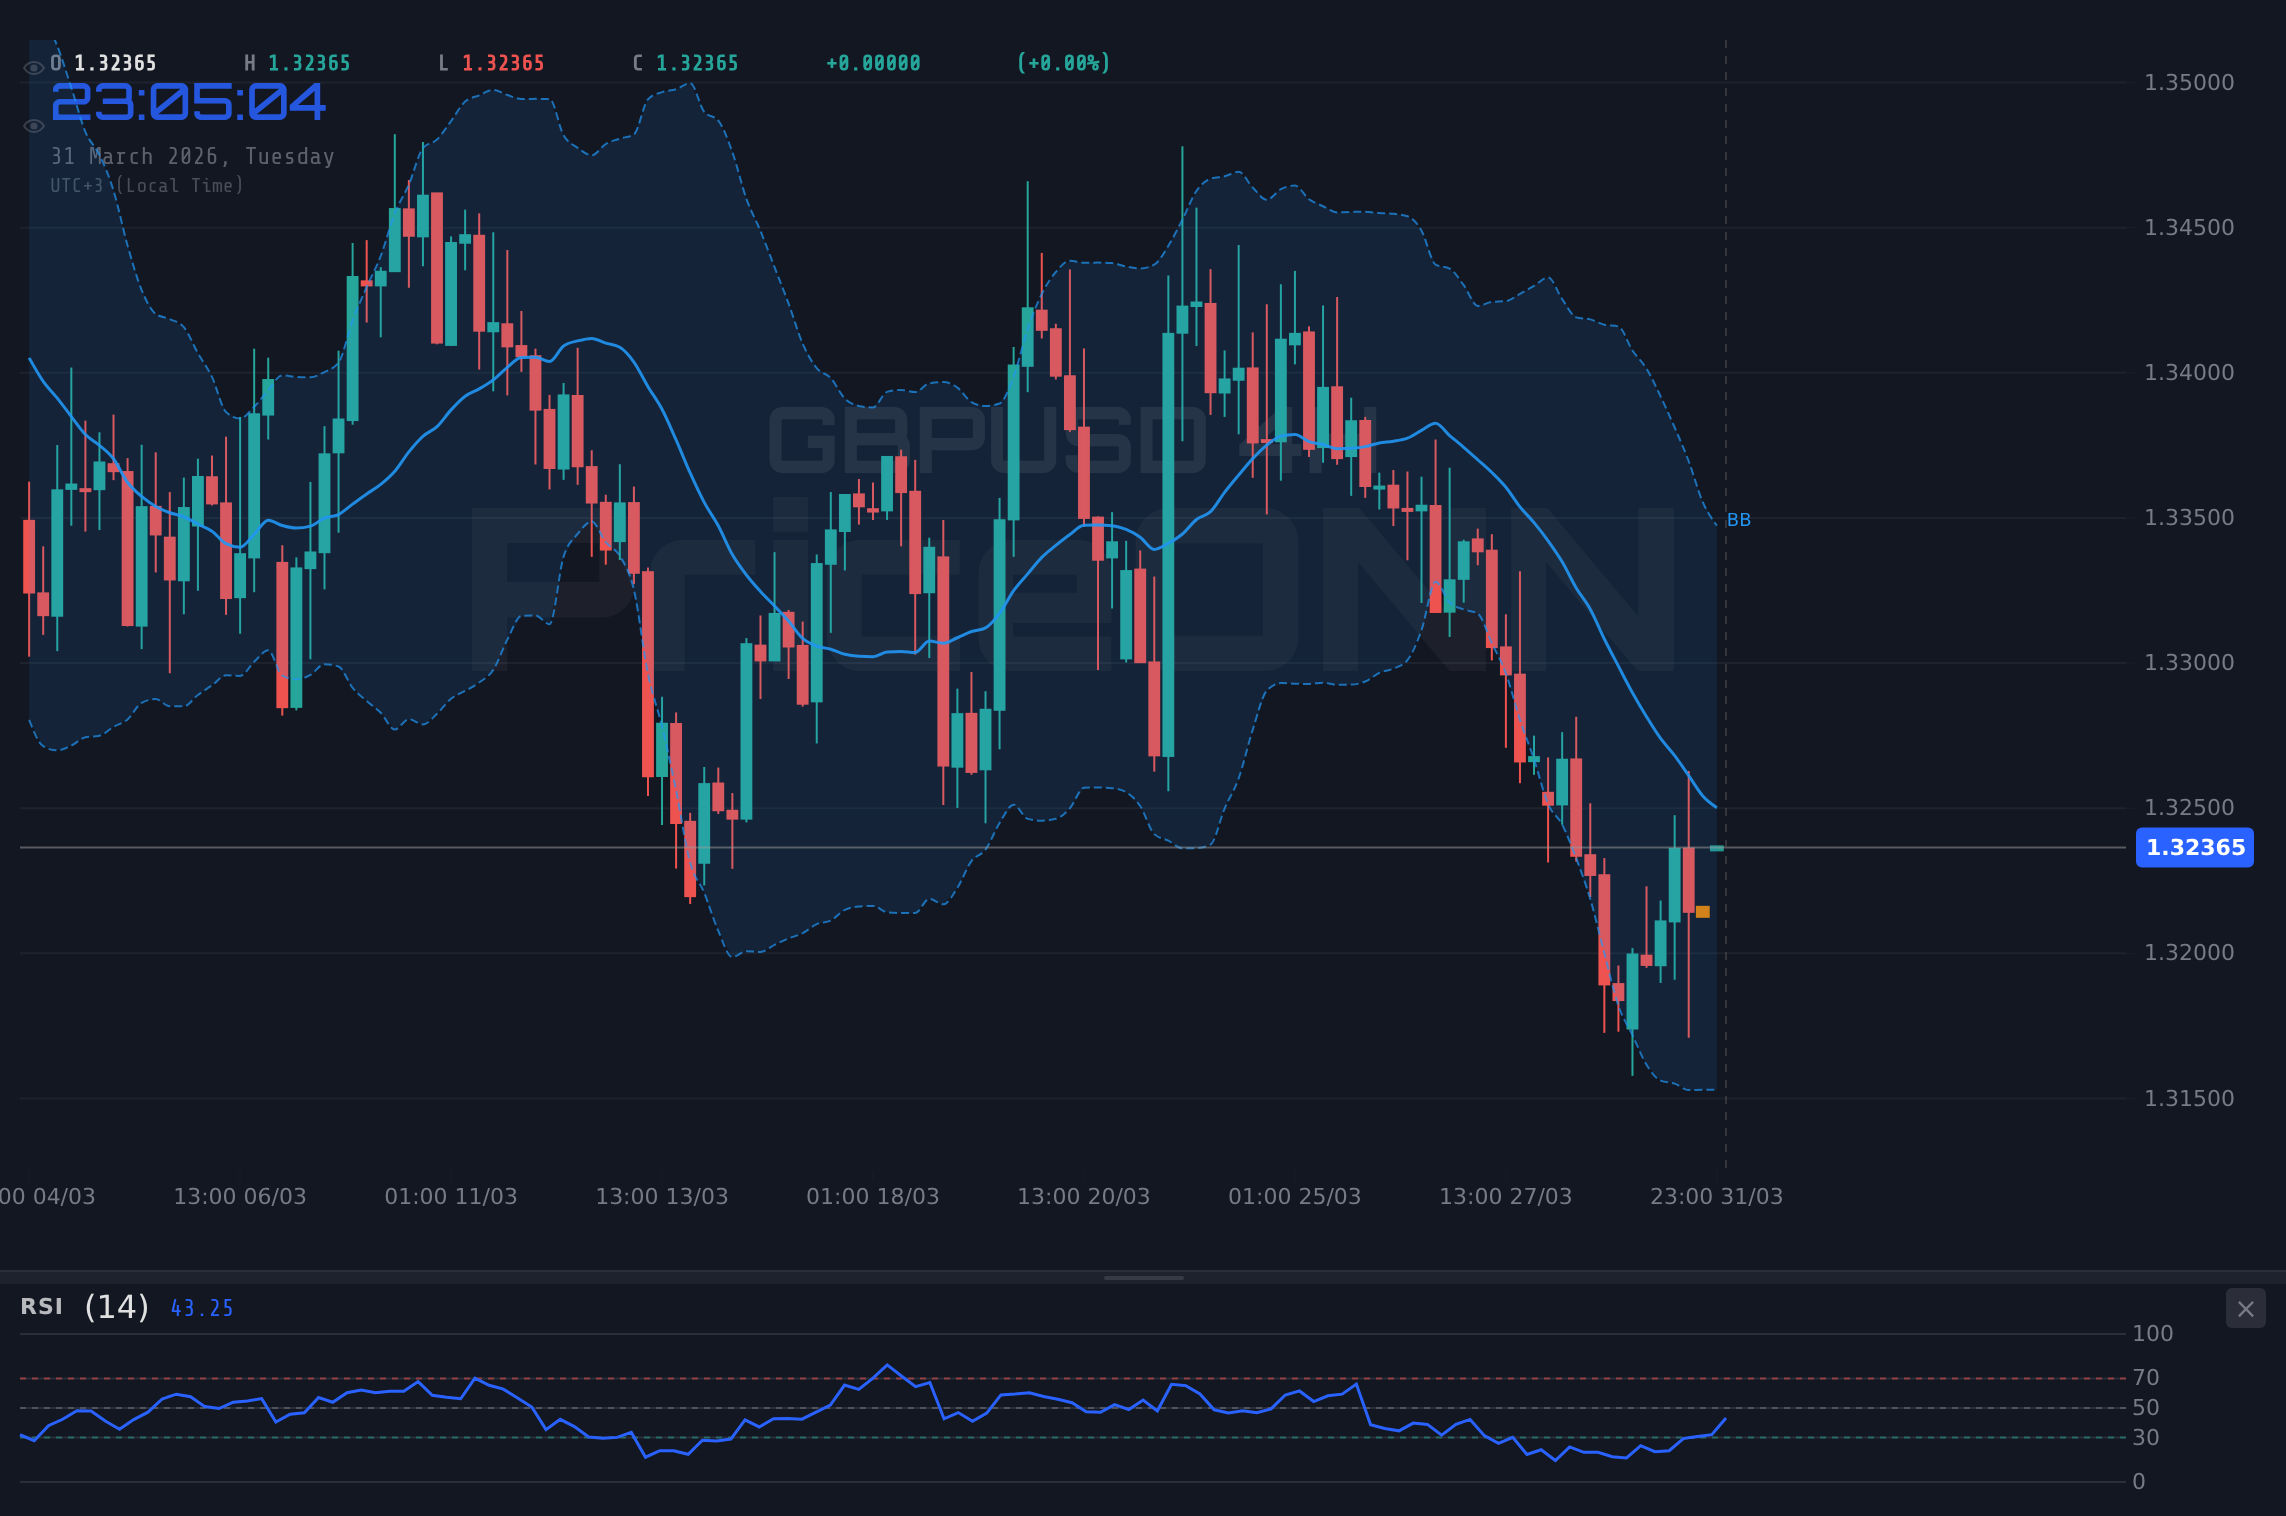
- GBPUSD is testing resistance around $1.32383, with RSI at 55.2 signaling upward momentum but not yet extreme overbought conditions.
- Key resistance is observed at $1.32609, while immediate support lies at $1.32197 according to 1H data.
- The US Dollar Index (DXY) is at 99.59, showing a bearish trend on 1H and 4H, which typically supports GBPUSD.
- Federal Reserve Chair Powell's upcoming speech is a major event risk, potentially shifting market expectations on interest rates and impacting GBPUSD.
- The 1D trend for GBPUSD remains bearish, with ADX at 32.65 indicating strong downward momentum, creating a conflict with shorter-term bullish signals.
The Bulls' Charge: Why $1.32 Could Be a Springboard
The bulls are certainly making a concerted effort to push GBPUSD higher, and several technical indicators on the shorter timeframes offer them support. On the 1-hour chart, the price action has climbed to test resistance near $1.32609, currently trading at $1.32383. The RSI(14) is sitting at 55.2, which, while not yet in overbought territory, indicates a solid upward trend and suggests there's room for further gains before any significant selling pressure emerges. This is complemented by a positive MACD momentum, with the MACD line above its signal line, reinforcing the bullish sentiment on this timeframe. The Stochastic Oscillator, with %K at 64.67 and %D at 49.47, also shows a bullish crossover and is moving upwards, further validating the short-term buying interest. The ADX at 14.45 might indicate a weaker trend overall, but in this context, it suggests that the current upward move has not yet met significant headwinds, allowing the price to grind higher.
Furthermore, the broader market context, particularly the performance of the US Dollar Index (DXY), lends some credence to the bullish case for GBPUSD. The DXY is currently trading at 99.59, and importantly, its 1-hour and 4-hour charts show a bearish trend. A weaker dollar generally translates to strength in pairs like GBPUSD, as it means the US currency is losing value against other major currencies, including the British Pound. This inverse correlation is a classic dynamic in forex markets, and if the dollar continues to weaken, it could provide the necessary tailwind for GBPUSD to break through its current resistance levels. The recent news flow, while mixed, has also seen some positive sentiment regarding the UK economy, with reports of inflation figures potentially impacting the EUR/GBP pair, suggesting a degree of underlying strength in Sterling.
The 4-hour chart, while showing a bearish trend overall, does present a conflicting bullish signal from the Stochastic Oscillator (K=50.63, D=28.48), indicating a potential for a short-term bounce or consolidation before a further move. This divergence between the longer-term bearish trend and the shorter-term bullish indicators on the 1-hour chart, coupled with a weakening dollar, paints a picture of potential upside for GBPUSD. If buyers can successfully breach the $1.32609 resistance, the next logical targets would be the higher resistance levels identified on the 4-hour chart, potentially testing $1.32815 or even $1.33155. This scenario hinges on sustained buying pressure and a continued decline in the DXY.
The Bears' Stand: Why Caution is Warranted at $1.32
Despite the short-term bullish signals, a significant bearish case can be made for GBPUSD, primarily driven by longer-term technicals and the looming shadow of Federal Reserve policy. The daily (1D) timeframe paints a starkly different picture. The trend is firmly bearish, with an ADX of 32.65 indicating a strong downward trend is in place. This is a critical piece of information; a strong bearish trend on the daily chart often overrides shorter-term fluctuations. The RSI(14) on the daily chart is at 40.96, firmly in neutral territory but leaning towards a downward trend, suggesting that any upward moves might be met with selling pressure as the broader downtrend reasserts itself. The MACD is also showing negative momentum, with the MACD line below its signal line, reinforcing the bearish outlook.
Furthermore, the Bollinger Bands on the daily chart are positioned below the middle band, indicating a bearish bias and suggesting that the price is currently trading within a downward channel. The Stochastic Oscillator on the daily chart, with %K at 12.5 and %D at 43.3, shows a bearish crossover and is deep in oversold territory, which, while sometimes signaling a potential bounce, in the context of a strong downtrend can also indicate significant selling pressure. The fact that the 4-hour Stochastic is showing a bullish signal (K=50.63, D=28.48) while the daily Stochastic is bearish (K=12.5, D=43.3) highlights a key conflict in signals, suggesting that the current upward move might be a temporary retracement within a larger downtrend.
The most significant factor for the bears, however, is the impending speech from Federal Reserve Chair Jerome Powell. Market participants are acutely aware that any hint of a hawkish stance – suggesting higher-for-longer interest rates due to persistent inflation, perhaps exacerbated by rising oil prices as reported by Reuters and Bloomberg – could trigger a strong dollar rally. If the Fed signals a less dovish outlook, the DXY could reverse its recent decline sharply, putting immediate and significant downward pressure on GBPUSD. This risk is amplified by the fact that oil prices are surging, contributing to inflationary concerns globally, which central banks are keen to combat. A hawkish Fed response would likely see GBPUSD retreating sharply from the $1.32383 level, potentially falling back towards the daily support levels identified at $1.31438, $1.31038, and even $1.30349.
The Verdict: Navigating the Crosscurrents at $1.32
The current technical picture for GBPUSD presents a classic bull vs. bear scenario, with conflicting signals across different timeframes and significant fundamental risks on the horizon. On the 1-hour chart, momentum is bullish, supported by RSI and MACD readings, and aided by a weakening dollar index. This suggests that a short-term push higher is possible, aiming for resistance levels above $1.32609. However, the longer-term daily outlook remains decidedly bearish, with strong ADX and RSI trends indicating that any rallies might be corrective moves within a larger downtrend. The critical factor here is the Federal Reserve's stance, as articulated by Chair Powell. Any indication of a continued tight monetary policy, driven by inflation concerns potentially fueled by geopolitical tensions and rising oil prices, could rapidly shift the market sentiment and send the dollar soaring, thereby crushing any bullish aspirations for GBPUSD.
Given the strong bearish trend on the daily chart (ADX 32.65) and the potential for a hawkish Federal Reserve to strengthen the dollar, the probability leans towards caution for the bulls. While a short-term bounce towards $1.32609 is plausible, the risk of a reversal and a subsequent move lower seems more probable, especially if Powell's remarks are perceived as hawkish. The conflict between the 1-hour bullish signals and the daily bearish trend, coupled with the significant event risk from Powell's speech, creates a scenario where playing for a breakout above key resistance is highly speculative. It would require a substantial shift in Fed expectations or a significant weakening of the dollar to sustain such a move against the prevailing daily trend.
Therefore, the most prudent approach appears to be one of caution, with a bias towards the bearish scenario playing out, especially if the Federal Reserve signals a less accommodative stance. The $1.32383 level represents a critical juncture where the short-term optimism clashes with the long-term trend and potential fundamental headwinds. Traders should be prepared for increased volatility surrounding Powell's speech, as it could be the catalyst that dictates the direction for GBPUSD in the coming days and weeks. While a break higher is not impossible, the confluence of strong daily bearish indicators and the looming Fed event suggests that the path of least resistance might still be downwards.
The Intermarket Symphony: DXY, Oil, and the Fed's Shadow
To truly grasp the GBPUSD's predicament, we must broaden our view to include its key intermarket correlations. The US Dollar Index (DXY) is a critical barometer, and its current behavior offers a mixed signal. While the 1-hour and 4-hour charts show a bearish trend for the DXY, currently trading at 99.59, the daily chart presents a bullish trend. This divergence suggests that the dollar's weakness might be temporary, a mere pause before potentially resuming its strength, especially if the Federal Reserve maintains a hawkish tone. As reported, oil prices are surging, currently hovering above $100 and even $110 for Brent crude, due to Middle East tensions. This inflationary pressure is a double-edged sword for the Fed; it could force them to keep rates higher for longer to combat inflation, which would typically strengthen the dollar and pressure GBPUSD lower. Conversely, if the Fed signals concern about economic growth due to these pressures, it could lead to a less hawkish stance, weakening the dollar.
The performance of major US indices like the S&P 500 (6523.1) and Nasdaq 100 (23707.51) also plays a crucial role in risk sentiment. Both are showing strong upward momentum on shorter timeframes but a bearish trend on the daily chart, indicating a similar tug-of-war between short-term optimism and longer-term concerns. A significant risk-off event, perhaps triggered by geopolitical escalation or hawkish Fed commentary, could see these indices fall, driving demand for safe-haven assets like the dollar and potentially weighing on GBPUSD. The correlation between GBPUSD and risk sentiment is not always direct, but a broad market sell-off, driven by inflation and rate hike fears, would likely find GBPUSD struggling to maintain gains above $1.32.
The context of upcoming economic data, while not explicitly detailed for GBPUSD's direct drivers in the provided calendar, remains paramount. For instance, the Euro Area inflation figures are due, and a significant jump could influence ECB policy expectations, indirectly affecting GBPUSD through cross-currency dynamics. Similarly, any US data that reinforces inflationary concerns would bolster the case for a hawkish Fed, strengthening the dollar. The interplay between inflation, central bank policy, geopolitical risks, and risk appetite creates a complex web that traders must navigate. The $1.32 level for GBPUSD is not just a technical resistance; it's a confluence point where these macro forces are currently clashing.
Scenario Planning: Mapping the Potential Paths for GBPUSD
Given the conflicting signals and the significant event risk posed by Fed Chair Powell's upcoming speech, a scenario-based approach is essential for navigating GBPUSD. The probabilities assigned below reflect the current technical picture and the potential impact of the looming Fed commentary.
Bearish Scenario: Powell Pours Cold Water on Hopes
65% ProbabilityNeutral Scenario: Consolidation Amid Uncertainty
25% ProbabilityBullish Scenario: Powell Sparks Dollar Weakness
10% ProbabilityNavigating the Volatility: What Traders Should Watch
For short-term traders, the immediate focus will be on the $1.32609 resistance level on the 1-hour chart. A decisive break above this, especially if accompanied by increasing volume and a weakening DXY, could offer a brief window for a long position targeting the 4-hour resistance levels. However, the risk of a false breakout is high, given the conflicting daily trends. Stricter risk management, including tight stop-losses just below the breakout level or below the immediate support at $1.32197, would be paramount. Scalpers might find opportunities in the intraday volatility, but the larger risk lies in holding positions through Powell's speech without clear confirmation.
Swing traders and longer-term investors face a more complex decision. The strong bearish signal on the daily chart suggests that rallies might be opportunities to enter short positions or to stay sidelined. The key level to watch on the downside would be the breach of the $1.31438 support. If this level gives way, it could signal a continuation of the daily downtrend, opening up the path towards $1.30349. For those looking for a bullish confirmation, waiting for a clear break and sustained price action above the daily resistance at $1.32527, ideally coupled with a dovish Fed outlook, would be a more prudent strategy. The current $1.32 level represents a critical decision point, and patience is likely to be rewarded for those who wait for clearer directional signals.
The market sentiment is currently leaning towards caution, as evidenced by the mixed signals across timeframes and the anticipation of the Fed's commentary. Geopolitical risks, particularly the ongoing Middle East conflict and its impact on oil prices, continue to add an inflationary layer that central banks are monitoring closely. This uncertainty means that volatility is likely to remain elevated. Traders should prioritize risk management above all else, ensuring that any positions taken are well-hedged against sudden market swings. The $1.32 level is a critical resistance zone, and its fate will likely be sealed by the Federal Reserve's pronouncements.
Frequently Asked Questions: GBPUSD Analysis
What happens if GBPUSD breaks decisively above $1.32609 resistance amid a dovish Powell speech?
A dovish Powell, coupled with a break above $1.32609, could trigger a move towards the 4-hour resistance levels at $1.32815 and potentially $1.33155. This scenario would indicate a short-term bullish reversal, driven by a weaker dollar and waning rate hike expectations.
Is the RSI at 55.2 a buy signal for GBPUSD at current $1.32383 levels?
An RSI of 55.2 on the 1-hour chart suggests upward momentum but is not an extreme buy signal. It indicates a healthy uptrend but not yet overbought conditions. Confirmation from other indicators and a break of immediate resistance would be needed for a strong buy signal.
How will the Federal Reserve's stance on inflation, potentially revealed by Powell, affect GBPUSD?
A hawkish stance from Powell, emphasizing persistent inflation and higher-for-longer rates, would likely strengthen the US Dollar (DXY) and push GBPUSD down from current levels towards $1.31438. Conversely, a dovish tone could weaken the dollar and support a move above $1.32609.
Should traders consider shorting GBPUSD if it fails to break above $1.32609 resistance?
Given the strong daily bearish trend (ADX 32.65) and the risk of a hawkish Fed, a failure to break resistance around $1.32609 could indeed present a shorting opportunity. Targets would be the daily support levels starting at $1.31438, with tight stops above the failed resistance.
Track markets in real-time
AI-powered analysis, technical indicators and real-time price data.
Join Our Telegram Channel
Breaking market news, AI analysis and trading signals instantly.
Join Channel