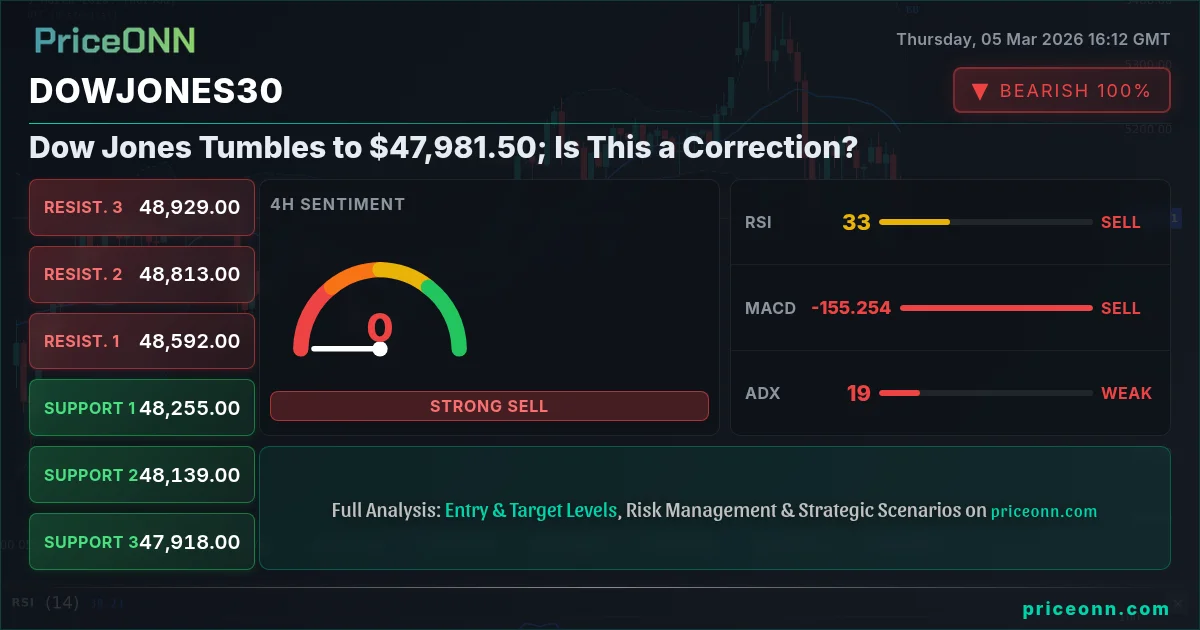
The Dow Jones Industrial Average (DowJones30) is under pressure, currently trading at $47,981.50, a significant drop of 1.59% for the day. This decline is largely attributed to weaker-than-expected PMI data released earlier today, raising concerns about the pace of economic growth. As geopolitical tensions in the Middle East escalate, particularly with the surge in crude oil prices, investors are growing increasingly cautious. The question now is whether this is a temporary correction or the start of a more prolonged downturn.
- RSI at 29.37 signals oversold conditions on the 1-hour chart, suggesting a potential short-term bounce.
- Critical support sits at $47,957.67, tested intraday – a break below could trigger further selling.
- MACD histogram shows negative momentum, indicating bearish pressure is likely to persist in the near term.
- Fed rate expectations, coupled with rising oil prices, are driving DowJones30 correlation with inflation fears.
Understanding the PMI Data Impact
The Purchasing Managers' Index (PMI) is a key indicator of economic health, reflecting business activity in both the manufacturing and service sectors. Today's PMI data, released earlier this week showed a reading of - for the US, falling short of the forecast of 51.2. This indicates a slowdown in economic expansion, prompting investors to reassess their growth expectations and leading to the sell-off in equities, including the DowJones30. As the initial reaction fades, traders are now assessing whether this is a blip or a new trend.
A weaker PMI reading has several implications. First, it suggests that corporate earnings may be negatively affected, as businesses face reduced demand and potentially lower profit margins. Second, it puts pressure on the Federal Reserve to maintain its current monetary policy or even consider easing measures to support economic growth. This, in turn, can influence the direction of the US dollar and, consequently, the DowJones30.
The Energy Price Spike: A Double-Edged Sword
Adding to the market's woes is the surge in crude oil prices. Brent crude is currently trading at $65.73, a 1.96% increase for the day, while WTI crude has surged to $79.36. This spike is driven by escalating geopolitical tensions in the Middle East, particularly the blockade in the Strait of Hormuz and the halt to Chinese fuel exports, as reported by recent news. While higher oil prices can benefit energy companies, they also contribute to inflationary pressures, which can erode consumer spending and business investment. This creates a double-edged sword for the economy and the DowJones30.
The rise in oil prices is particularly concerning given the already elevated levels of inflation. If inflation continues to rise, the Federal Reserve may be forced to raise interest rates more aggressively than expected, which could further dampen economic growth and negatively impact the DowJones30. The market is now closely watching upcoming inflation data to gauge the Fed's likely response.
Technical Analysis: Key Levels and Indicators
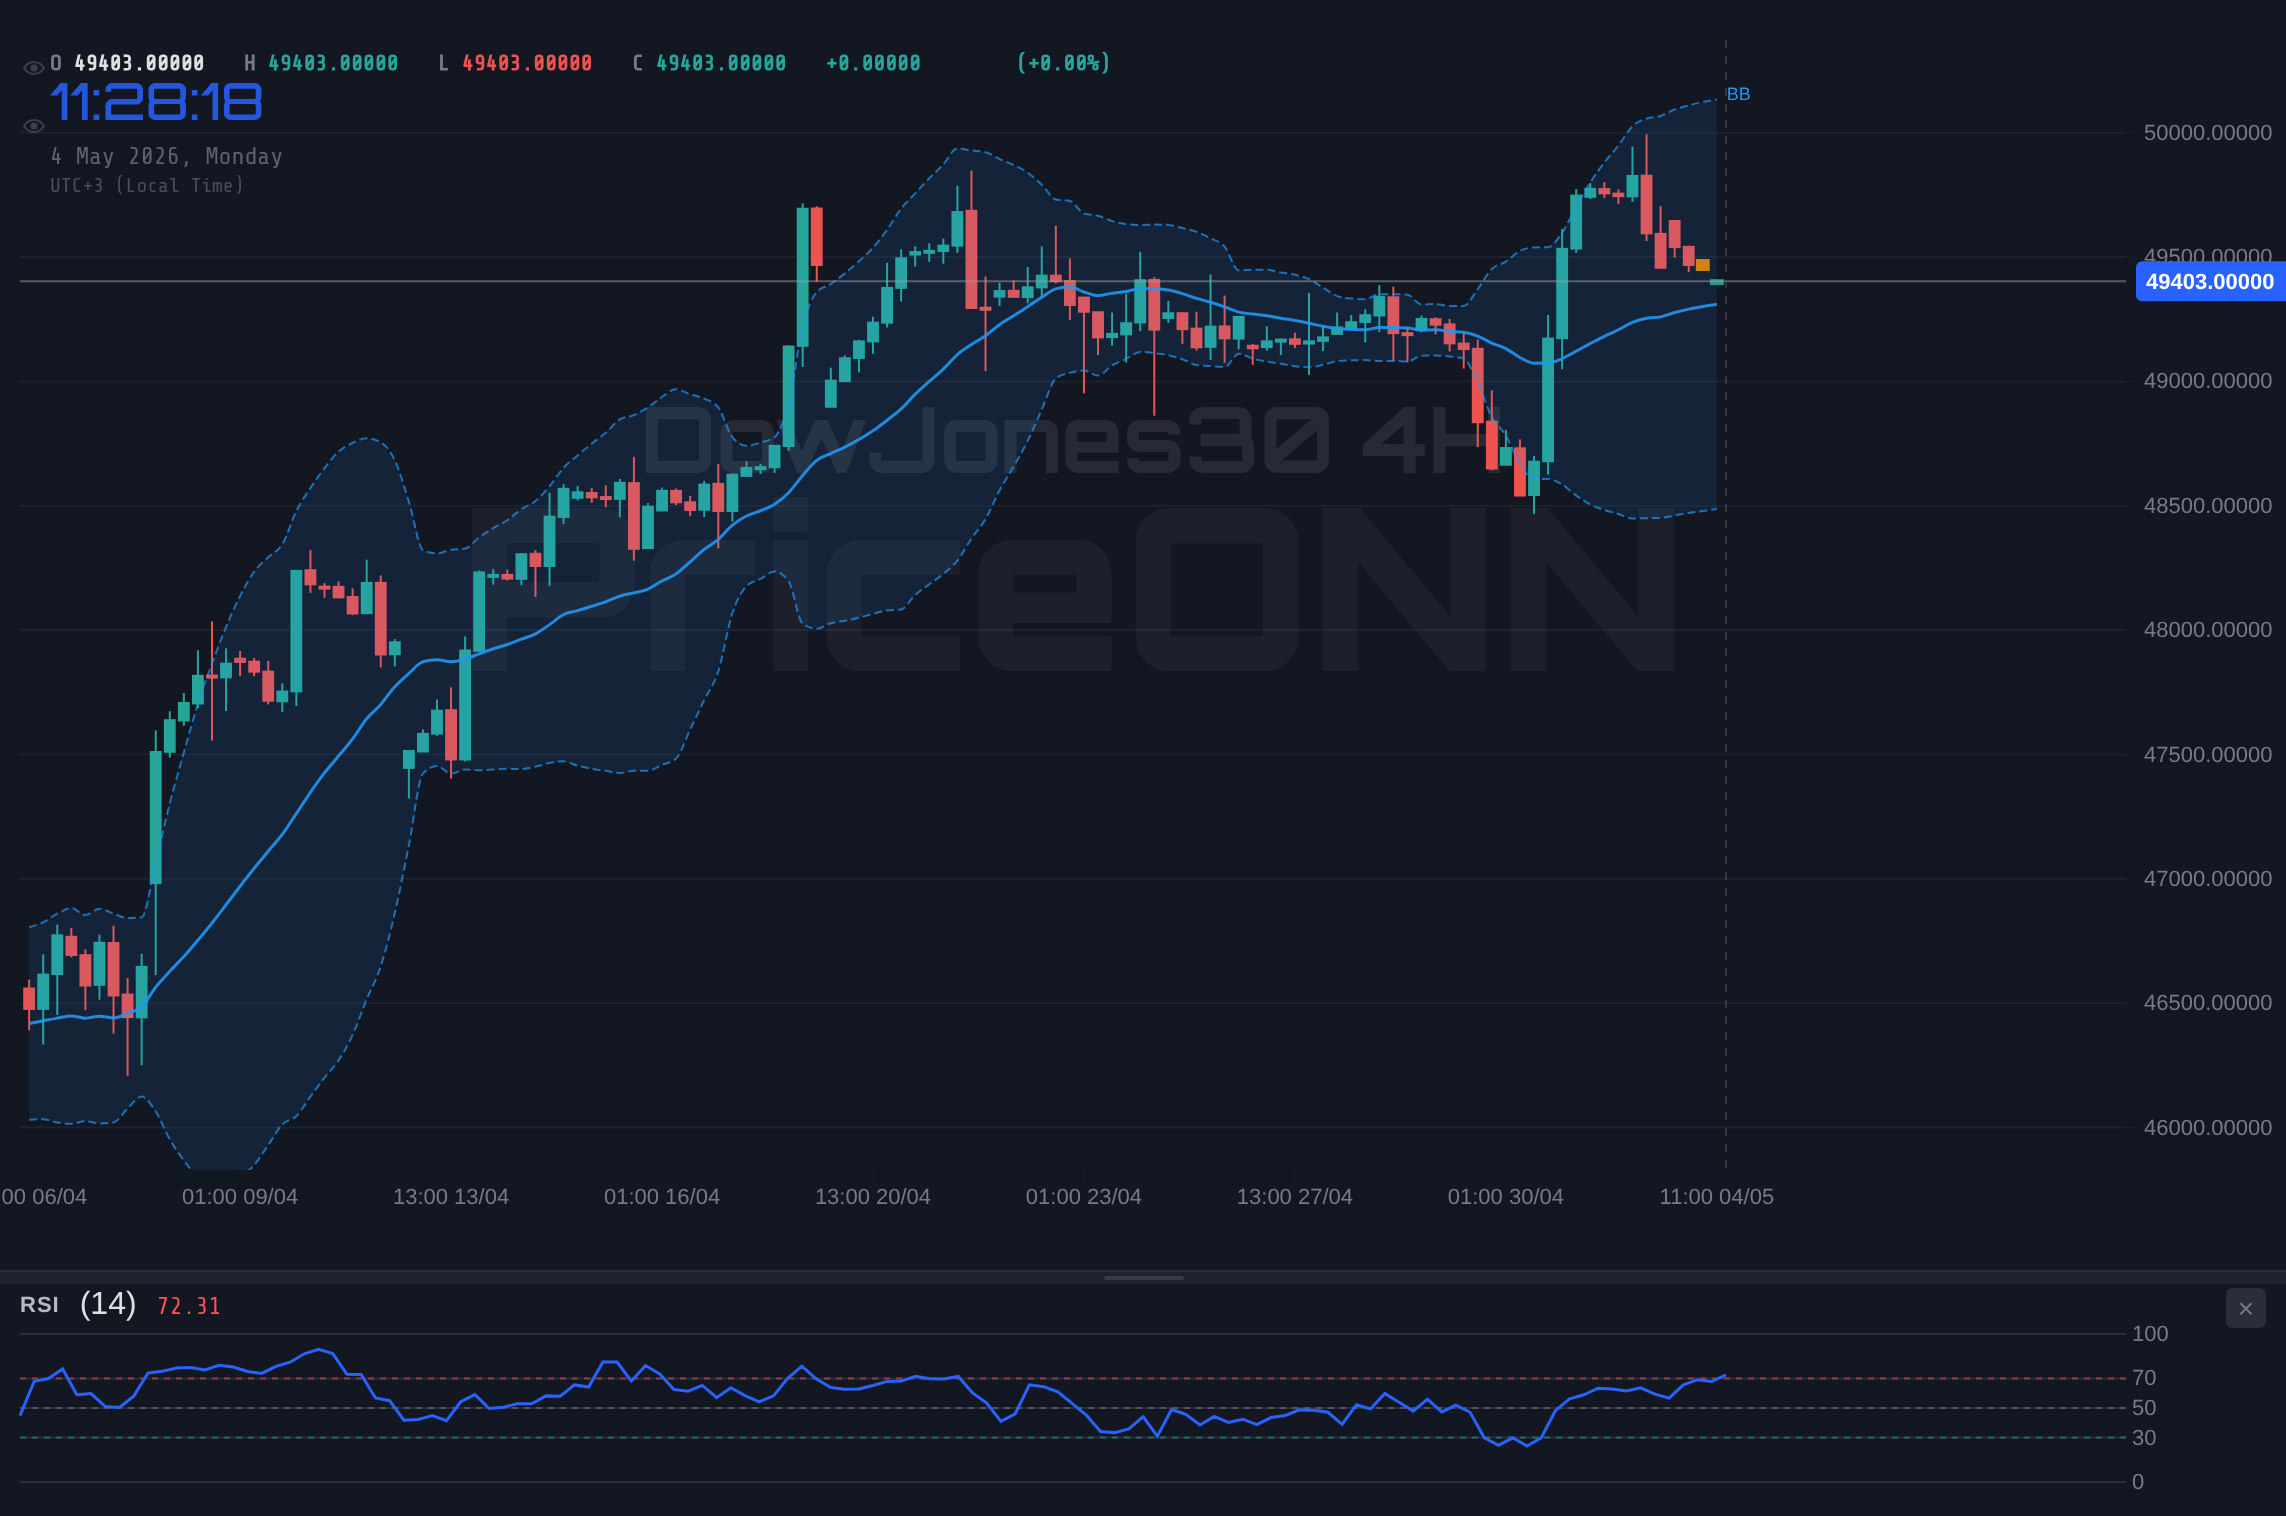
From a technical perspective, the DowJones30 is currently testing a critical support level at $47,957.67. A break below this level could open the door for further declines towards the next support at $47,705.33. On the upside, immediate resistance lies at $48,302, followed by $48,552. The 1-hour RSI is currently at 29.37, indicating oversold conditions, which suggests that a short-term bounce is possible. However, the MACD histogram shows negative momentum, indicating that the bearish pressure is likely to persist in the near term. The ADX on the 1-hour chart is at 16.68, suggesting a weak trend, so the direction remains unclear.
On the 4-hour chart, the RSI is at 36.42, also indicating some downside momentum. The MACD, however, shows positive momentum, suggesting a potential for a reversal in the medium term. The Stochastic %K is at 38.56 while %D is at 74.44, indicating a potential short-term buying opportunity. However, the overall trend on the 4-hour chart remains bearish, so caution is warranted.
DXY Strength and its Impact
The Dollar Index (DXY) is currently trading at 99.04, a 0.54% increase for the day. As the dollar index strengthens, it puts pressure on equities, including the DowJones30. This is because a stronger dollar makes US exports more expensive, potentially hurting corporate earnings. Furthermore, a stronger dollar can attract capital flows away from emerging markets and towards the US, which can also negatively impact global economic growth. With DXY at 99.04, the DowJones30 is likely to remain under pressure, particularly if the dollar continues to strengthen.
The correlation between the DXY and the DowJones30 is particularly strong during periods of economic uncertainty. When investors are concerned about the global economic outlook, they tend to flock to the safety of the US dollar, driving up its value. This, in turn, puts downward pressure on the DowJones30. The market is now closely watching the DXY to gauge the likely direction of the DowJones30 in the near term.
Dow Jones Forecast 2026: Navigating the Uncertainty
The "dow jones forecast 2026" is becoming increasingly uncertain given the confluence of factors currently weighing on the market. The weaker-than-expected PMI data, the surge in crude oil prices, and the strengthening US dollar are all contributing to the current bearish sentiment. However, it is important to remember that markets are cyclical, and periods of downturn are often followed by periods of recovery. The key is to remain disciplined and focus on the long-term fundamentals.
For long-term investors, the current market correction may present an opportunity to accumulate high-quality stocks at discounted prices. However, it is crucial to conduct thorough research and carefully assess the risks before making any investment decisions. For short-term traders, the increased volatility may provide opportunities for both long and short positions. However, it is essential to manage risk carefully and use appropriate stop-loss orders.
Economic Calendar: Key Events to Watch
Looking ahead, there are several key economic events that could impact the DowJones30. On Monday, March 2nd, the ISM Manufacturing PMI will be released. The forecast is 51.2, and a reading above this level would be seen as positive for the economy and the DowJones30. On Tuesday, March 3rd, we have the UK economic forecast. On Wednesday, March 4th, Durable Goods Orders and Factory Orders will be released, providing further insights into the health of the manufacturing sector. Any surprises in these data releases could trigger significant market movements.
Recent comments from Reuters indicate that Fed officials are carefully monitoring inflation data and are prepared to take action if necessary. The market is now pricing in a higher probability of a rate hike in the coming months, which could further dampen economic growth and negatively impact the DowJones30. Therefore, it is crucial to stay informed and closely monitor the latest economic data and Fed communications.
Frequently Asked Questions: DowJones30 Analysis
Is DowJones30 a good buy right now?
Given the current bearish sentiment and the proximity to the $47,957.67 support, a cautious approach is warranted. A break below this level could signal further downside, while a hold above could offer a short-term buying opportunity. Long-term investors may find value at these levels, but should carefully assess risks and conduct thorough research.
What is the DowJones30 price forecast for this week?
The DowJones30 price forecast for this week is highly dependent on upcoming economic data releases and geopolitical developments. A break above the $48,302 resistance could lead to a test of $48,552, while a break below the $47,957.67 support could trigger a decline towards $47,705.33. The probability of either scenario playing out is roughly equal at this time.
What are the key support and resistance levels for DowJones30?
Key support levels for the DowJones30 are $47,957.67, $47,705.33, and $47,453.00. Key resistance levels are $48,302, $48,552, and $48,802. These levels should be closely watched for potential breakouts or breakdowns, which could signal the direction of the next major market move.
Why is DowJones30 moving today?
The DowJones30 is moving lower today primarily due to weaker-than-expected PMI data, which has raised concerns about the pace of economic growth. The surge in crude oil prices and the strengthening US dollar are also contributing to the bearish sentiment. Geopolitical tensions in the Middle East are adding to the uncertainty, further weighing on the market.
Track markets in real-time
AI-powered analysis, technical indicators and real-time price data.
Join Our Telegram Channel
Breaking market news, AI analysis and trading signals instantly.
Join Channel