

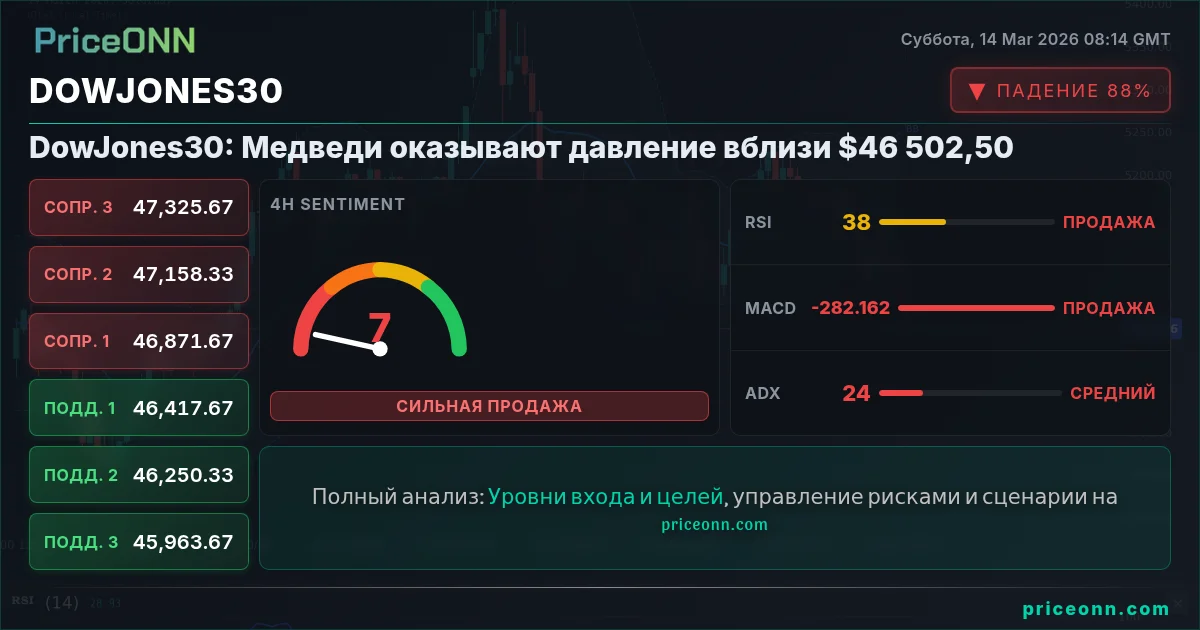
Индекс Dow Jones Industrial Average (DowJones30) находится в критической точке, где быки и медведи ведут борьбу вблизи уровня $46 502,50. Закрытие торгов в прошлую пятницу отражает преобладающие медвежьи настроения, и предстоящая неделя обещает дальнейшую волатильность по мере публикации ключевых экономических данных, особенно показателей CPI. Вопрос в том: сможет ли DowJones30 защитить эту критическую поддержку или медведи возьмут контроль?
- RSI на уровне 36.82 на 1-часовом графике указывает на ослабление бычьего импульса вблизи $46 502,50
- Критический уровень поддержки для наблюдения находится на отметке 46 446,67; прорыв ниже этого уровня может спровоцировать дальнейшее снижение
- Гистограмма MACD сигнализирует об отрицательном импульсе, что предполагает медвежий уклон в краткосрочной перспективе
- Предстоящие данные по CPI и геополитическая напряженность являются ключевыми факторами, влияющими на корреляцию DowJones30 с DXY
Бычий сценарий для DowJones30
Несмотря на недавнее медвежье давление, есть аргументы в пользу потенциального отскока DowJones30. Самым убедительным является возможность краткосрочного отскока из-за перепроданности. На 1-часовом графике RSI находится на уровне 36.82, что говорит о приближении индекса к условиям перепроданности. Исторически такие условия перепроданности предшествовали краткосрочным ралли, поскольку покупатели вступают в игру, чтобы воспользоваться более низкими ценами. Кроме того, стохастический осциллятор на 4-часовом графике показывает %K на уровне 35.24 и %D на уровне 22.09, что указывает на возможную краткосрочную коррекцию цены.
Еще одним фактором, поддерживающим бычий сценарий, является возможность позитивных сюрпризов в предстоящих экономических данных. В то время как рынок ожидает публикации данных по CPI, показатели лучше ожидаемых могут спровоцировать ралли «риск-он», что принесет пользу DowJones30. Кроме того, любая деэскалация геополитической напряженности на Ближнем Востоке может ослабить опасения по поводу поставок и повысить рыночные настроения, что приведет к потенциальному ралли DowJones30.
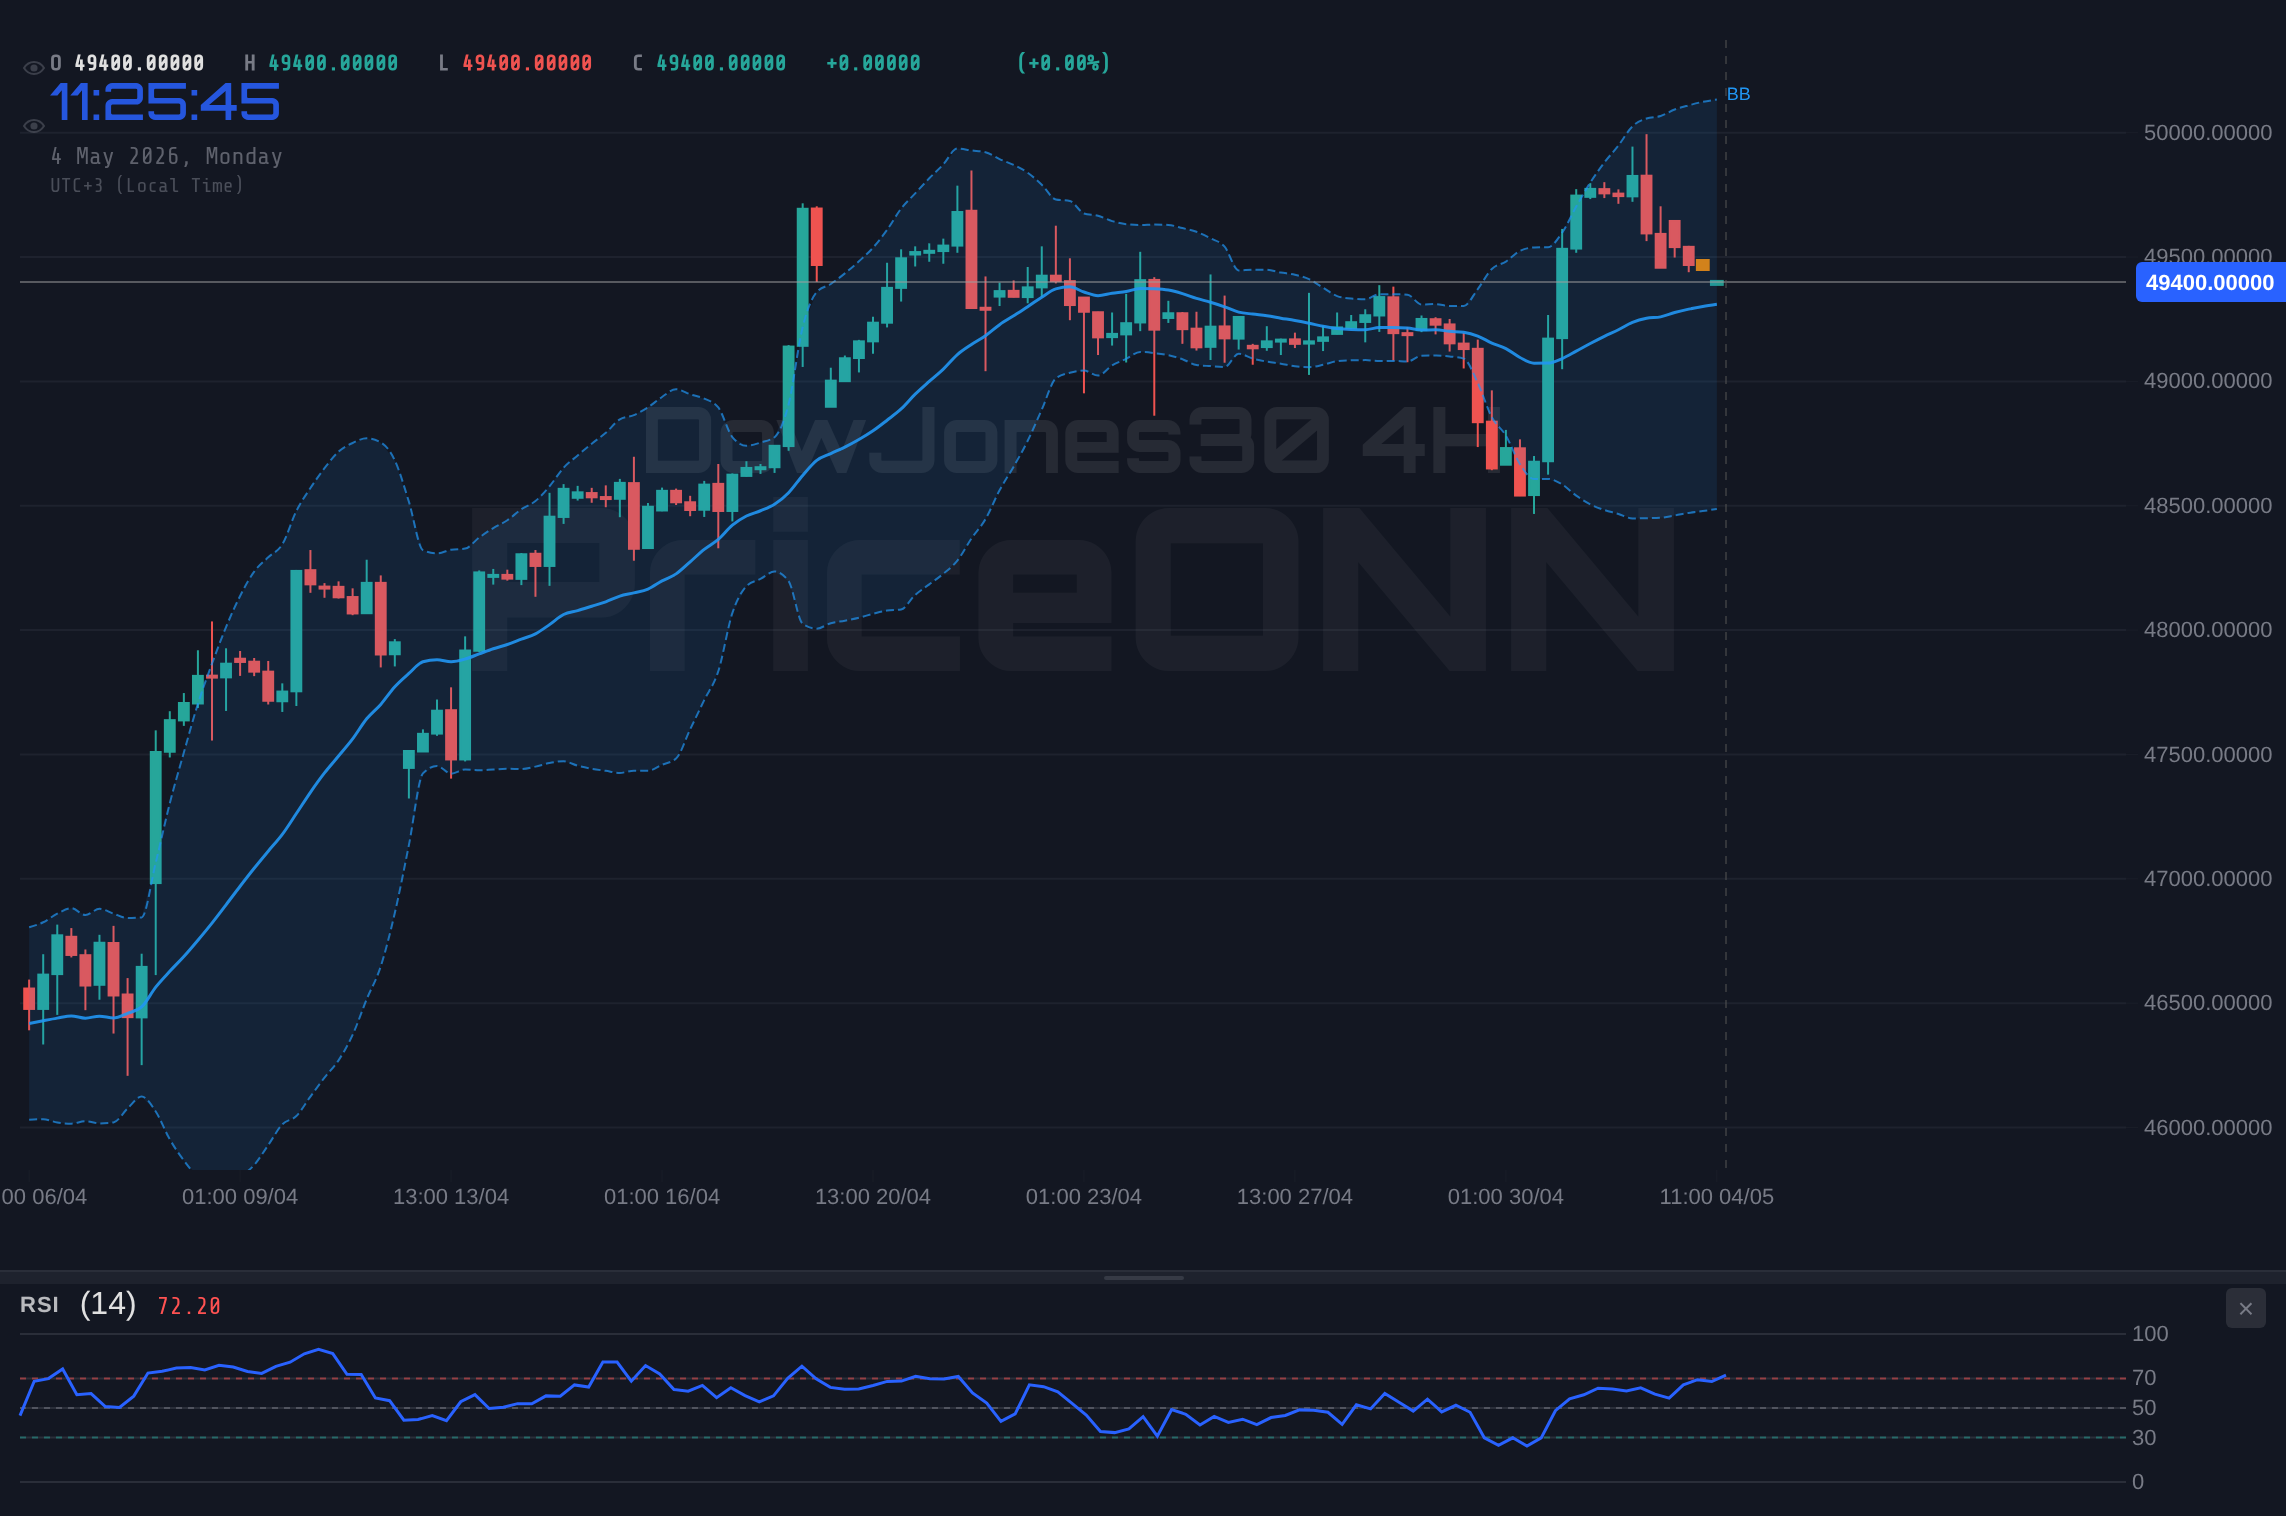
С технической точки зрения, DowJones30 в прошлом демонстрировал устойчивость, защищая ключевые уровни поддержки. Если цена сможет удержаться выше уровня поддержки 46 446,67 на 1-часовом графике, это может сигнализировать о потенциальном дне и проложить путь к движению в направлении уровня сопротивления 46 720,67. Тот факт, что индекс торгуется выше своей дневной средней полосы Боллинджера, предполагает, что долгосрочный восходящий тренд все еще сохраняется, хотя и находится под давлением.
Медвежий сценарий для DowJones30
И наоборот, медвежий сценарий для DowJones30 зависит от нескольких факторов. Основным драйвером является устойчивая сила доллара США. Индекс доллара DXY в настоящее время торгуется на уровне 100.2, что на 0.8% выше, чем днем ранее, что указывает на сильный доллар. Как сообщает PriceONN, серебро падает ниже $81 из-за укрепления доллара, а сильный доллар обычно оказывает понижательное давление на рисковые активы, такие как акции, включая DowJones30. Сильный доллар отражает опасения по поводу инфляции и возможности дальнейшего ужесточения политики ФРС, что негативно скажется на корпоративных доходах и экономическом росте.
С технической точки зрения, DowJones30 демонстрирует несколько медвежьих сигналов. Гистограмма MACD на 1-часовом графике отрицательная, что указывает на медвежий импульс. 1-часовой тренд является медвежьим (сила 95%), при этом цена торгуется ниже своей средней полосы Боллинджера, что еще больше подтверждает понижательное давление. ADX на 1-часовом таймфрейме находится на уровне 19.63, показывая слабый тренд, но общее настроение остается медвежьим. SP500, более широкий рыночный индекс, также снизился на 0.81%, отражая снижение DowJones30, что свидетельствует о более широком неприятии риска на рынке. Текущая цена SP500 на уровне 6625.3 показывает, что медведи контролируют ситуацию.
Эскалация геополитической напряженности на Ближнем Востоке также представляет значительный риск для DowJones30. Всплеск цен на нефть, при этом нефть марки Brent выше $100 за баррель, отражает опасения по поводу перебоев в поставках на фоне конфликта. Более высокие цены на энергоносители могут привести к увеличению инфляции, что вынудит ФРС занять более ястребиную позицию, что еще больше повлияет на DowJones30. Как сообщает PriceONN, напряженность на Ближнем Востоке продолжает нарушать маршруты поставок. Рост цен на нефть приведет к увеличению инфляции.
Технические факторы как решающий фактор: анализ нескольких таймфреймов
Чтобы выйти из тупика между бычьим и медвежьим сценариями, необходим технический анализ нескольких таймфреймов. На дневном графике DowJones30 торгуется ниже своей средней полосы Боллинджера, что предполагает медвежий уклон. RSI находится на уровне 27.44, что указывает на условия перепроданности, но ADX находится на уровне 34.71, показывая сильный нисходящий тренд, что предполагает, что условие перепроданности может не привести к немедленному развороту. Stochastic K находится на уровне 19.19, а D - на уровне 28.41, что еще больше подтверждает нисходящий импульс. На 4-часовом графике RSI находится на уровне 37.64, что также предполагает медвежий импульс. Гистограмма MACD как на дневном, так и на 4-часовом графиках отрицательная, что усиливает медвежий прогноз.
Однако важно отметить возможность краткосрочного отскока. 1-часовой график показывает перепроданный RSI и Stochastic %K > %D, что предполагает возможную коррекцию. Однако общий тренд остается медвежьим, и любое краткосрочное ралли, вероятно, встретит сопротивление. Ключевые уровни для наблюдения - уровень сопротивления 46 720,67 на 1-часовом графике и уровень поддержки 46 446,67 на 1-часовом графике. Прорыв выше сопротивления может сигнализировать об изменении импульса, а прорыв ниже поддержки может ускорить снижение.
Тренд DowJones30 за последнюю неделю является медвежьим, цена падает с закрытия предыдущей недели. Уровень сопротивления 47 145,67 на дневном графике не был пробит, и цена продолжила снижаться. Важно следить за новостями, связанными с сырой нефтью, поскольку она приближается к $100, что является ключевым уровнем, как сообщает PriceONN.
Торговый план: Short DowJones30
Основываясь на техническом анализе, медвежий сценарий представляется более вероятным в краткосрочной перспективе. Устойчивая сила доллара, отрицательные индикаторы импульса и геополитические риски - все это указывает на дальнейшее понижательное давление на DowJones30. Поэтому рекомендуется открывать короткую позицию.
Открывайте короткую позицию, если цена пробивает уровень поддержки 46 446,67 на 1-часовом графике. Первая цель по прибыли на уровне 46 246,33 (уровень поддержки 4H), а вторая цель на уровне 45 825,67 (уровень поддержки 1D). Этот сценарий поддерживается отрицательными индикаторами импульса и сильным долларом.
Длинную позицию можно открывать, если цена пробивает уровень сопротивления 46 720,67 на 1-часовом графике. Первая цель по прибыли на уровне 47 140,33 (уровень сопротивления 4H), а вторая цель на уровне 47 563,33 (уровень сопротивления 1D). Этот сценарий менее вероятен, но может произойти при позитивных сюрпризах в данных.
Часто задаваемые вопросы: Анализ DowJones30
Что произойдет, если DowJones30 пробьет уровень поддержки $46 446,67?
Если DowJones30 пробьет уровень поддержки $46 446,67 на 1-часовом графике, это может спровоцировать резкое снижение к уровням поддержки 46 246,33 и 45 825,67. Отрицательные индикаторы импульса предполагают, что медведи, вероятно, будут оказывать дальнейшее давление вниз.
Стоит ли открывать Short по DowJones30 на текущих уровнях $46 502,50, учитывая RSI на уровне 36.82?
Учитывая RSI на уровне 36.82 и общее медвежье настроение, короткая позиция является жизнеспособной, если DowJones30 пробьет уровень поддержки 46 446,67. Установите стоп-лосс выше уровня сопротивления 46 720,67, чтобы управлять риском. Потенциальная область для фиксации прибыли, за которой стоит следить, - 46 246,33.
RSI на уровне 27.44 на дневном графике - это сигнал к покупке DowJones30?
Хотя RSI на уровне 27.44 указывает на условия перепроданности на дневном графике, это не является окончательным сигналом к покупке. Сильный нисходящий тренд, подтвержденный ADX на уровне 34.71, предполагает, что условие перепроданности может сохраняться. Поэтому требуется осторожность, и необходимо подтверждение бычьего разворота, прежде чем рассматривать длинную позицию.
Как предстоящие данные по CPI повлияют на DowJones30 на этой неделе?
Предстоящая публикация данных по CPI является ключевым катализатором для DowJones30 на этой неделе. Более высокие, чем ожидалось, показатели инфляции могут укрепить доллар и спровоцировать распродажу акций, толкая DowJones30 ниже. И наоборот, более низкие, чем ожидалось, показатели инфляции могут ослабить доллар и подстегнуть ралли «риск-он», что принесет пользу DowJones30.
Сводка технического анализа
| Индикатор | Значение | Сигнал |
|---|---|---|
| RSI (14) | 36.82 | Нейтральный |
| Гистограмма MACD | Отрицательная | Медвежий |
| Stochastic | 11.21/34.32 | Медвежий |
| ADX | 19.63 | Слабый тренд |
| Bollinger | Средняя полоса | Медвежий |
Ключевые уровни
Уровни поддержки
Уровни сопротивления
Отслеживайте рынки в реальном времени
ИИ-анализ и данные в реальном времени.