The SP500 is caught in a tug-of-war near $6,625.30, as bulls and bears wrestle for control. The index has shown resilience in the face of persistent inflation worries and hawkish Federal Reserve signals, but recent weakness suggests the bears may be gaining the upper hand. Whether this is a temporary pullback or the start of a more significant correction depends heavily on upcoming economic data, especially next week’s CPI release, which could set the tone for risk assets in the near term. SP500 today analysis reveals a market at a critical juncture, where short-term volatility meets long-term uncertainty.
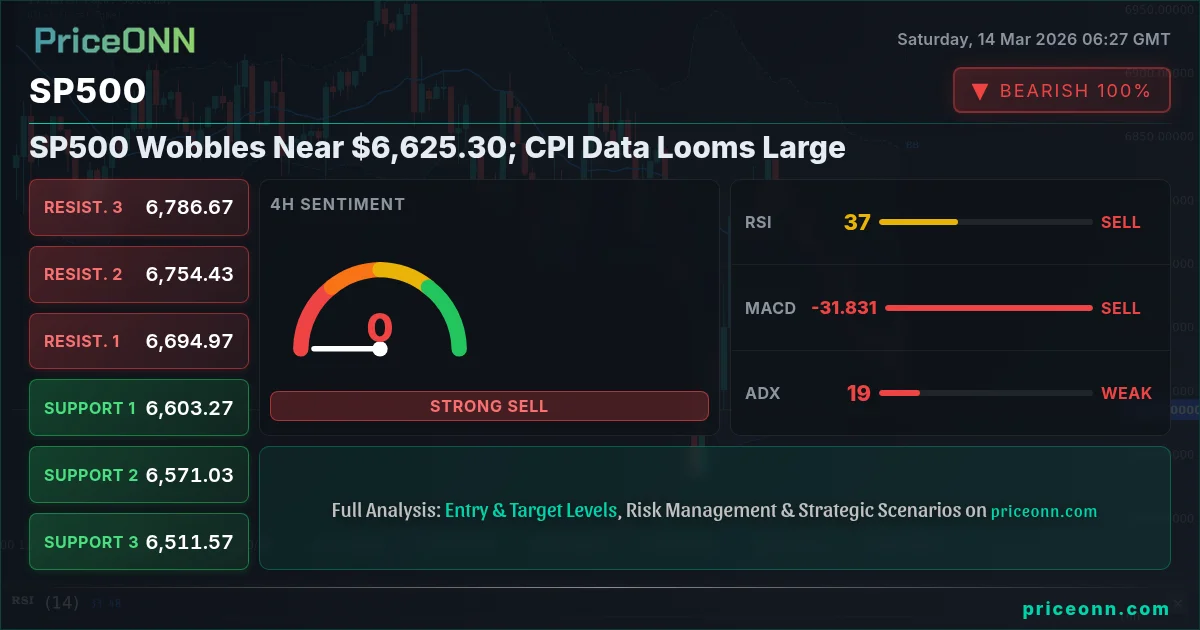
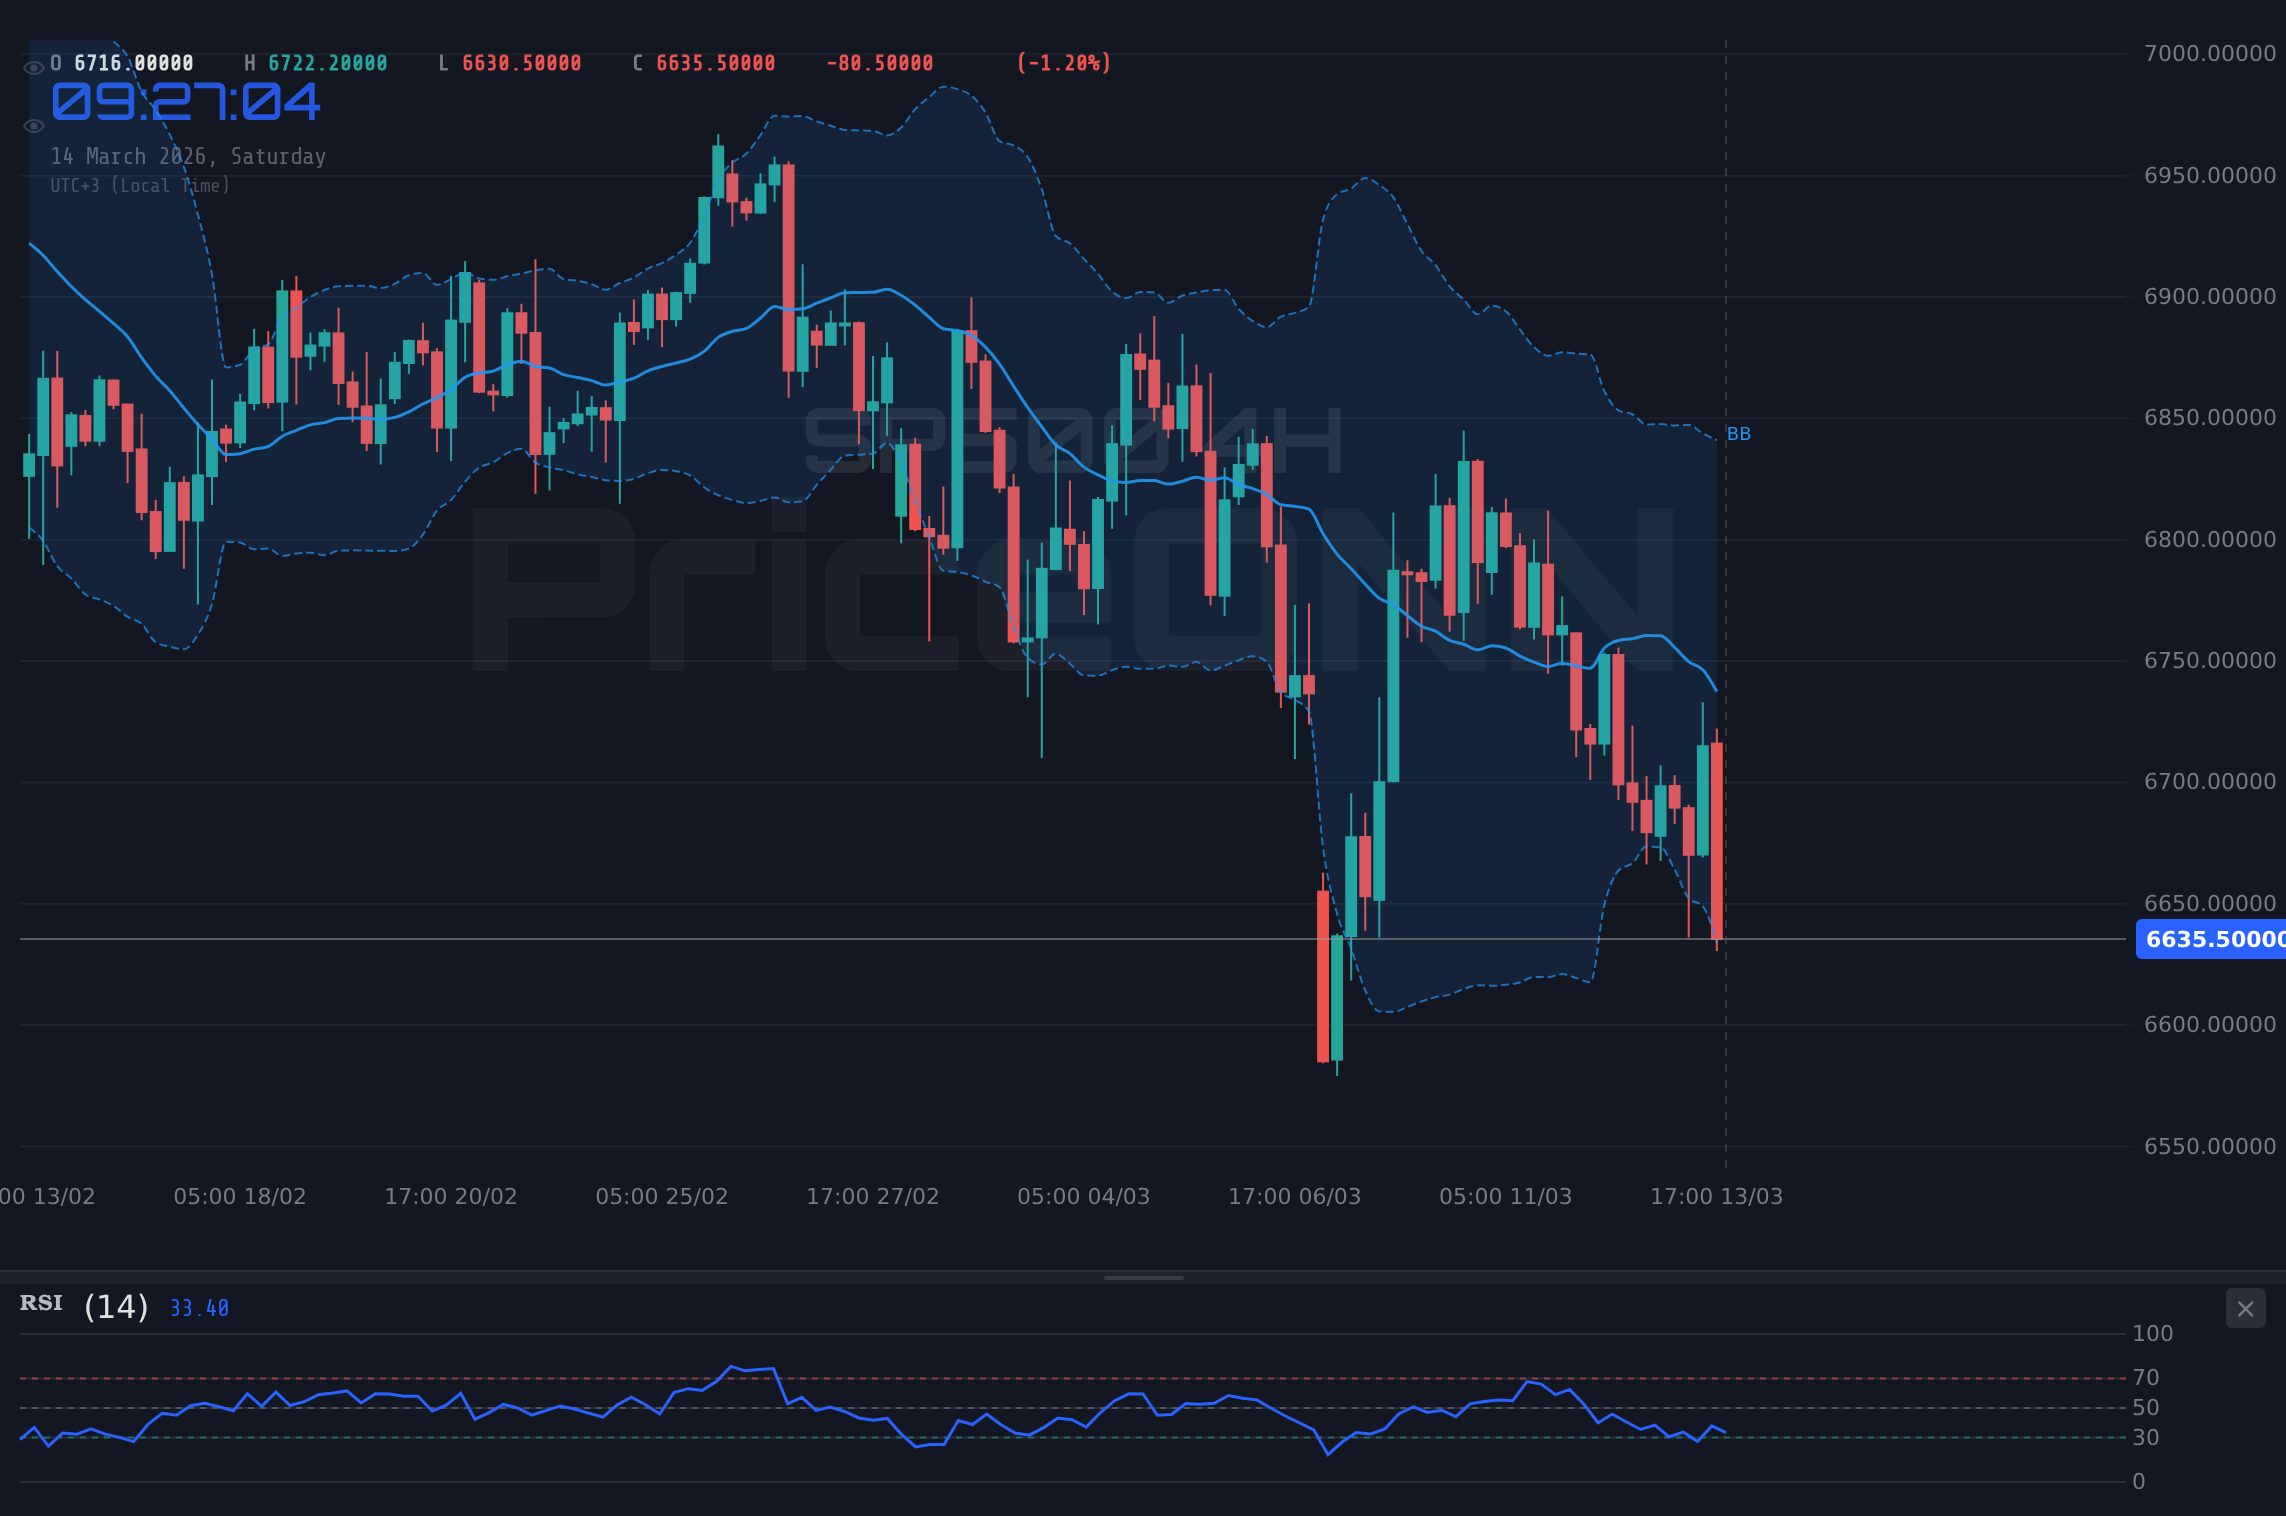
- RSI at 33.58 on the daily chart signals oversold conditions, but the downtrend persists.
- Critical support sits at $6,643.2, a break below could trigger a sharp sell-off.
- MACD histogram shows negative momentum, indicating bearish pressure is intensifying.
- Fed rate expectations and DXY strength are driving SP500 correlation with the dollar index.
The Bull Case: Is a Rebound on the Horizon?
Despite the recent downturn, the bull case for the SP500 rests on several key factors. First, corporate earnings remain relatively robust, with many companies continuing to beat expectations. This suggests that the underlying economy is still strong enough to support equity valuations. Second, the Federal Reserve may be nearing the end of its tightening cycle, with some analysts predicting a pause or even a pivot in the coming months. A less hawkish Fed could provide a significant boost to risk assets, including the SP500. The SP500 market sentiment, while currently bearish, could shift rapidly if these factors align. Furthermore, the daily RSI reading of 33.58 suggests that the market may be oversold, potentially setting the stage for a mean reversion rally. Scalpers might look for quick long opportunities if the price action confirms a short-term reversal near the support levels.
Technicals Supporting the Bullish View
From a technical perspective, the SP500 has held above the critical support level of $6,643.2, which has acted as a strong floor in recent weeks. A successful defense of this level could signal that the bulls are still in control and that a rebound is likely. Additionally, the Stochastic indicator shows oversold conditions on the hourly chart, suggesting that the downside momentum may be waning. However, the ADX reading of 37.61 on the daily chart indicates a strong downtrend, which needs to be overcome for the bullish scenario to play out. With the DXY at 100.2, SP500 is feeling pressure. Swing traders might watch for a break above the 20-day moving average as a confirmation of bullish momentum. The key levels to watch are the immediate resistance at $6,738.8 and the support at $6,643.2.
The Bear Case: Further Downside Risks
On the other hand, the bear case for the SP500 is equally compelling. Inflation remains stubbornly high, and the Federal Reserve has signaled that it is prepared to continue raising interest rates to bring it under control. Higher interest rates could slow economic growth and put downward pressure on corporate earnings. The SP500 weekly outlook highlights the increasing risks of a deeper correction if inflation data continues to surprise to the upside. Moreover, geopolitical tensions remain elevated, with ongoing conflicts and trade disputes creating uncertainty in the global economy. The SP500 news impact often reflects these geopolitical anxieties, leading to increased volatility and risk aversion. Long-term investors might consider hedging their positions or reducing exposure to equities if the bearish trend persists.
Technicals Reinforcing the Bearish View
Technically, the SP500 is exhibiting several bearish signals. The MACD histogram is negative, indicating that the downward momentum is accelerating. The price is trading below the 50-day and 200-day moving averages, which are acting as dynamic resistance levels. The Bollinger Bands are widening, suggesting that volatility is increasing and that further downside is possible. The key level to watch is the support at $6,643.2; a break below this level could trigger a sharp sell-off towards the next support level at $6,606.9. The overall signal is SAT (Sell) across multiple timeframes, reinforcing the bearish sentiment. SP500 RSI is also neutral in the 4-hour timeframe, suggesting that there is room for further downside. With the dollar index (DXY) at 100.2, the SP500 faces additional headwinds. Scalpers may seek short opportunities on rallies that fail to break resistance, while swing traders could establish short positions on confirmed breakdowns below support.
SP500 Support and Resistance: Key Levels to Watch
Understanding key support and resistance levels is crucial for navigating the current market environment. Immediate support lies at $6,643.2, followed by $6,606.9 and $6,547.6. These levels could act as potential buying opportunities if the market bounces off them. On the upside, immediate resistance is at $6,738.8, followed by $6,798.1 and $6,834.4. A break above these levels could signal a shift in momentum and a potential rally. The ADX reading of 12.18 on the daily chart suggests that the current trend is weak, which could lead to choppy price action and increased volatility. SP500 key levels are therefore critical for both short-term and long-term trading strategies. Investors should also monitor the DXY, as its movements often have an inverse correlation with the SP500.
The Impact of CPI Data: A Critical Catalyst
Next week's CPI data is poised to be a significant catalyst for the SP500. A higher-than-expected CPI reading could reinforce the Federal Reserve's hawkish stance and lead to further downside pressure on equities. Conversely, a lower-than-expected reading could signal that inflation is cooling and that the Fed may be able to ease its tightening cycle, providing a boost to the market. The market is pricing in a certain probability of future rate hikes, and the CPI data will either confirm or challenge these expectations. SP500 news impact often revolves around these key economic releases, making them essential for traders to monitor. The upcoming USD data, scheduled for release on Wednesday and Friday, will also provide further insights into the health of the US economy and its potential impact on the SP500.
Correlation Analysis: DXY, Bonds, and Commodities
The SP500 does not exist in isolation; it is closely correlated with other asset classes, including the dollar index (DXY), bond yields, and commodities. A rising DXY typically puts downward pressure on the SP500, as it makes US assets more expensive for foreign investors. Rising bond yields also tend to weigh on equities, as they increase the cost of borrowing and make bonds more attractive relative to stocks. Commodities, particularly oil, can have a mixed impact on the SP500. Higher oil prices can boost the energy sector but also contribute to inflation, which can be negative for the broader market. The current strength in the DXY, trading at 100.2, is a significant headwind for the SP500. Brent crude oil is rallying, with WTI nearing $100 a barrel, as ongoing Middle East conflict highlights the market's sensitivity. This can add to inflation and weigh on the SP500.
Historical Perspective: Past Corrections and Rebounds
Looking back at historical data, the SP500 has experienced numerous corrections and rebounds over the years. These episodes often provide valuable lessons about market behavior and potential trading strategies. For example, during the 2020 COVID-19 crash, the SP500 fell sharply before staging a remarkable recovery. Similarly, the 2008 financial crisis saw a significant decline followed by a multi-year bull market. Studying these past events can help traders and investors better understand the current market environment and make more informed decisions. The SP500 trend analysis often involves identifying patterns and cycles that have played out in the past and assessing whether they are likely to repeat in the future. Understanding market sentiment and how it shifts during these periods is also crucial for successful trading and investing.
The Verdict: Proceed with Caution
Given the conflicting signals and the uncertainty surrounding the upcoming CPI data, the most prudent approach is to proceed with caution. The SP500 is at a critical juncture, and the next few days could determine its direction for the coming weeks. Traders and investors should closely monitor the key support and resistance levels, as well as the economic data releases, to gauge the market's next move. While the potential for a rebound exists, the bearish signals are too strong to ignore. Until there is clear evidence that inflation is under control and that the Federal Reserve is prepared to ease its tightening cycle, the risk of further downside remains elevated. SP500 price forecast is highly dependent on these factors, making it essential to stay informed and adapt to changing market conditions.
Trading Strategies for Different Time Horizons
Different trading strategies are suitable for different time horizons. Scalpers might look for quick opportunities to profit from short-term price fluctuations, focusing on intraday support and resistance levels. Swing traders could establish positions based on confirmed breakouts or breakdowns, holding them for several days or weeks. Long-term investors might use the current weakness as an opportunity to accumulate shares at lower prices, but they should be prepared for the possibility of further downside in the near term. The SP500 breakout scanner can help identify potential trading opportunities across different timeframes, but it is important to use it in conjunction with other technical and fundamental analysis tools. Risk management is paramount, regardless of the trading strategy employed.
Key Levels
Support Levels
Resistance Levels
Technical Outlook Summary
| Indicator | Value | Signal |
|---|---|---|
| RSI (14) | 47.85 | Neutral |
| MACD Histogram | Negative | Bearish |
| Stochastic | 22.77 | Bearish |
| ADX | 12.18 | Weak Trend |
| Bollinger | Middle Band | Watch |
Frequently Asked Questions: SP500 Analysis
What happens if SP500 breaks below the $6,643.2 support level?
A break below the $6,643.2 support could trigger a sharp sell-off, potentially leading to the next support level at $6,606.9 being tested. This breakdown would likely intensify bearish sentiment and accelerate the downward momentum, especially if confirmed by increased volume.
Should I buy SP500 at current levels of $6,625.30 given the oversold RSI?
While the oversold RSI suggests a potential for a rebound, caution is warranted. The overall trend is bearish, and the MACD histogram confirms negative momentum. It would be prudent to wait for a bullish confirmation signal, such as a break above the 20-day moving average, before considering a long position.
Is an RSI reading of 47.85 on the daily chart a reliable signal for SP500?
An RSI of 47.85 on the daily chart indicates neutral conditions, suggesting that the market is neither overbought nor oversold. This reading alone is not a reliable signal, and it should be used in conjunction with other indicators and price action analysis to make informed trading decisions.
How will next week's CPI data affect SP500 this week?
Next week's CPI data will be a critical catalyst. A higher-than-expected reading could reinforce the Federal Reserve's hawkish stance and lead to further downside pressure on equities, while a lower-than-expected reading could signal that inflation is cooling, potentially boosting the market.
Track markets in real-time
AI-powered analysis, technical indicators and real-time price data.
Join Our Telegram Channel
Breaking market news, AI analysis and trading signals instantly.
Join Channel