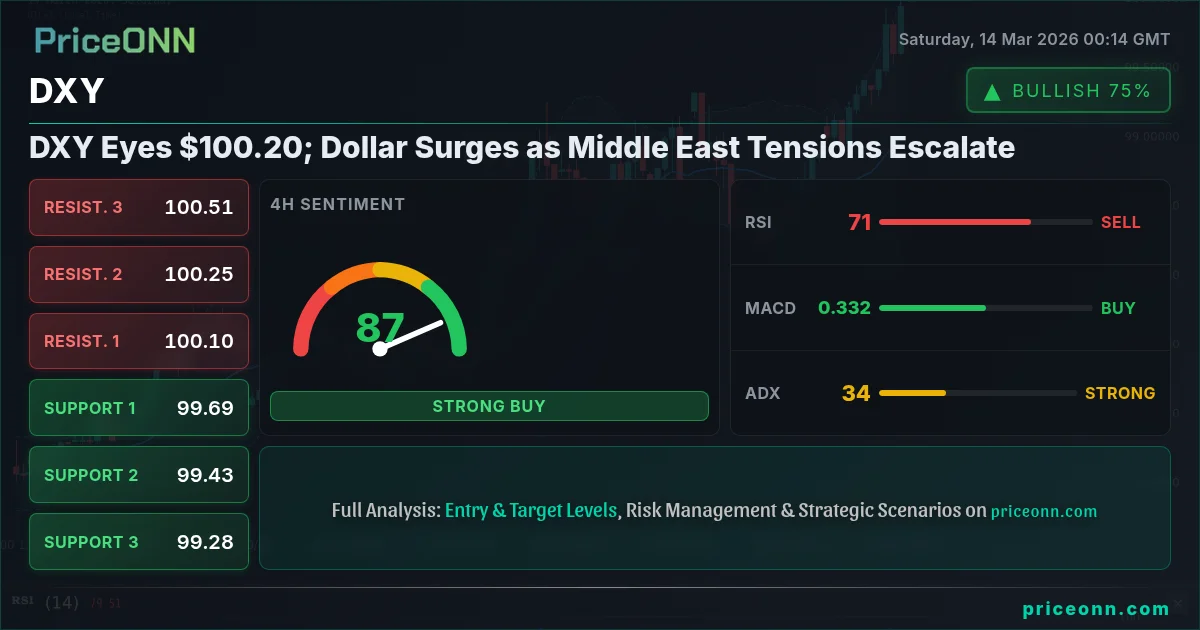
The US Dollar Index (DXY) is making a significant push towards multi-month highs, currently trading near $100.20, as escalating geopolitical tensions in the Middle East and a flight to safety drive demand for the greenback. This surge comes ahead of crucial CPI data next week, which could either solidify the dollar's strength or trigger a reversal. The confluence of these factors has created a volatile environment for currency markets, demanding a careful assessment of both technical and fundamental drivers.
- DXY at 74.69 RSI signals overbought conditions on the daily timeframe, potentially limiting further gains.
- Key support for DXY sits at 99.06, a break below which could invalidate the bullish thesis.
- The upcoming CPI data on Wednesday is expected to be a major catalyst, potentially driving significant volatility.
- Escalating Middle East tensions are fueling safe-haven demand, driving the DXY correlation with XAUUSD.
The surge in the DXY is not happening in isolation. As Reuters reported, the escalation of tensions in the Middle East is contributing to the risk-off sentiment, pushing investors towards the perceived safety of the US dollar. This geopolitical backdrop is further complicated by ongoing concerns about global economic growth and uncertainty surrounding central bank policies. The confluence of these factors has created a perfect storm for the dollar, driving it to levels not seen in nearly a year. This is a critical juncture for the DXY, as a sustained break above $100.00 could open the door for further gains, while a failure to hold these levels could signal a potential reversal.
Geopolitical Risks and Safe-Haven Demand
The current strength in the DXY is heavily influenced by geopolitical risks, particularly the escalating tensions in the Middle East. News outlets have reported that Saudi Arabia has cut oil production by 20% due to ongoing conflict in the Persian Gulf. This has led to a spike in oil prices, with Brent crude eyeing $120 as a major Middle East conflict disrupts global oil supplies. As a result, the correlation between rising oil prices and DXY strength is based on the need for USD in oil transactions as well as the safe haven properties that investors look for in times of uncertainty.
The DXY's role as a safe-haven asset is further reinforced by the weakness in other major currencies, particularly the Euro and the British Pound. As the dollar index strengthens by 0.8%, pushing EUR/USD to multi-month lows as AUD/USD faces headwinds. This divergence in performance highlights the relative strength of the US economy compared to its European counterparts, further supporting the dollar's appeal as a safe-haven investment. The combination of geopolitical risks and economic uncertainty is creating a powerful tailwind for the DXY, pushing it towards levels not seen in nearly a year.
The CPI Data Catalyst
While geopolitical risks are currently driving the DXY, the upcoming CPI data next week is expected to be a major catalyst that could significantly impact the dollar's trajectory. The US Dollar Index (DXY) Rises as US Inflation in Line With Forecasts on March 11th, as a reminder of the importance of this data. Expectations for inflation have been relatively stable, but any significant deviation from forecasts could trigger a sharp market reaction. A higher-than-expected CPI print would likely reinforce expectations of further interest rate hikes by the Federal Reserve, which would further boost the dollar's appeal. On the other hand, a weaker-than-expected CPI reading could raise concerns about the strength of the US economy, potentially leading to a reversal in the dollar's recent gains.
The market's sensitivity to inflation data is particularly high given the recent volatility in energy prices. The spike in oil prices resulting from Middle East tensions could put upward pressure on inflation, further complicating the Fed's efforts to manage price stability. Investors will be closely scrutinizing the CPI data for any signs of inflationary pressures, as this could significantly influence the Fed's policy decisions in the coming months. The combination of geopolitical risks and economic uncertainty is creating a complex environment for the dollar, demanding a careful assessment of both technical and fundamental drivers.
Multi-Timeframe Technical Analysis
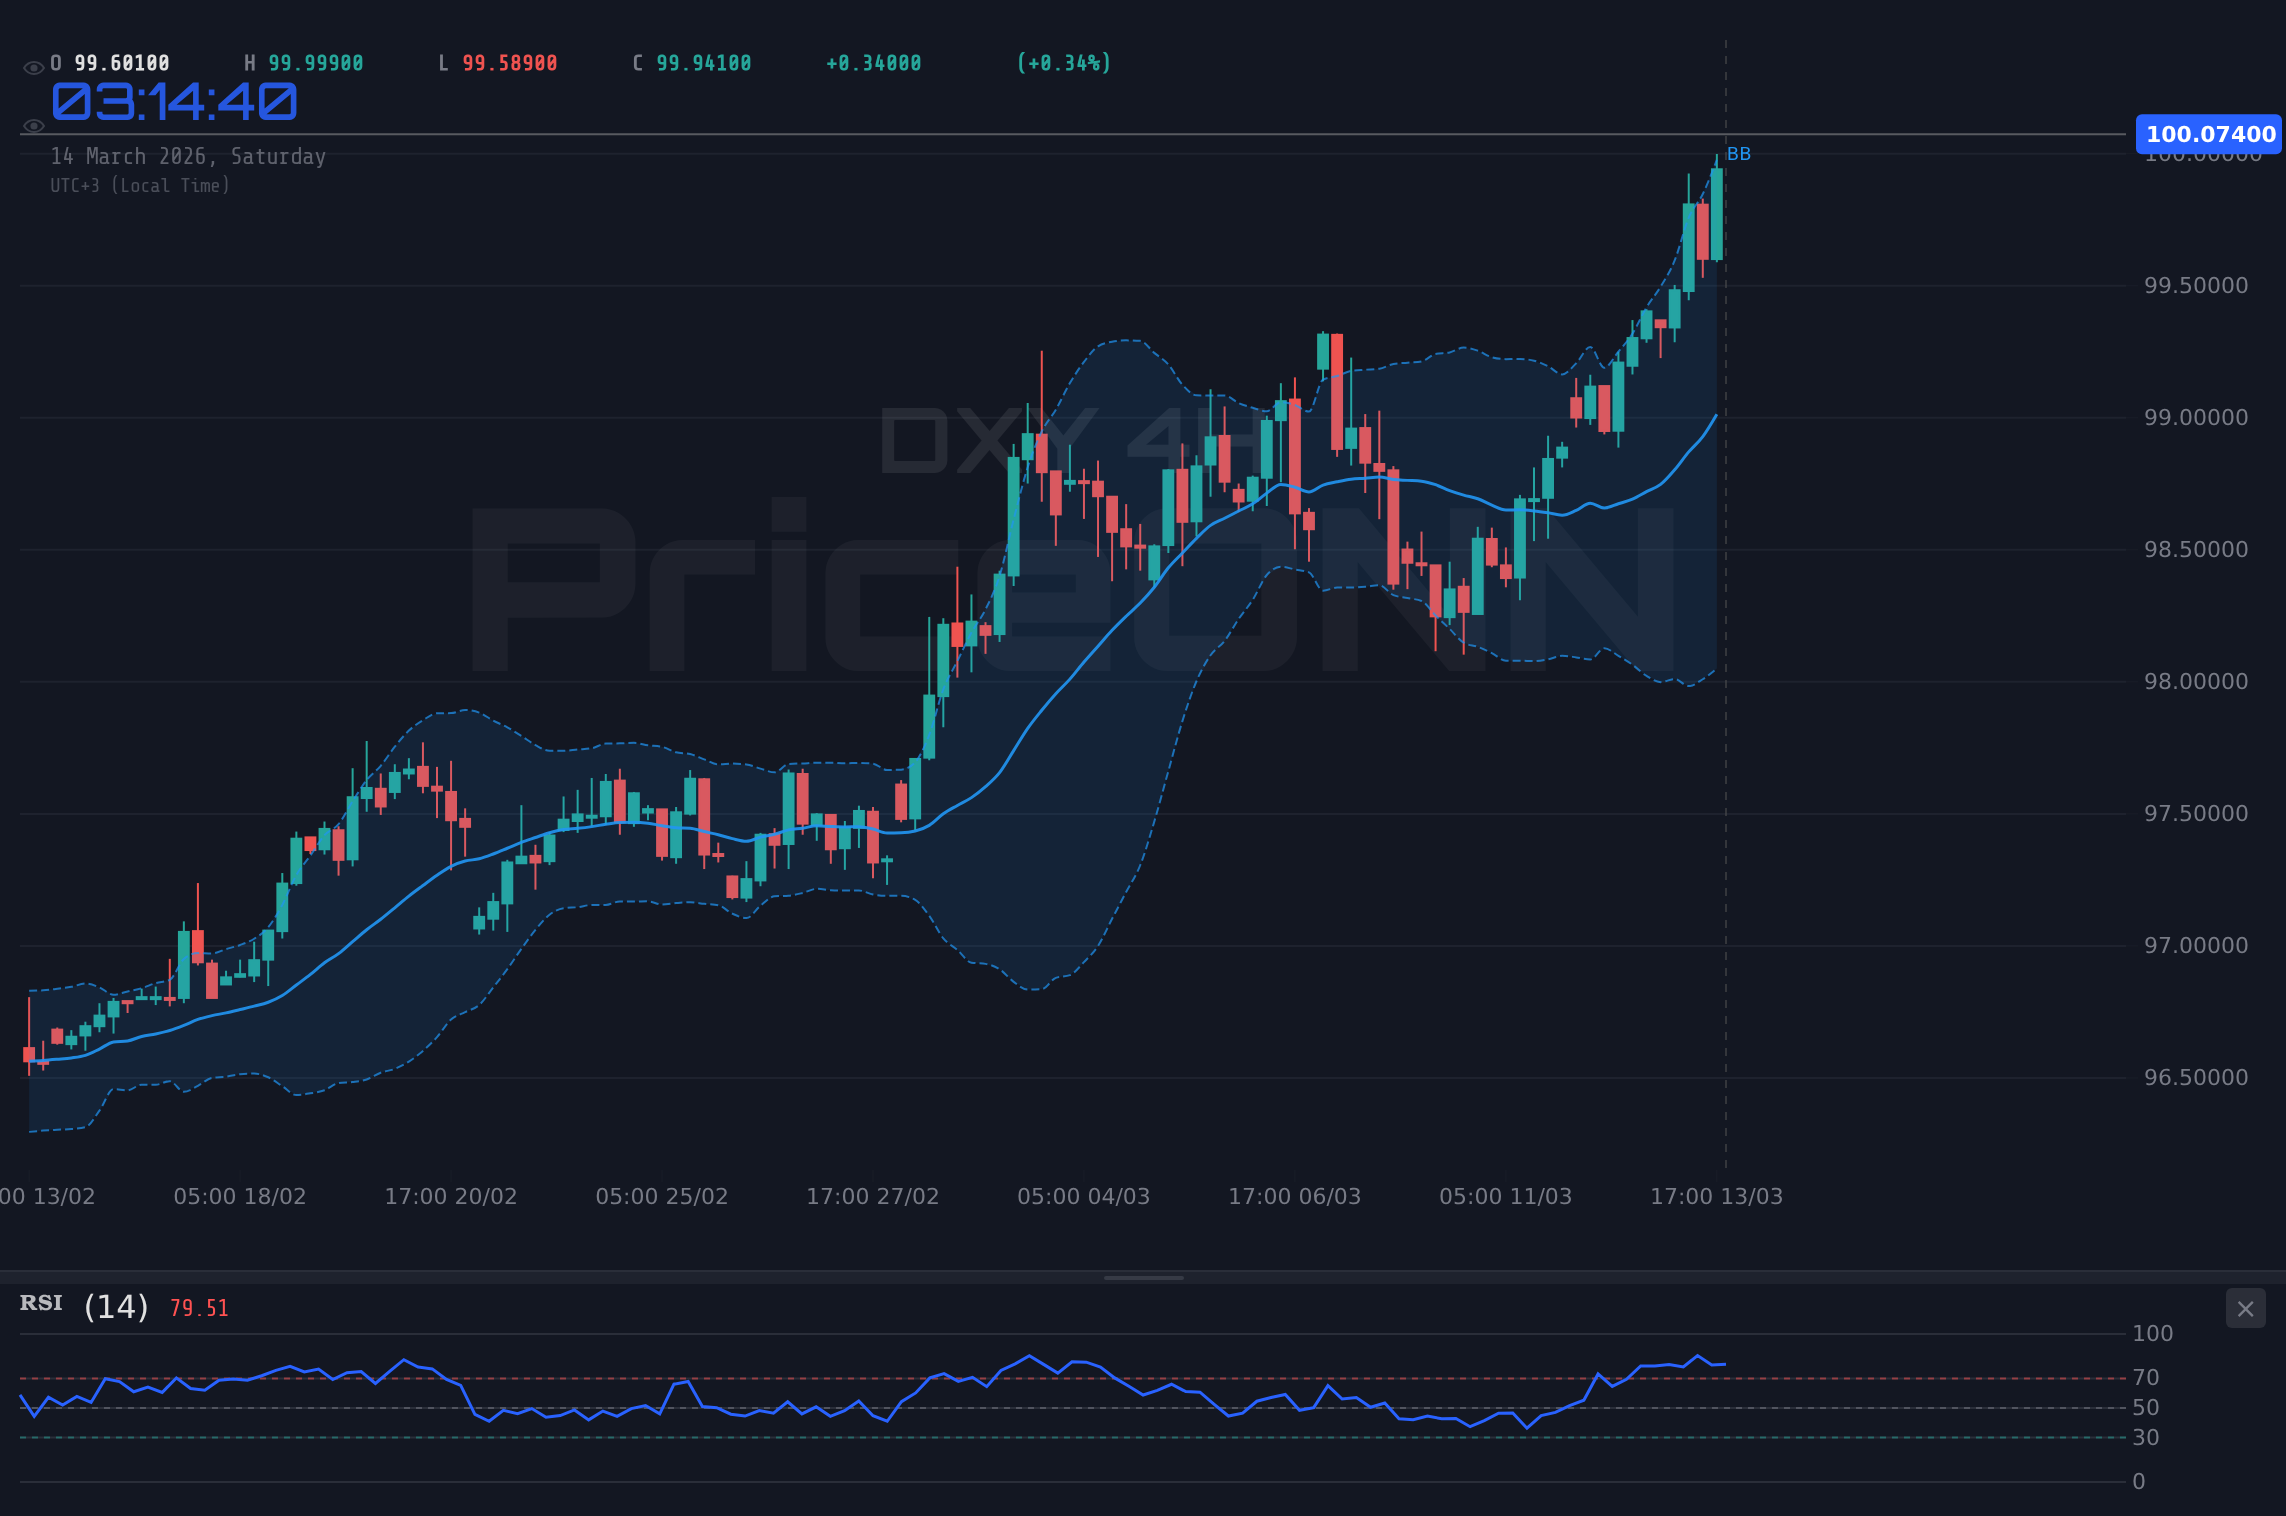
From a technical perspective, the DXY's recent surge has pushed it into overbought territory, suggesting that a pullback may be imminent. On the daily timeframe, the RSI is currently at 74.69, which is approaching overbought levels. Historically, when the RSI reaches this zone, the DXY has often experienced a period of consolidation or correction. However, the strength of the underlying trend suggests that any pullback may be limited, and the DXY could continue to grind higher. The ADX on the daily timeframe is at 29.83, indicating a strong uptrend, which supports the bullish thesis.
On the 4-hour timeframe, the RSI is at 72.7 and the ADX is at 32.13, signaling a strong uptrend, and overbought conditions. This suggests that the DXY may be overextended in the short term, and a period of consolidation or correction may be warranted. However, the overall trend remains bullish, and any pullback should be viewed as a buying opportunity. Scalpers should watch for short-term pullbacks to the 99.90 level, while swing traders should focus on the 99.48 level as a potential entry point. Long-term investors should consider adding to their positions on any significant dips, as the underlying trend remains firmly bullish.
Key Support and Resistance Levels
Identifying key support and resistance levels is crucial for understanding the DXY's potential trajectory. On the downside, immediate support lies at 99.9. A break below this level could open the door for a test of the next support level at 99.86. A sustained break below 99.06 would invalidate the bullish thesis and suggest a potential reversal. On the upside, immediate resistance is at 99.99, followed by 100.04 and 100.08. A sustained break above 100.1 could pave the way for further gains towards the next resistance level at 100.3.
These levels are not merely arbitrary numbers; they represent areas where buyers and sellers have historically shown increased activity. A test of a support level often triggers a surge in buying pressure, while a test of a resistance level often leads to increased selling pressure. Understanding these dynamics is crucial for making informed trading decisions. For instance, a scalper might look to buy near the 99.9 support level and sell near the 99.99 resistance level, while a swing trader might wait for a breakout above 100.1 to enter a long position. Similarly, long-term investors should monitor these levels to identify potential entry and exit points for their positions.
The Elliott Wave Perspective
From an Elliott Wave perspective, the DXY appears to be in the final stages of a five-wave impulse move, which typically signals the end of a bullish cycle. The current wave structure suggests that the DXY is currently in wave five, which is often characterized by increased volatility and a final push towards higher levels before a significant correction. However, Elliott Wave analysis is not an exact science, and it's important to consider other technical and fundamental factors before making any trading decisions. The current geopolitical risks and the upcoming CPI data could significantly impact the wave structure, potentially leading to an extension of the bullish cycle or a premature correction.
The Fibonacci Retracement Levels
Fibonacci retracement levels can provide valuable insights into potential support and resistance areas. Key Fibonacci levels to watch include the 38.2% retracement level at 99.77, the 50% retracement level at 99.5 and the 61.8% retracement level at 99.2. These levels represent potential areas where the DXY could find support during a pullback, or resistance during a rally. The 61.8% retracement level is particularly important, as it often acts as a strong support level during a bullish trend. A break below this level could signal a potential trend reversal, while a hold above this level would reinforce the bullish thesis.
Trade Recommendation: Bullish Continuation
Based on the multi-timeframe technical analysis, the overall trend for the DXY remains bullish. The 1-hour timeframe shows a trend that is 95% bullish. While the RSI signals overbought conditions, the strong uptrend and positive momentum suggest that the DXY is likely to continue its upward trajectory. However, the upcoming CPI data and the escalating geopolitical risks warrant a cautious approach. The DXY is showing some overbought conditions with RSI at 78.75 which could indicate a short-term pullback. As such, it is recommended to wait for a pullback to the 99.9 level before entering a long position.
The DXY continues its upward trajectory, breaking above 100.04 resistance and targeting 100.08. This scenario is contingent on the CPI data coming in line with expectations and the geopolitical risks remaining contained.
The DXY experiences a pullback, breaking below 99.9 support and targeting 99.86. This scenario is likely to occur if the CPI data comes in weaker than expected or if the geopolitical risks escalate further.
Correlation Analysis: DXY, Bonds, Equities, Oil
Understanding the correlations between the DXY and other asset classes can provide valuable insights into the overall market dynamics. Historically, the DXY has had a strong inverse correlation with gold, meaning that when the dollar strengthens, gold prices tend to fall. This is because gold is priced in dollars, and a stronger dollar makes gold more expensive for foreign buyers. The DXY also tends to have an inverse correlation with equities, as a stronger dollar can weigh on the earnings of US companies that generate a significant portion of their revenue from overseas.
However, the current market environment is more complex than usual, and these correlations may not always hold true. For instance, the spike in oil prices resulting from Middle East tensions could put upward pressure on inflation, which could lead to higher interest rates and a stronger dollar. This could create a positive correlation between oil prices and the DXY, which is the opposite of what we would typically expect. Similarly, the safe-haven demand for the dollar could outweigh the negative impact of higher interest rates on equities, leading to a decoupling of the inverse correlation between the DXY and the stock market. Therefore, it's important to carefully monitor these correlations and be prepared for unexpected shifts in market dynamics.
Risk Management Considerations
Given the high level of uncertainty surrounding the DXY, it's crucial to implement a robust risk management strategy. This includes setting stop-loss orders to limit potential losses, diversifying your portfolio to reduce exposure to any single asset class, and carefully monitoring market developments to identify potential risks and opportunities. It's also important to be aware of the potential impact of unexpected events, such as geopolitical shocks or surprise economic data releases, and to be prepared to adjust your positions accordingly. The use of leverage should be approached with caution, as it can amplify both gains and losses.
The most recent data that was released included the Producer Price Index (PPI) which measures the change in prices received by domestic producers. This can be an early indicator of inflationary pressures and can impact the DXY. The upcoming events regarding the DXY include several monetary policy statements, including the federal funds rate and inflation rate. These events will have a high impact on the DXY.
Why $100.04 is the Line in the Sand
The $100.04 level represents a critical resistance point for the DXY, as it has acted as a ceiling for the dollar's gains on multiple occasions. A sustained break above this level would confirm the bullish trend and open the door for further gains towards the next resistance level at 100.08. However, a failure to break above $100.04 could signal a potential reversal, leading to a test of the support levels at 99.9 and 99.86. Traders should closely monitor price action around this level to identify potential trading opportunities. A breakout above $100.04 should be considered a high-probability entry point for a long position, while a rejection at this level could be a signal to enter a short position.
It is important to remember that technical analysis is not an exact science, and it's always possible for the DXY to break through the $100.04 resistance level without any clear signal. In such cases, it's crucial to have a well-defined risk management strategy in place to limit potential losses. Setting stop-loss orders just below the $99.9 support level can help to protect against unexpected downside moves. Diversifying your portfolio and avoiding over-leverage can also help to reduce your overall risk exposure.
Actionable Insights for Different Trader Types
The current market environment presents a variety of trading opportunities for different types of traders. Scalpers can take advantage of the short-term volatility by buying near the 99.9 support level and selling near the 99.99 resistance level. Swing traders can wait for a breakout above 100.04 to enter a long position, targeting the 100.08 resistance level. Long-term investors should consider adding to their positions on any significant dips, as the underlying trend remains firmly bullish. However, it's important to remember that all trading decisions should be based on your individual risk tolerance and investment goals.
Scalpers should focus on the 1-hour timeframe to identify potential entry and exit points, while swing traders should focus on the 4-hour timeframe. Long-term investors should monitor the daily and weekly timeframes to get a broader perspective on the overall trend. The current RSI and ADX readings can provide valuable insights into the strength and momentum of the trend. However, it's important to consider other technical and fundamental factors before making any trading decisions.
Key Levels
Support Levels
Resistance Levels
Technical Outlook Summary
| Indicator | Value | Signal |
|---|---|---|
| RSI (14) | 74.69 | Watch |
| MACD Histogram | Positive | Bullish |
| Stochastic | 92.85 | Bullish |
| ADX | 29.83 | Strong Trend |
| Bollinger | Upper Band | Watch |
Frequently Asked Questions: DXY Analysis
What happens if DXY breaks above 100.04 resistance?
A sustained break above the 100.04 resistance level would confirm the bullish trend and open the door for further gains towards the next resistance level at 100.08. This scenario is contingent on the CPI data coming in line with expectations and the geopolitical risks remaining contained.
Should I buy DXY at current levels of $100.20 given RSI at 74.69?
Given the overbought conditions, as indicated by the RSI at 74.69, it may be prudent to wait for a pullback to the 99.9 level before entering a long position. A break above 100.04 should be considered a high-probability entry point for a long position.
Is RSI at 74.69 a sell signal for DXY right now?
While the RSI at 74.69 indicates overbought conditions, it's not necessarily a sell signal. The strong uptrend and positive momentum suggest that the DXY is likely to continue its upward trajectory. However, it's important to be aware of the potential for a pullback and to set stop-loss orders accordingly.
How will the CPI data on Wednesday affect DXY this week?
The CPI data on Wednesday is expected to be a major catalyst that could significantly impact the DXY's trajectory. A higher-than-expected CPI print would likely reinforce expectations of further interest rate hikes by the Federal Reserve, which would further boost the dollar's appeal.
Track markets in real-time
AI-powered analysis, technical indicators and real-time price data.
Join Our Telegram Channel
Breaking market news, AI analysis and trading signals instantly.
Join Channel