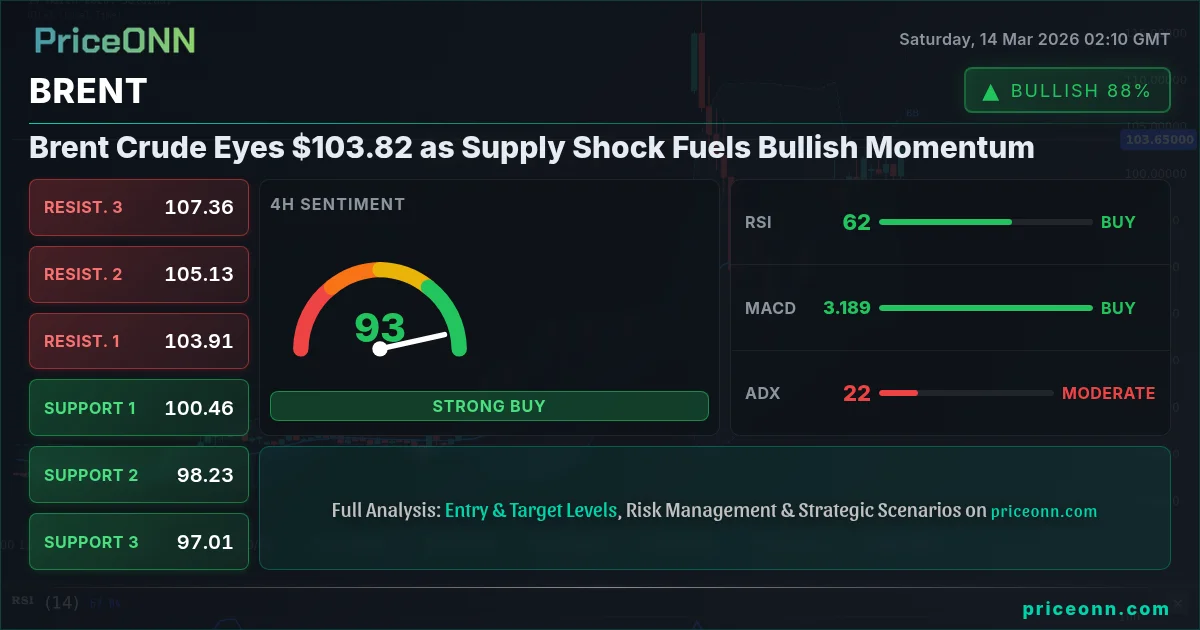
Brent Crude Eyes $103.82 as Supply Shock Fuels Bullish Momentum
Brent crude oil is trading near $103.82, driven by escalating Middle East tensions and supply concerns. Is this bullish run sustainable?
As tensions in the Middle East intensify and supply disruptions loom, Brent crude oil is trading around $103.82, a level unseen in years. The battle between bullish and bearish forces is intensifying, with the potential for a significant breakout or a sharp reversal.
- Brent crude oil currently trades at $103.82, driven by geopolitical tensions and supply concerns.
- Strong resistance is seen at $103.90, a key level to watch for a potential breakout.
- The daily RSI at 87.44 indicates overbought conditions, suggesting a possible pullback.
- Geopolitical risks and supply disruptions are the main catalysts driving BRENT correlation with DXY.
The Bull Case: Supply Shock and Geopolitical Risks
The bullish narrative for Brent crude is primarily driven by escalating geopolitical tensions in the Middle East, particularly around the Strait of Hormuz. Recent news indicates that Saudi Arabia has cut production by 20% due to ongoing conflict, creating an immediate supply shock. According to Reuters, "The market is pricing in a significant risk premium due to the potential for further disruptions." This supply shock is compounded by rising demand as economies continue to recover from the pandemic, creating a perfect storm for higher prices.
Furthermore, the US Dollar Index (DXY) is nearing 10-month highs, which historically puts pressure on commodities like oil. However, in the current environment, the geopolitical risk is overriding the dollar's strength, further supporting the bullish case. The 1H chart shows the price testing the resistance at $103.38. A break above this level could trigger a further surge, potentially targeting $106.13.
The market sentiment is also leaning towards the bullish side. According to recent reports from PriceONN, “Brent Crude Eyes $120 as Supply Shock Grips Global Markets.” This sentiment is further fueled by Goldman Sachs, who have hiked their Brent oil forecast to over $100 for March. Such strong forecasts from reputable institutions add credibility to the bullish outlook.
The Bear Case: Overbought Conditions and Potential for Correction
Despite the compelling bullish factors, there are significant bearish risks that could trigger a reversal. The most prominent is the overbought condition indicated by the Relative Strength Index (RSI). On the 1D timeframe, the RSI is at a staggering 87.44, signaling that Brent crude is significantly overbought and ripe for a correction. Historically, when the RSI reaches these levels, a pullback is imminent.
Moreover, the Stochastic oscillator on the 1D chart is showing a bearish signal, with %K at 55.32 and %D at 60.89. This suggests that the upward momentum is waning and a trend reversal could be on the horizon. Additionally, the negative momentum for BTCUSD might cause investors to liquidate certain assets which might impact investor sentiment for BRENT as well.
Another bearish factor is the potential for increased production from other oil-producing nations. If OPEC+ decides to increase output to offset the supply disruptions, it could alleviate the pressure on prices and trigger a sell-off. The overall signal is "AL" which might mean the asset is overbought and there could be a pullback.
Technical Analysis: A Battleground at $103.82
The technical picture for Brent crude is mixed, reflecting the ongoing battle between bulls and bears. The current price of $103.82 is a critical level, with both bullish and bearish indicators providing conflicting signals. The ADX on the 1D timeframe is at 55.9, indicating a very strong uptrend, which supports the bullish case. However, the RSI at 87.44 is a clear warning sign that the market is overextended.
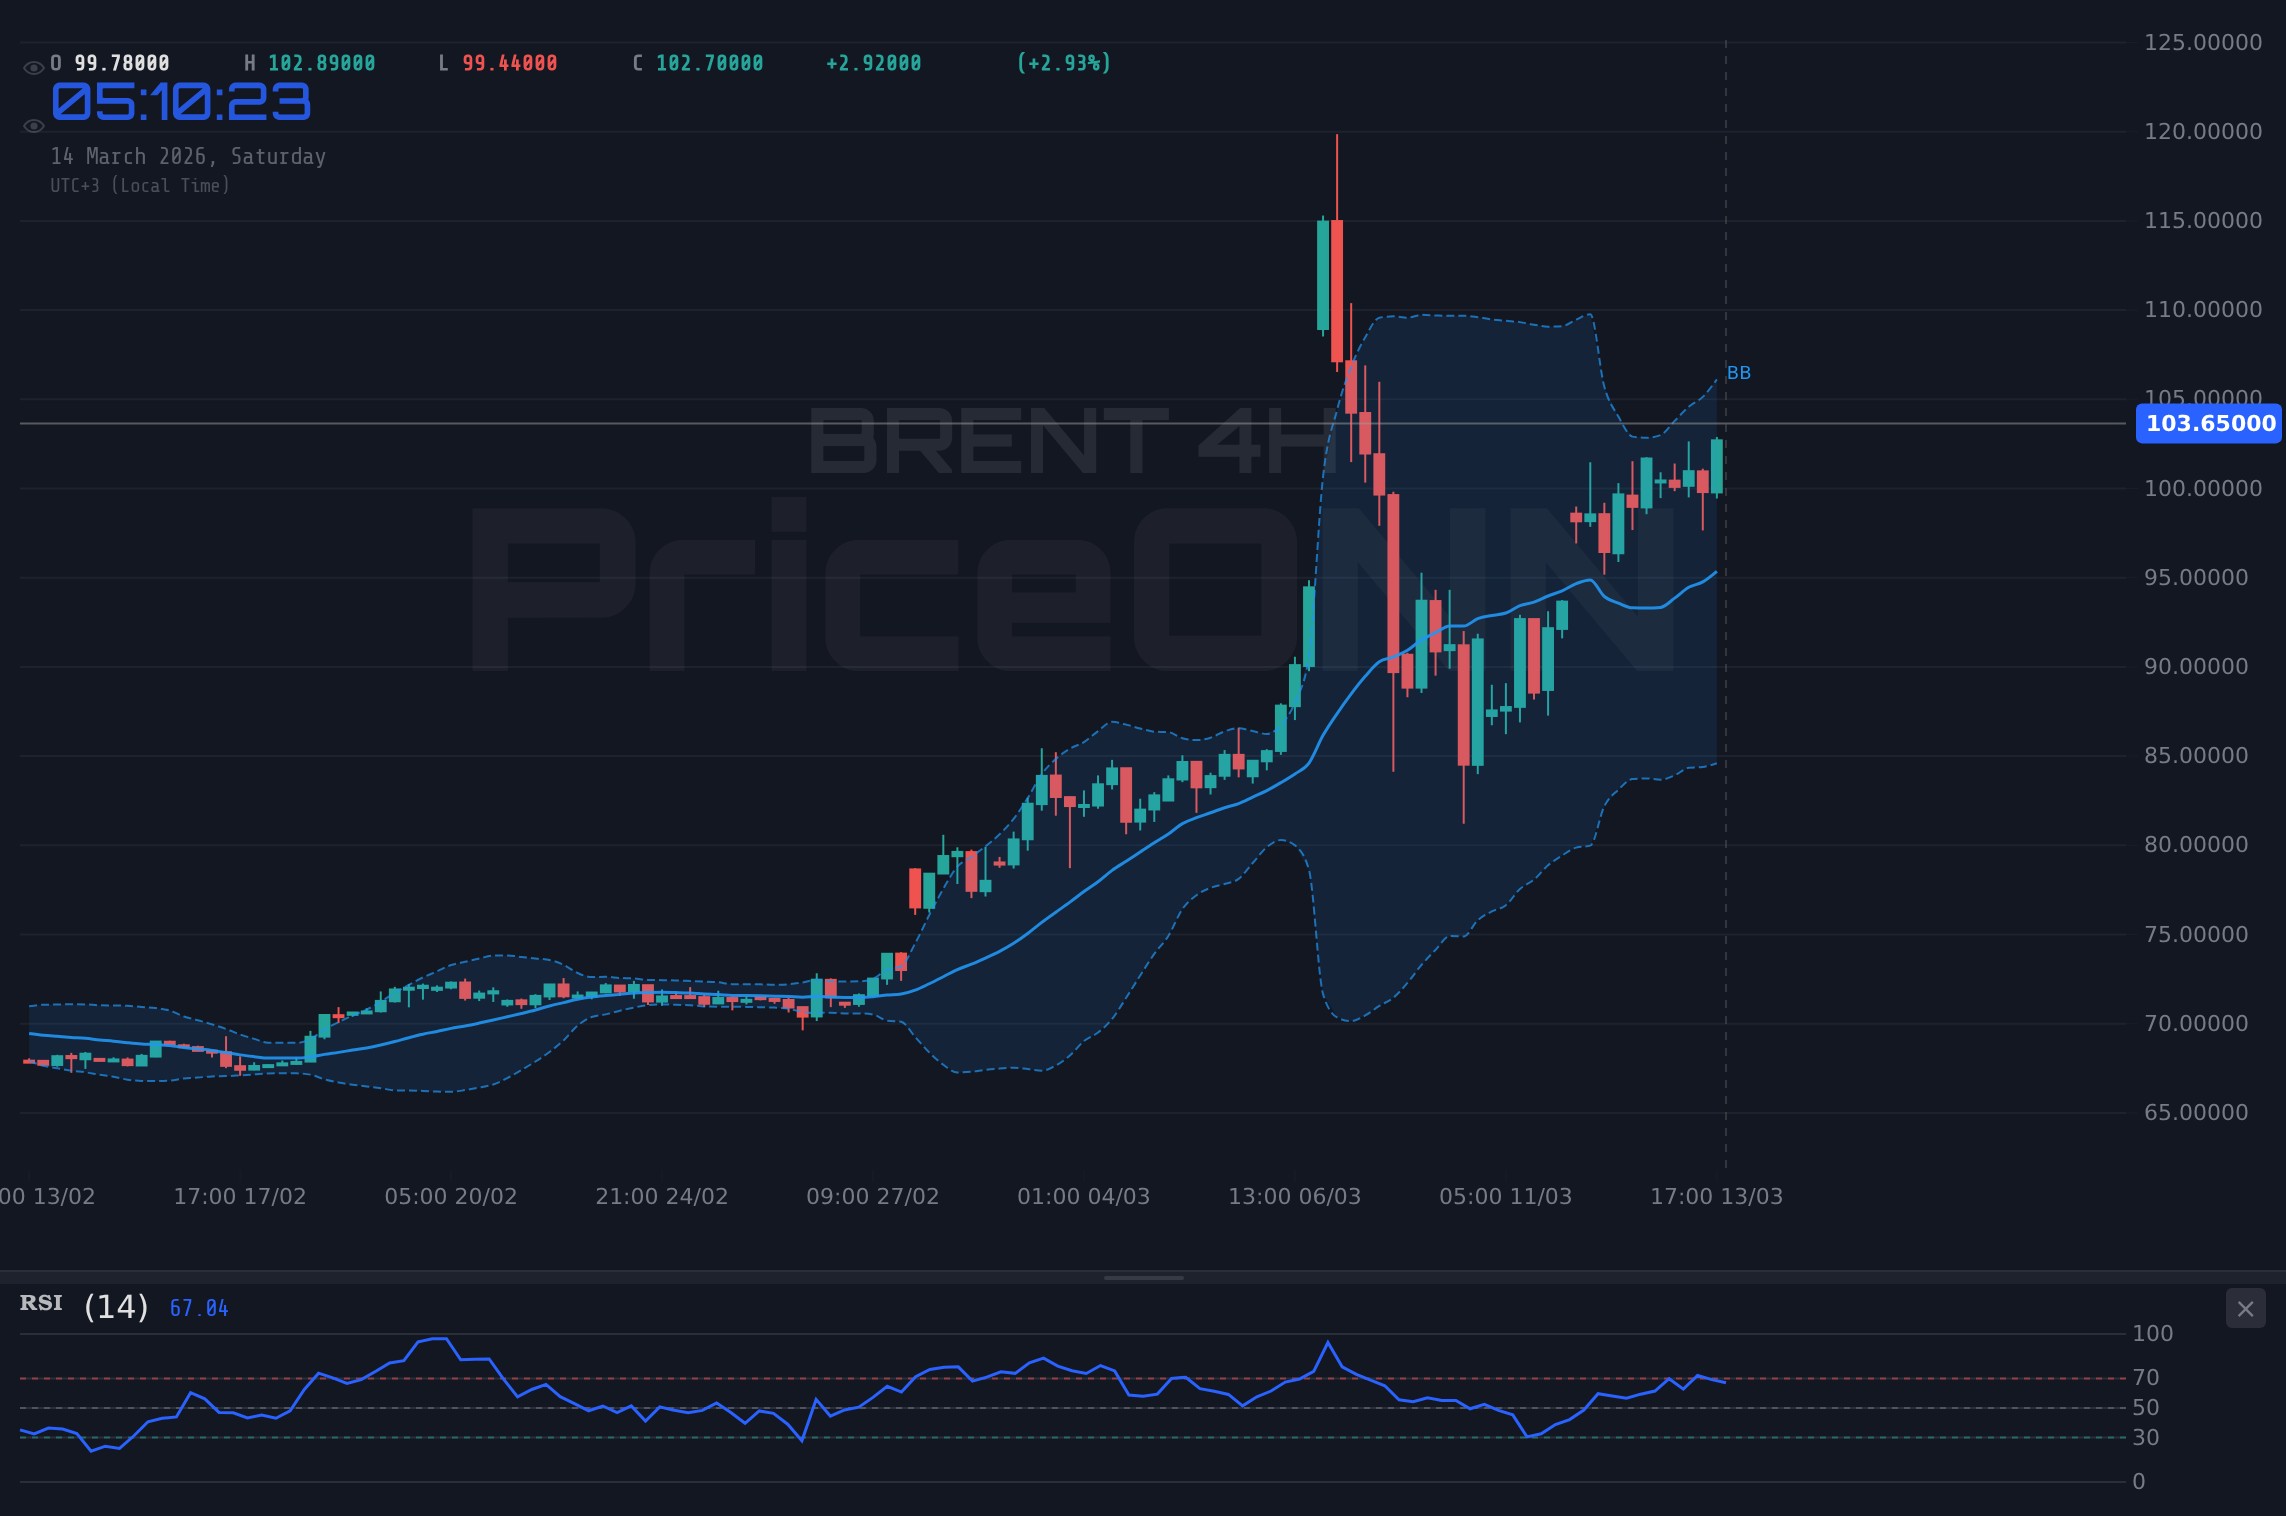
On the 4H timeframe, the MACD histogram is showing positive momentum, which suggests that the uptrend is still intact. However, the Stochastic oscillator is showing a bearish signal, indicating a potential pullback. The key support levels to watch are $101.29 (1H), $97.93 (4H), and $97.31 (1D). A break below these levels could trigger a more significant correction. Resistance levels are $103.90 (1D), $104.61 (1H), and $106.13 (1D).
The one-hour chart shows a strong uptrend with the price currently testing the $103.38 resistance. If this level breaks, the next target is $104.61. However, the RSI at 65.64 is approaching overbought territory, suggesting that the upward momentum may be slowing. The 4H chart paints a similar picture, with the price trading above the middle Bollinger Band, indicating a bullish trend. However, the Stochastic oscillator is showing a bearish signal, suggesting that a pullback could be imminent. The key level for the 4H chart is 101.39; this needs to hold for bulls to remain in control.
USD/JPY Eyes 160.00 as Geopolitical Risks Fuel Dollar Demand
The USD/JPY pair is approaching the key 160.00 level as the US Dollar strengthens amid rising geopolitical tensions in the Middle East, this might potentially affect BRENT. Traders must watch the market carefully and adapt accordingly.
Trade Plan: Cautious Optimism with a Clear Invalidation Level
Given the mixed technical picture and the high level of geopolitical risk, a cautious approach is warranted. While the bullish narrative is compelling, the overbought conditions and potential for a correction cannot be ignored.
BRENT breaks above the $103.90 resistance and continues its upward momentum, targeting $106.13 and potentially $110.49. This scenario is driven by continued supply disruptions and escalating geopolitical tensions.
BRENT fails to break above $103.90 and pulls back, finding support at $101.29 and potentially $97.31. This scenario is driven by overbought conditions, increased production, or a de-escalation of geopolitical tensions.
Risk/Reward Analysis
The risk/reward ratio for a long position at current levels is not particularly attractive, given the overbought conditions. A more prudent approach would be to wait for a pullback to a key support level, such as $101.29, before initiating a long position. The invalidation level for the bullish thesis is a close below $97.31, which would signal a more significant trend reversal.
Economic Calendar: CPI Data Ahead
The upcoming CPI data will be crucial in determining the direction of Brent crude. Higher-than-expected inflation data could fuel further gains, as oil is often seen as an inflation hedge. However, weaker-than-expected data could trigger a sell-off, as it would signal a slowdown in economic growth and reduced demand for oil. Investors are waiting for USD reports on March 13th.
Frequently Asked Questions: BRENT Analysis
What happens if BRENT breaks above $103.90 resistance?
If BRENT breaks above the $103.90 resistance, it is likely to continue its upward momentum, targeting the next resistance level at $106.13. This breakout would confirm the bullish trend and could attract further buying pressure.
Should I buy BRENT at current $103.82 levels given RSI at 87.44?
Given the overbought conditions indicated by the RSI at 87.44, it is not advisable to initiate a long position at current levels. A more prudent approach would be to wait for a pullback to a key support level, such as $101.29, before buying.
Is RSI at 87.44 a sell signal for BRENT right now?
While an RSI of 87.44 indicates overbought conditions, it is not necessarily a sell signal on its own. It is important to consider other factors, such as the overall trend and the presence of any bearish catalysts. A confirmed break below a key support level would provide a stronger sell signal.
How will the CPI affect BRENT this week?
Higher-than-expected CPI data could fuel further gains in Brent crude, as oil is often seen as an inflation hedge. However, weaker-than-expected data could trigger a sell-off, as it would signal a slowdown in economic growth and reduced demand for oil.
Technical Outlook Summary
| Indicator | Value | Signal |
|---|---|---|
| RSI (14) | 87.44 | Overbought |
| MACD Histogram | Positive | Bullish |
| Stochastic | 55.32/60.89 | Bearish |
| ADX | 55.9 | Strong Trend |
| Bollinger | Upper Band | Watch |
Key Levels
Support Levels
Resistance Levels
Track markets in real-time
AI-powered analysis, technical indicators and real-time price data.
Join Our Telegram Channel
Breaking market news, AI analysis and trading signals instantly.
Join Channel