GBPUSD Retreats to $1.33 Support as Oil Surge Intensifies
GBPUSD is testing support at $1.33 amid a surge in oil prices, now at $100.12 a barrel. Geopolitical tensions and dollar strength add to the pressure on the pair.
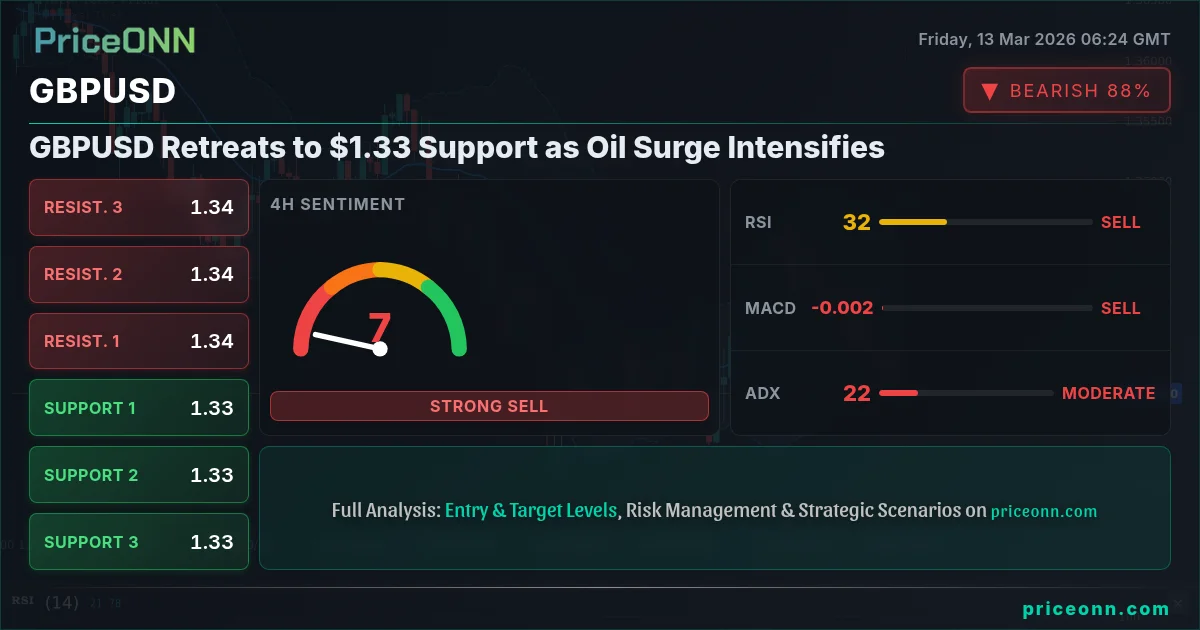
GBPUSD is currently trading near the $1.33 level, a critical juncture as it grapples with a confluence of bearish factors. The pair is facing headwinds from a strengthening US dollar, fueled by risk aversion amid escalating geopolitical tensions in the Middle East, and a surge in oil prices, now with Brent crude at $100.12 a barrel. This combination is testing the resolve of GBPUSD bulls.
- RSI at 35.62 on the 1H chart suggests potential for further downside momentum.
- Key support level sits at 1.33125, a break below which could trigger a sharper sell-off.
- The strengthening DXY, currently at 99.62, is putting significant pressure on GBPUSD.
- Geopolitical tensions and rising oil prices are exacerbating the bearish sentiment around GBPUSD.
The technical picture for GBPUSD is predominantly bearish. On the 1-hour timeframe, the Relative Strength Index (RSI) is at 35.62, indicating that there is room for further downside before the pair reaches oversold territory. This suggests that the bears are still in control in the short term. The Moving Average Convergence Divergence (MACD) histogram also shows negative momentum, reinforcing the bearish outlook. Furthermore, the Stochastic oscillator, with %K at 15.81 and %D at 48.52, signals a bearish trend, with %K
Looking at the 4-hour chart, the bearish sentiment persists. The RSI is at 39.98, still in neutral territory but trending downwards. The MACD continues to display negative momentum, and the Stochastic oscillator is in oversold territory, with %K at 9.38 and %D at 14.52. This oversold condition could lead to a short-term bounce, but the overall trend remains bearish. The Average Directional Index (ADX) at 20.64 suggests a moderate downtrend.
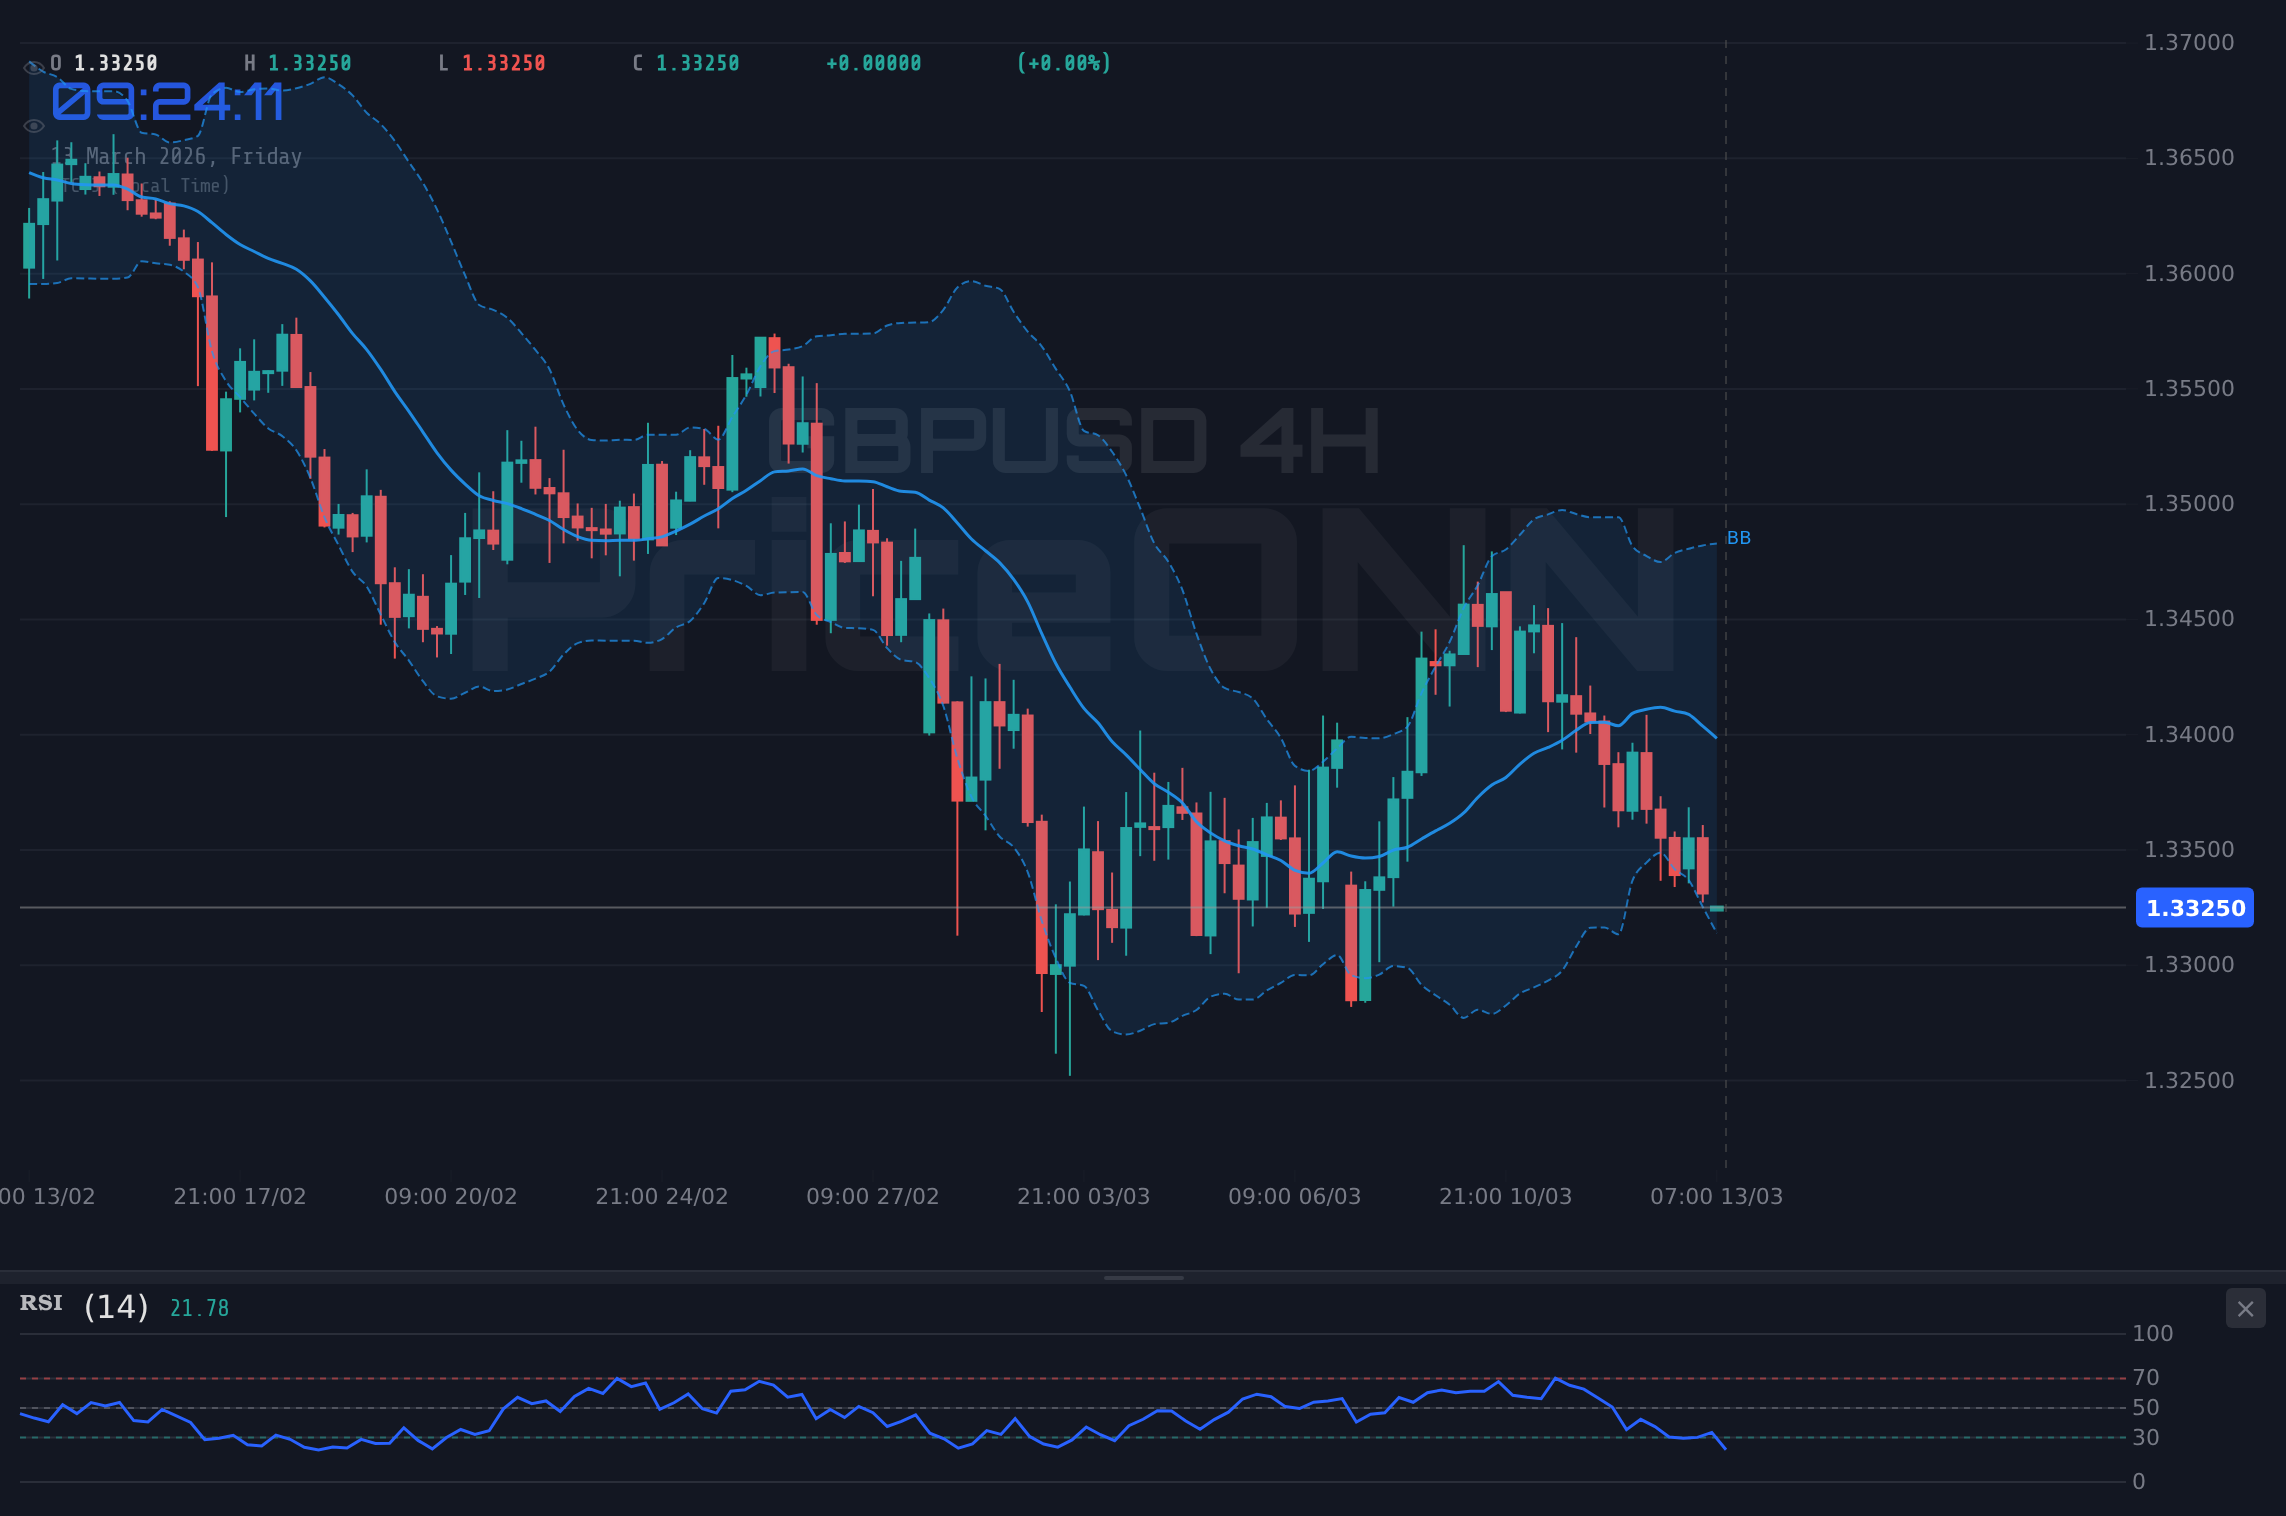
On the daily timeframe, the bearish trend is even more pronounced. The RSI is at 36.66, indicating further downside potential. The MACD continues to show negative momentum, and the Stochastic oscillator is in a bearish configuration, with %K at 43.33 and %D at 46.65. The ADX at 28.34 confirms a strong downtrend.
From a support and resistance perspective, GBPUSD faces immediate support at 1.33125, as per the 1D timeframe data. A break below this level could open the door for a move towards the next support level at 1.32858. On the upside, resistance lies at 1.33872, followed by 1.34352. These levels will be crucial to watch for potential breakout or breakdown scenarios.
The strength of the US dollar, as indicated by the DXY at 99.62, is a significant headwind for GBPUSD. The DXY is exhibiting a strong uptrend across all timeframes, with the daily RSI at 70.91, signaling overbought conditions. This suggests that the dollar may be due for a pullback, which could provide some relief for GBPUSD. However, the overall trend for the dollar remains bullish.
The surge in oil prices, driven by geopolitical tensions in the Middle East, is also weighing on GBPUSD. According to news reports, WTI crude oil is eyeing $100 as Strait of Hormuz tensions escalate. This is fueling inflation concerns and adding to the risk-off sentiment in the market, which is benefiting the US dollar. As reported by Reuters, Fed officials are closely monitoring the situation, with some emphasizing that inflation remains 'stubborn'.
Given the current technical and fundamental backdrop, a bearish trade stance on GBPUSD appears warranted. However, traders should be mindful of the oversold conditions on the shorter timeframes, which could lead to a temporary bounce. Patience and disciplined risk management are key.
GBPUSD breaks below the 1.33125 support level, triggering a sell-off towards 1.32858 and potentially 1.32378. This scenario is likely if the DXY continues its ascent and risk aversion persists.
GBPUSD rebounds from the 1.33125 support, targeting the 1.33872 resistance level. A break above this level could lead to a test of 1.34352. This scenario is less probable given the current bearish momentum.
The economic calendar also presents potential catalysts for GBPUSD. Data releases could inject volatility into the pair. Traders should monitor these events closely for potential trading opportunities.
For traders considering short positions, a potential entry trigger would be a break below the 1.33125 support level. A reasonable target would be the next support level at 1.32858, with a stop-loss placed above the 1.33872 resistance level. This trade offers a risk/reward ratio that is favorable, given the current technical picture.
Technical Outlook Summary
| Indicator | Value | Signal |
|---|---|---|
| RSI (14) | 36.66 | Bearish |
| MACD Histogram | Negative | Bearish |
| Stochastic | 43.33/46.65 | Bearish |
| ADX | 28.34 | Strong Trend |
| Bollinger | Middle Band | Watch |
Key Levels
Support Levels
Resistance Levels
Frequently Asked Questions: GBPUSD Analysis
What happens if GBPUSD breaks below 1.33125 support?
If GBPUSD breaks below the 1.33125 support level, a further decline towards the next support at 1.32858 becomes highly probable, potentially extending towards 1.32378 if bearish momentum intensifies. This breakdown would confirm the prevailing downtrend indicated by the daily RSI and MACD.
Should I sell GBPUSD at current levels of $1.33 given the 1H RSI at 35.62?
The 1H RSI at 35.62 suggests further downside potential, but it's not yet in oversold territory. A cautious approach would involve waiting for a confirmed break below 1.33125 before initiating a short position, targeting 1.32858 with a stop-loss above 1.33872.
Is the Stochastic at 43.33/46.65 a reliable sell signal for GBPUSD on the daily chart?
The Stochastic at 43.33/46.65 on the daily chart indicates bearish momentum, but it should be used in conjunction with other indicators. The MACD histogram confirms negative momentum, suggesting a higher probability of further downside movement.
How will the upcoming data affect GBPUSD this week?
Data releases could inject volatility into GBPUSD. The market will be paying close attention to the numbers. Any significant deviation from expectations could trigger a sharp move in GBPUSD, either confirming the bearish trend or prompting a short-term bounce.
Track markets in real-time
AI-powered analysis, technical indicators and real-time price data.
Join Our Telegram Channel
Breaking market news, AI analysis and trading signals instantly.
Join Channel