Have you ever felt like you're navigating a ship through a storm, constantly adjusting your sails as the winds shift? That’s often the reality for traders, and today, XAUUSD finds itself in just such a situation, currently trading at $5,021.73. The key question now: Will this pullback lead to a deeper correction, or is it a buying opportunity before the next leg up? The answer may hinge on upcoming CPI data.
- XAUUSD faces downward pressure as the Dollar Index (DXY) reaches 100.2, signaling dollar strength.
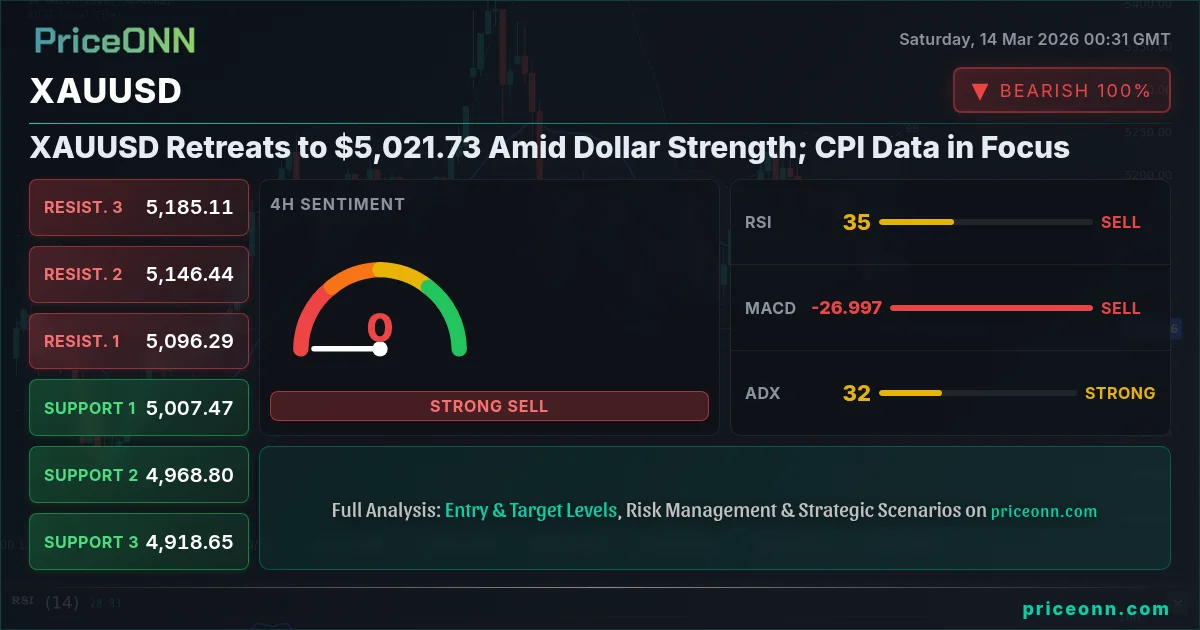
- Key support levels to watch are $5,025.47, $4,972.12, and $4,889.14, while resistance sits at $5,161.80.
- The 1H RSI at 28.53 indicates oversold conditions, potentially signaling a short-term bounce.
- Upcoming CPI data will be crucial in determining the direction of both the dollar and gold.
The recent pullback in XAUUSD is largely attributed to a strengthening US dollar. The Dollar Index (DXY) has surged to 100.2, reflecting increased demand for the greenback amid heightened geopolitical tensions and expectations of continued hawkish monetary policy from the Federal Reserve. As the DXY strengthens, it typically exerts downward pressure on gold, which is priced in dollars. This inverse correlation is a critical dynamic traders must monitor. The recent news of escalating tensions in the Middle East as well as Goldman Sachs hiking Brent oil forecast further fueled the dollar strength. This is a classic risk-off scenario, where investors flock to the safety of the dollar, often at the expense of other assets like gold.
From a technical perspective, XAUUSD's one-hour chart paints a compelling picture. The RSI (Relative Strength Index) sits at 28.53, deep in oversold territory. This suggests that the recent selling pressure may be overextended, and a short-term bounce could be in the cards. However, traders should be cautious about relying solely on the RSI. The MACD (Moving Average Convergence Divergence) indicator still shows negative momentum, with the MACD line below the signal line. This indicates that the downtrend is still intact, and any bounce may be short-lived. The ADX (Average Directional Index) at 41.71 confirms the strength of the current downtrend on the 1H timeframe. This means that counter-trend trades should be approached with caution and tight stop-loss orders.
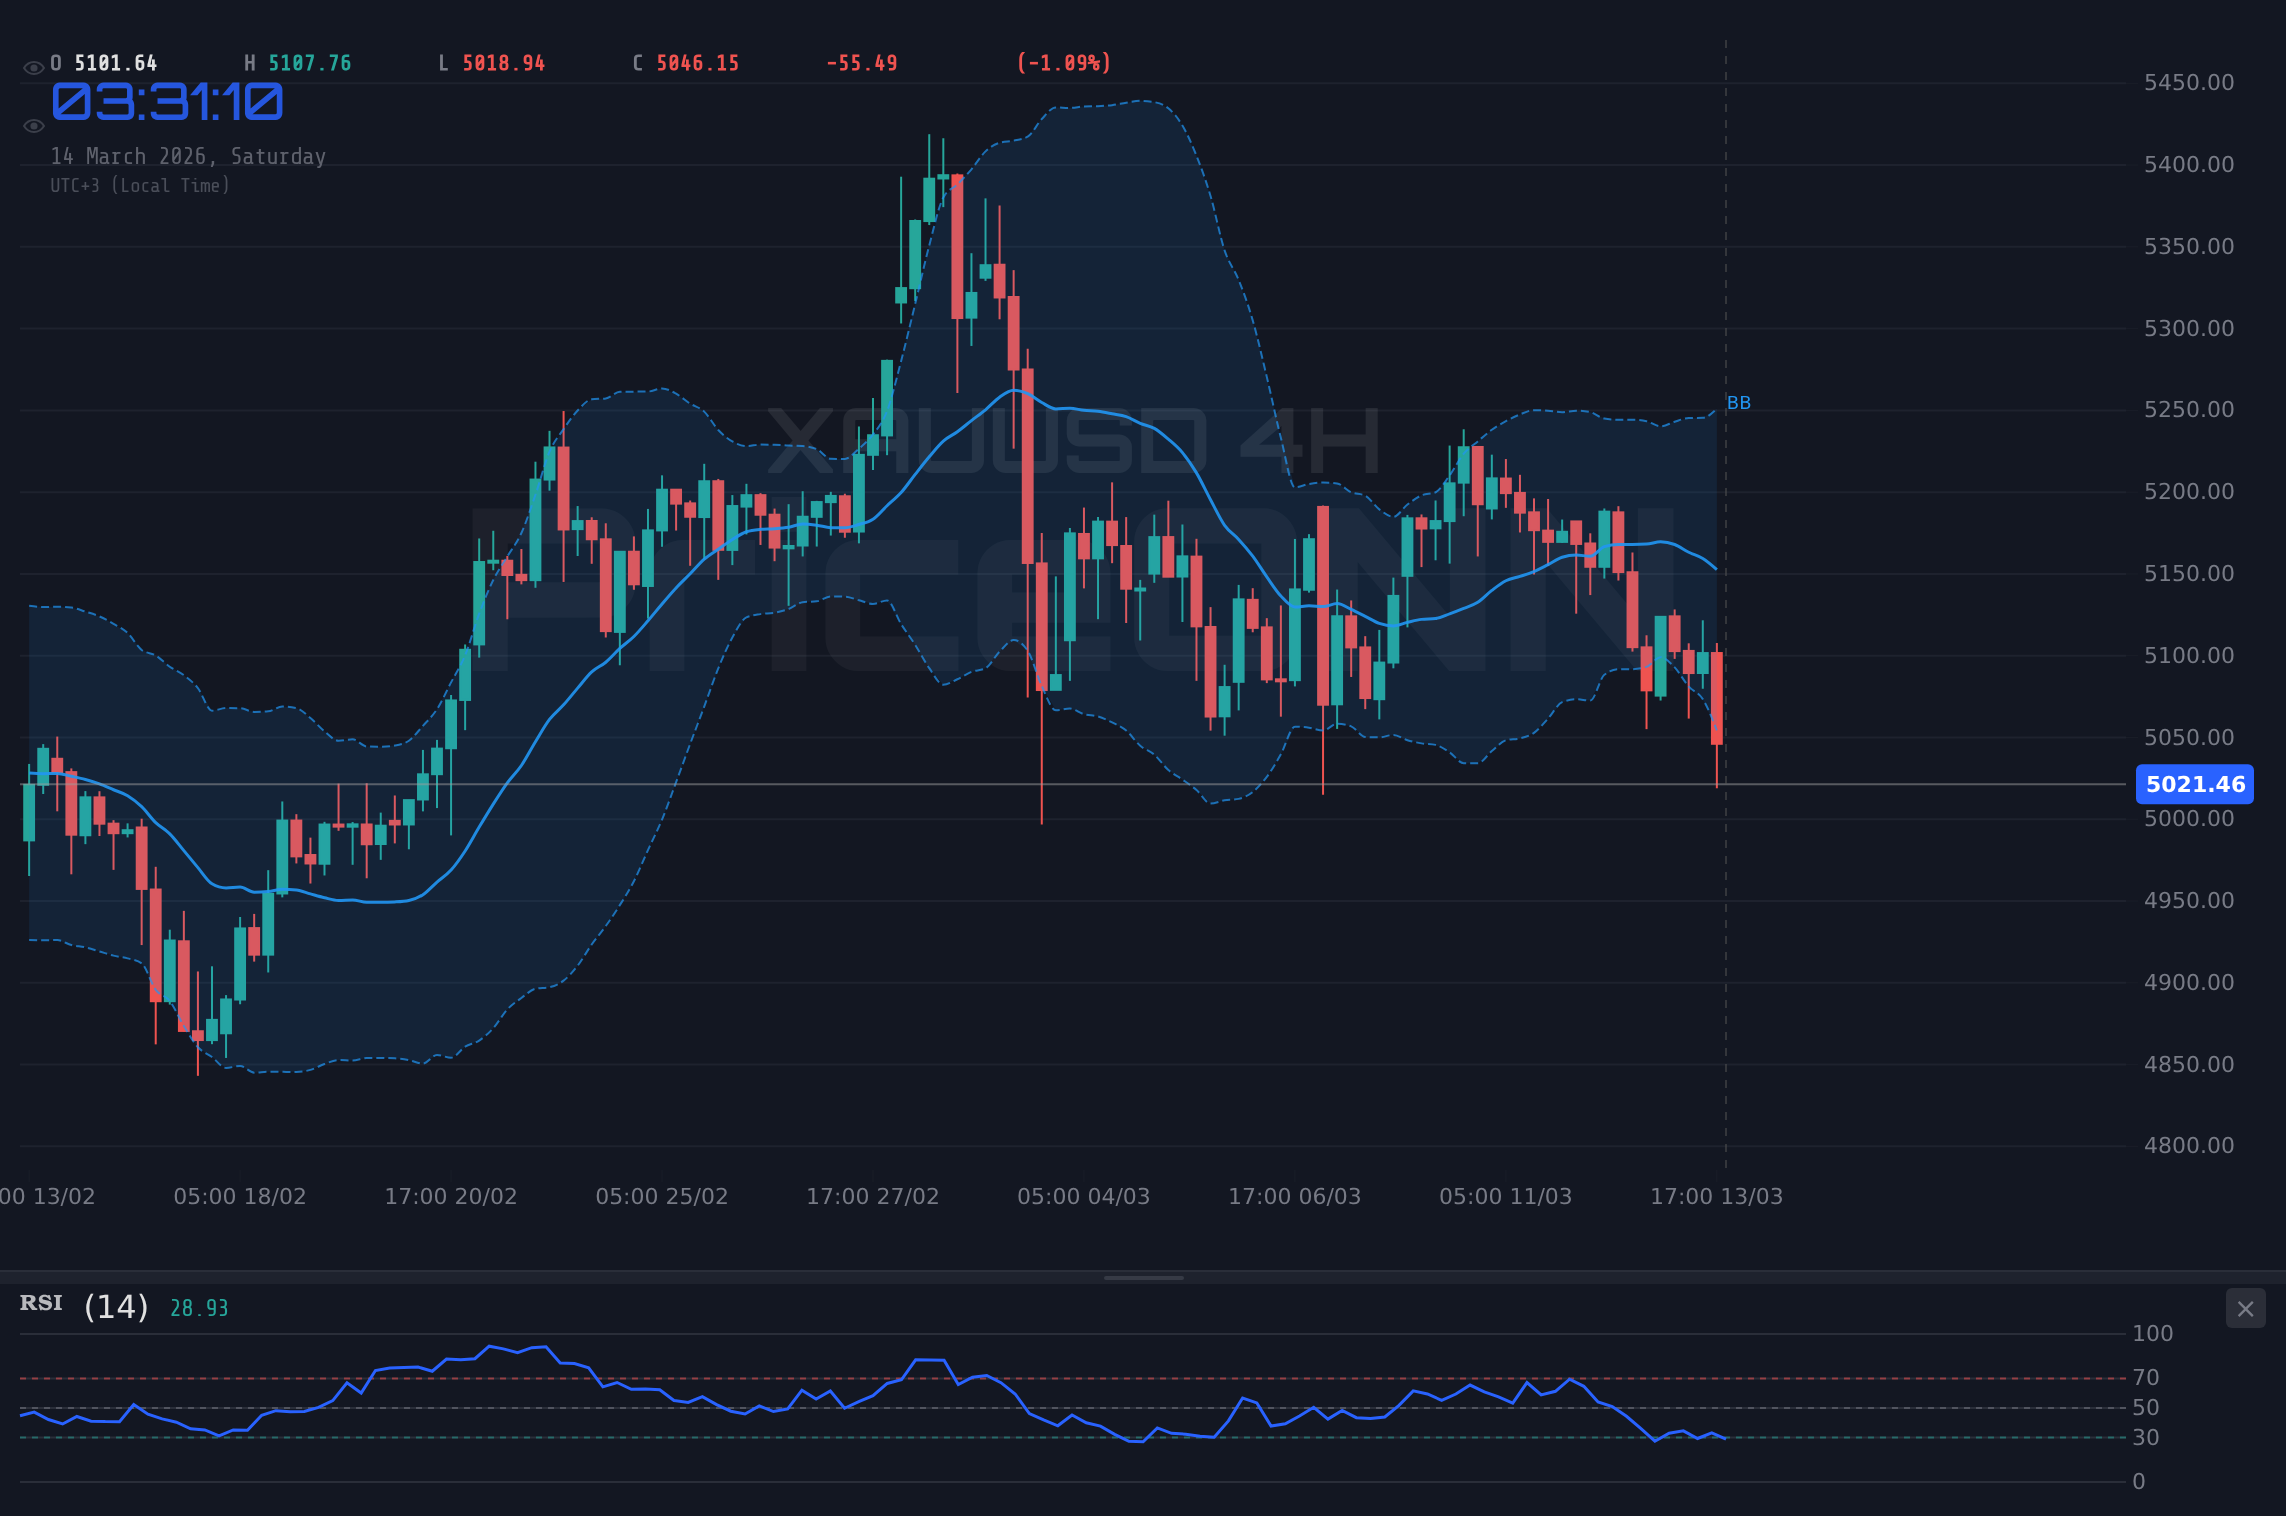
Stepping back to the four-hour timeframe, we see a slightly different picture. While the overall trend is still neutral, the RSI at 34.73 suggests that there's room for further downside before XAUUSD reaches truly oversold conditions. The MACD also remains negative, reinforcing the bearish sentiment. However, the ADX at 30.96 indicates a strong trend, whether bullish or bearish, is still in play. This lack of clear directional bias on the 4H timeframe highlights the current uncertainty in the market.
Zooming out to the daily chart, the technical outlook becomes even more nuanced. The daily RSI at 47.85 is in neutral territory, suggesting that XAUUSD could move in either direction. The MACD histogram is negative, indicating bearish momentum, but the ADX at a low 12.18 suggests a weak trend, meaning that the price is essentially moving sideways. The key takeaway from the daily chart is that XAUUSD is currently in a consolidation phase, waiting for a catalyst to trigger the next major move.
So, what are the key levels to watch? On the downside, immediate support lies at $5,025.47, followed by $4,972.12 and $4,889.14. A break below $5,025.47 could trigger a cascade of selling, potentially pushing XAUUSD down to the $4,972.12 level. On the upside, initial resistance sits at $5,161.80, followed by $5,244.78 and $5,298.13. A sustained move above $5,161.80 would signal that the bulls are back in control and could pave the way for a retest of the recent highs.
The correlation between XAUUSD and the DXY is a crucial factor to consider. As the DXY strengthens, it typically exerts downward pressure on gold. Traders should closely monitor the DXY's movement and be aware of potential inflection points. A reversal in the DXY could provide a tailwind for XAUUSD. Conversely, continued DXY strength could exacerbate the selling pressure on gold. Additionally, keep an eye on risk sentiment as measured by the SP500 and Nasdaq. A significant drop in equity markets could trigger safe-haven demand for gold, providing a temporary reprieve from the dollar's strength. Right now, the SP500 is also trending downward at 6625.3, further weighing on XAUUSD.
Looking ahead to next week, all eyes will be on the CPI data. The market is expecting to see a continued rise in inflation, which could prompt the Federal Reserve to maintain its hawkish stance. If the CPI data comes in hotter than expected, it would likely fuel further dollar strength and exert additional downward pressure on XAUUSD. Conversely, a weaker-than-expected CPI reading could signal that inflation is cooling, potentially leading to a pause in the Fed's rate hikes and a weaker dollar, which would be positive for gold. It's also important to consider the geopolitical landscape. Any escalation of tensions in the Middle East or other regions could trigger safe-haven demand for gold, regardless of the dollar's movements.
For scalpers, the oversold RSI on the one-hour chart may present a short-term buying opportunity. However, it's crucial to be nimble and manage risk tightly, as the overall trend remains bearish. Swing traders may want to wait for a clearer directional signal before taking a position. A break above $5,161.80 or below $5,025.47 could provide a high-probability entry point. Long-term investors should focus on the big picture and consider the potential impact of inflation and geopolitical risks on gold. The current pullback may present a buying opportunity for those with a long-term bullish outlook, but it's essential to remain patient and disciplined.
Now, let's consider three potential scenarios for XAUUSD this week. Each of these scenarios requires specific triggers and price action. Understanding these can help us anticipate the market's next move and position ourselves accordingly. By considering multiple possibilities, we avoid being blindsided and improve our chances of success, regardless of what the market throws our way.
If XAUUSD breaks above the $5,161.80 resistance, it could trigger a rally towards $5,244.78 and potentially $5,298.13. This scenario would likely be fueled by weaker-than-expected CPI data or an escalation of geopolitical tensions.
A close below $5,025.47 would confirm the bearish trend and could lead to a test of the $4,972.12 and $4,889.14 support levels. This scenario would likely be driven by stronger-than-expected CPI data and continued dollar strength.
A third scenario is also possible: a range-bound consolidation. In this scenario, XAUUSD remains stuck between $5,025.47 and $5,161.80, lacking a clear directional catalyst. This could occur if the CPI data comes in line with expectations, leaving the market in a state of uncertainty. In this case, scalpers may find opportunities within the range, while swing traders should remain on the sidelines until a breakout occurs.
Which scenario is most likely? Based on the current technical picture and the anticipation of key CPI data, the bearish scenario holds a slightly higher probability (45%). The strong dollar and the negative momentum on the daily chart suggest that XAUUSD is vulnerable to further downside. The bullish scenario is assigned a 30% probability, as it would require a significant catalyst to overcome the dollar's strength. The range-bound scenario has a 25% probability, as the market is likely to react strongly to the CPI data, preventing a prolonged period of consolidation.
What I'm watching this week: First, the DXY. Continued strength above 100.2 will spell trouble for XAUUSD. Second, the CPI data. A print above expectations will likely trigger a selloff in gold. Third, geopolitical headlines. Any escalation of tensions could provide a temporary boost to XAUUSD, regardless of the other factors.
Technical Outlook Summary
| Indicator | Value | Signal |
|---|---|---|
| RSI (14) | 28.53 | Oversold |
| MACD Histogram | Negative | Bearish |
| Stochastic | K=21.39, D=26.44 | Bearish |
| ADX | 41.71 | Strong Trend |
| Bollinger | Middle Band | Bearish |
Key Levels
Support Levels
Resistance Levels
Upcoming CPI data could trigger significant volatility in XAUUSD. Manage your risk accordingly.
Frequently Asked Questions: XAUUSD Analysis
What happens if XAUUSD breaks below $5,025.47 support?
A break below the $5,025.47 support level could trigger a sharp sell-off, potentially leading to a test of the $4,972.12 and $4,889.14 levels. This scenario would likely be fueled by stronger-than-expected CPI data and continued dollar strength.
Should I buy XAUUSD at current levels of $5,021.73 given the oversold RSI?
While the oversold RSI on the one-hour chart may present a short-term buying opportunity, the overall trend remains bearish. A more prudent approach would be to wait for a clearer directional signal, such as a break above $5,161.80 resistance.
Is an ADX of 41.71 a reliable signal for a strong downtrend on the 1H timeframe?
Yes, an ADX reading of 41.71 indicates a strong downtrend is in play on the one-hour timeframe. This suggests that counter-trend trades should be approached with caution and tight stop-loss orders.
How will the upcoming CPI data affect XAUUSD this week?
The CPI data will be a major catalyst for XAUUSD. A hotter-than-expected reading would likely fuel further dollar strength and exert additional downward pressure on gold, while a weaker-than-expected reading could lead to a weaker dollar and a rally in gold.
Track markets in real-time
AI-powered analysis, technical indicators and real-time price data.
Join Our Telegram Channel
Breaking market news, AI analysis and trading signals instantly.
Join Channel