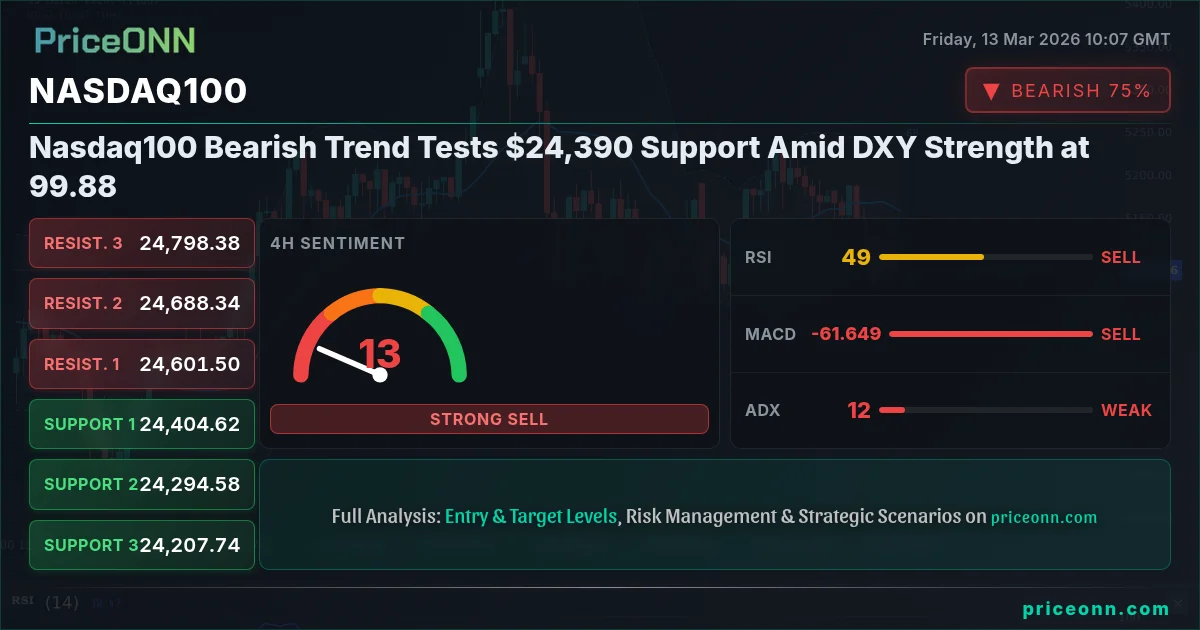
As the Dollar Index (DXY) surges to 99.88, a level not seen in weeks, Nasdaq100 today analysis reveals a bearish trend testing the crucial $24,390 support. This confluence of a strengthening dollar and weakening risk appetite, fueled by escalating tensions in the Middle East, presents a challenging environment for tech stocks and the broader market.
- Nasdaq100 is testing critical support at $24,390 after a daily decline of -0.01%.
- The Dollar Index (DXY) at 99.88 is putting downward pressure on Nasdaq100 and other risk assets.
- ADX at 38.15 suggests a strong bearish trend, but Stochastic at 39.88 signals potential oversold conditions.
- Geopolitical risks, particularly tensions in the Strait of Hormuz, are adding to market uncertainty.
Decoding the DXY-Nasdaq100 Inverse Relationship
The inverse correlation between the Dollar Index (DXY) and Nasdaq100 is a key dynamic to watch. As the dollar strengthens, it typically puts downward pressure on risk assets like tech stocks. With the DXY currently at 99.88 and showing a strong upward trend (ADX: 38.89 on the 1H chart), Nasdaq100 is facing headwinds. This is further compounded by rising oil prices, with WTI crude oil trading above $95 a barrel due to escalating tensions in the Middle East. These inflationary pressures could prompt the Federal Reserve to maintain a hawkish stance, further supporting the dollar and weighing on equities.
Technical Breakdown: Bearish Signals Accumulate
The technical picture for Nasdaq100 paints a cautious outlook. The index is currently trading at $24,541.63, and the 1-hour chart shows a clear downtrend with 100% strength. Key support levels to watch are $24,416.46, $24,336.38, and $24,291.34. Resistance levels are at $24,541.58, $24,586.62, and $24,666.7. The RSI(14) at 43.08 indicates neutral conditions, but the MACD histogram shows negative momentum, suggesting further downside potential. The Stochastic oscillator, with K=39.88 and D=39.53, is giving a buy signal, but this may be a temporary reprieve in a broader bearish trend.
Risk Sentiment and Geopolitical Crosscurrents
Market sentiment is being heavily influenced by geopolitical risks, particularly the rising tensions in the Strait of Hormuz. According to recent news reports, Iran has threatened to retaliate against any attacks on its energy infrastructure, leading to a surge in oil prices. This has created a risk-off environment, with investors flocking to safe-haven assets like the US dollar and US Treasuries. The SP500 is also showing signs of weakness, currently trading at 6677.45, and the DowJones30 is at 46714.5, both reflecting the broader market unease. The 1-day chart for Nasdaq100 shows a bearish trend with 90% strength, suggesting that these pressures are likely to persist.
Multi-Timeframe Analysis: Confirmation Needed for Reversal
A multi-timeframe analysis reveals a mixed picture. While the 1-hour and 1-day charts show bearish trends, the 4-hour chart is more neutral. However, even on the 4-hour chart, the RSI(14) at 42.56 and MACD histogram confirm negative momentum. The ADX on the 4-hour chart is weak at 12.78, suggesting that the trend is not yet firmly established. This means that a break below the $24,390 support could trigger a more significant sell-off. Traders should watch for confirmation from other indicators, such as a break below the lower Bollinger Band or a sustained move below the 200-day moving average.
The Trader's Playbook: Watching for the Break
Given the current technical and fundamental backdrop, a cautious approach is warranted. The ADX at 12.78 indicates a choppy market, making aggressive trading strategies risky. The RSI and MACD histogram are aligned, providing a clear directional signal, but the Stochastic oscillator is in a tradeable zone, not yet at extreme oversold levels. Therefore, the key is to watch for a confirmed break below the $24,390 support. A daily close below this level would open the door for a test of the next support levels at $24,235.4 and $23,975.09. Manage your risk, wait for your setup- the market always gives a second chance.
Key Levels to Watch
For short-term traders, the immediate resistance level is $24,541.58. A break above this level could lead to a test of $24,586.62 and $24,666.7. However, given the overall bearish sentiment, these rallies are likely to be short-lived. Longer-term investors should focus on the key support levels at $24,390, $24,235.4, and $23,975.09. A break below these levels could signal a more significant correction in the Nasdaq100.
Risk Management: Protecting Your Capital
In the current volatile market environment, risk management is paramount. Traders should use stop-loss orders to protect their capital and avoid overleveraging their positions. It is also important to diversify your portfolio and avoid putting all your eggs in one basket. The current geopolitical risks and economic uncertainties make it essential to be prepared for unexpected market moves. Consider using options strategies to hedge your positions and limit your downside risk.
Key Levels
Support Levels
Resistance Levels
Technical Outlook Summary
| Indicator | Value | Signal |
|---|---|---|
| RSI (14) | 43.08 | Neutral |
| MACD Histogram | Negative | Bearish |
| Stochastic | 39.88/39.53 | Buy |
| ADX | 38.15 | Strong Down Trend |
| Bollinger | Middle Band | Below |
Frequently Asked Questions: Nasdaq100 Analysis
What happens if Nasdaq100 breaks below $24,390 support?
If Nasdaq100 breaks below the $24,390 support level, the next targets are $24,235.4 and $23,975.09, potentially signaling a deeper correction. This bearish scenario is supported by the strong downward trend indicated by the ADX at 38.15 on the 1-hour chart.
Should I buy Nasdaq100 at current levels of $24,541.63 given the DXY at 99.88?
Given the current levels of $24,541.63 for Nasdaq100 and the DXY at 99.88, it's prudent to be cautious. The inverse correlation suggests that further DXY strength could pressure Nasdaq100, making a long entry risky unless the $24,390 support holds.
Is RSI at 43.08 a sell signal for Nasdaq100 right now?
An RSI of 43.08 for Nasdaq100 is not an outright sell signal, as it's in neutral territory. However, combined with the MACD histogram showing negative momentum and the strong downtrend indicated by the ADX, it suggests that bearish pressure is building, warranting caution.
How will tensions in the Strait of Hormuz affect Nasdaq100 this week?
Tensions in the Strait of Hormuz are likely to create a risk-off environment, potentially weighing on Nasdaq100 as investors seek safe-haven assets. Rising oil prices due to these tensions could also lead to inflationary pressures, prompting a hawkish stance from the Federal Reserve, further supporting the dollar and pressuring equities.
Track markets in real-time
AI-powered analysis, technical indicators and real-time price data.
Join Our Telegram Channel
Breaking market news, AI analysis and trading signals instantly.
Join Channel