WTI Eyes $100 as Hormuz Threat Fuels Bullish Run to $95.53
WTI crude oil is nearing $100, currently trading at $95.53, as escalating tensions around the Strait of Hormuz threaten global supply. Will this bullish momentum continue?
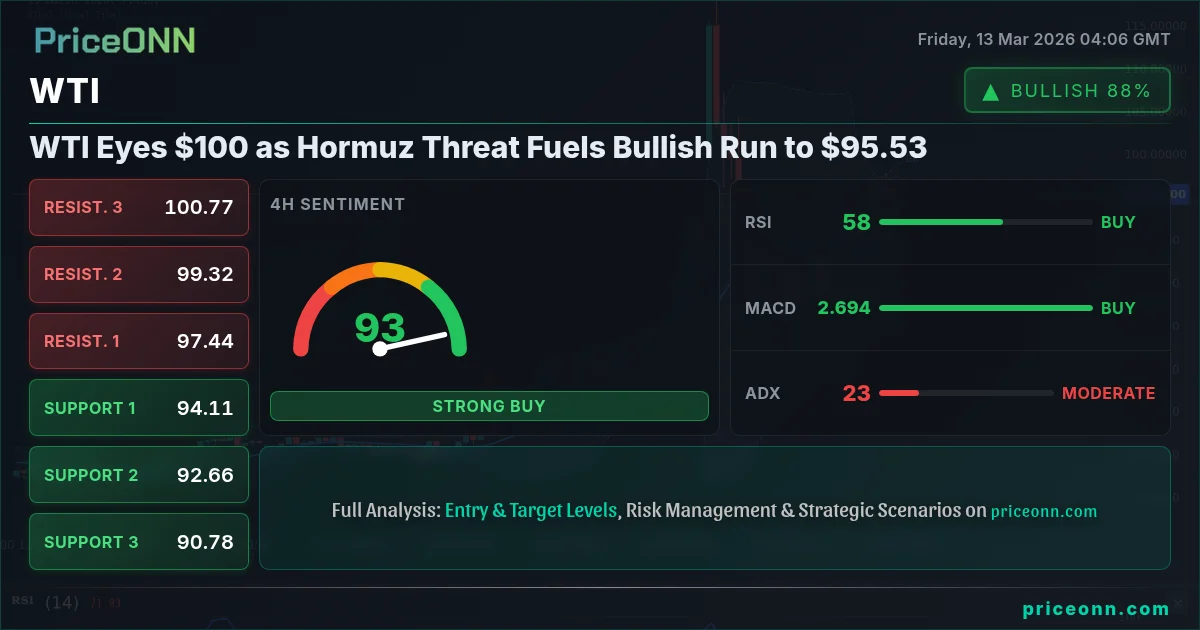
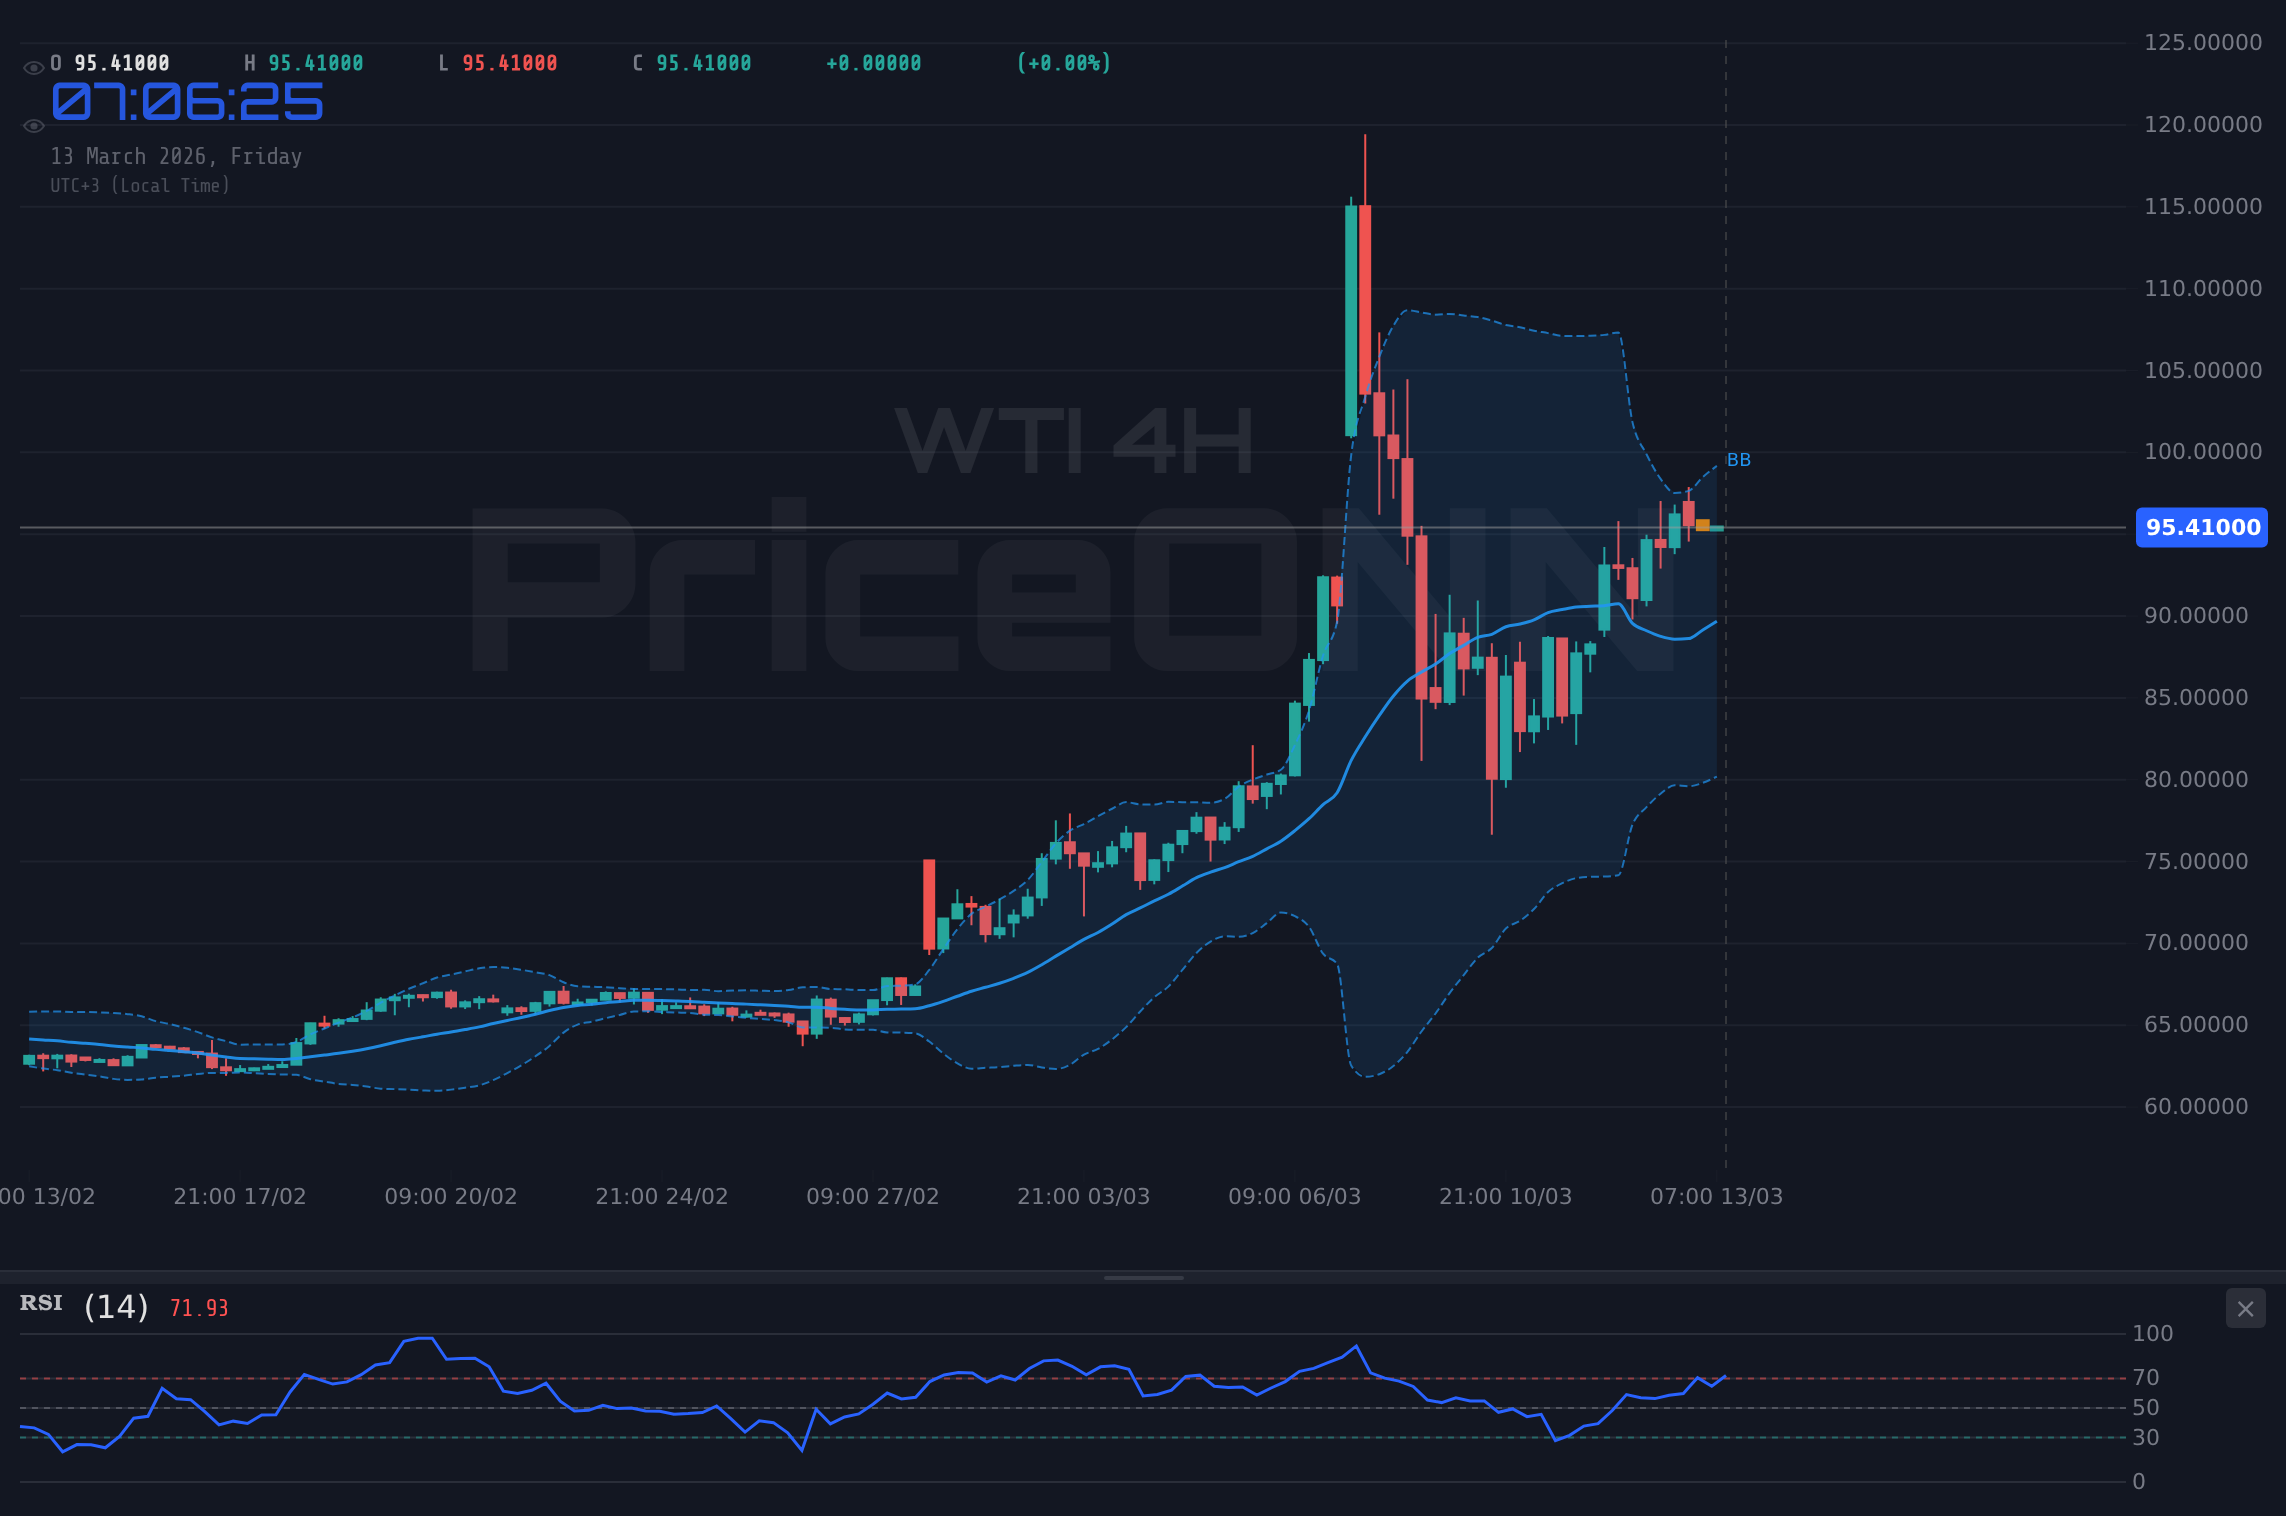
Oil markets are on edge as WTI crude oil approaches the psychologically significant $100 mark, currently trading at $95.53. This bullish surge is primarily driven by escalating geopolitical tensions in the Middle East, specifically renewed threats from Iran regarding the Strait of Hormuz. While technical indicators present a mixed picture, the fundamental backdrop suggests further upside potential if tensions persist.
- WTI crude oil is trading near $95.53 amid escalating tensions in the Middle East.
- Strong uptrend with ADX at 49.84 suggests the bullish momentum may continue.
- A break above the $97.42 resistance level could target $98.63 and $100.45.
- Geopolitical risks and supply concerns are key drivers for the current price action.
Hormuz Threat: A Geopolitical Tinderbox
The Strait of Hormuz, a critical chokepoint for global oil supplies, has once again become a focal point of concern. Recent reports indicate heightened tensions in the region, with Iran issuing veiled threats regarding potential disruptions to shipping lanes. According to a Reuters report, the new leadership is considering several options, including increased naval presence and potential restrictions on tanker traffic. This geopolitical uncertainty is injecting a significant risk premium into oil prices, as any disruption to Hormuz could trigger a substantial supply shock.
The market is reacting swiftly to these developments. As reported by Bloomberg, several major shipping companies are already diverting vessels away from the region, opting for longer and more expensive routes. This increased cost of transportation further exacerbates the supply concerns, pushing prices higher. The correlation between geopolitical risk and oil prices is undeniable, and the current situation underscores the vulnerability of global energy markets to regional instability.
Technical Picture: Mixed Signals, Bullish Bias
A glance at the technical charts reveals a complex landscape. On the 1-hour timeframe, WTI exhibits a neutral trend, with the RSI hovering in the neutral zone at 58.21. However, the ADX at 22.36 indicates a moderate uptrend. This divergence suggests a potential for further upside, but with caution. The immediate resistance lies at $96.55, a level that bulls need to overcome to sustain the upward momentum.
Stepping back to the 4-hour chart, the bullish bias strengthens. The ADX rises to 22.81, signaling a moderate uptrend. The RSI mirrors the 1-hour chart, sitting at 58.4. A decisive break above the $97.42 resistance level could pave the way for a test of $98.63 and potentially $100.45. However, failure to breach this resistance could lead to a pullback towards the $94.39 support level.
The daily chart paints a more compelling bullish picture. The ADX is soaring to 49.84, indicating a strong uptrend. However, with the RSI deeply in overbought territory at 79.89, a correction is possible. Key resistance lies at $99.25. A successful breach of this level could open the door for a test of $102.30. Conversely, the $90.94 support level becomes crucial in the event of a reversal.
Dollar Strength and its Impact
The strength of the US dollar, as measured by the DXY, plays a crucial role in the dynamics of WTI. Currently, the DXY is trading at 99.54, reflecting a strong uptrend across all timeframes. This dollar strength tends to exert downward pressure on commodity prices, including oil. However, the geopolitical risk premium and supply concerns surrounding the Strait of Hormuz are currently outweighing the negative impact of a strong dollar. As long as these tensions persist, WTI may continue its upward trajectory, defying the conventional correlation with the DXY.
Economic Calendar: Watch for Inflation Clues
Several key economic data releases loom on the horizon, which could significantly impact oil prices. The market will closely monitor the upcoming inflation data, as higher-than-expected inflation figures could prompt the Federal Reserve to adopt a more hawkish stance. According to the economic calendar, several USD related events are scheduled. These data points could trigger volatility across financial markets, including oil. Traders should remain vigilant and prepare for potential price swings.
Trade Plan: Riding the Bullish Wave
Given the prevailing geopolitical tensions and the bullish technical signals, a long position on WTI appears to be a reasonable strategy. However, prudent risk management is essential. Here's a potential trade plan:
Enter long if WTI breaks above $97.42 resistance, targeting $98.63 and $100.45 resistance levels. Continuation is expected if tensions around the Strait of Hormuz escalate.
Enter short if WTI closes below $94.39, targeting $92.57 and $91.36. This scenario becomes more probable if geopolitical tensions ease or if the DXY strengthens significantly.
Remember, this trade plan is contingent on the continued escalation of geopolitical tensions. Any de-escalation could trigger a sharp reversal in oil prices. Always manage your risk and use appropriate stop-loss orders.
A Word of Caution
The oil market is highly volatile and susceptible to unexpected events. Geopolitical risks, supply disruptions, and economic data releases can all trigger significant price swings. Always conduct thorough research and manage your risk accordingly.
The Big Picture
WTI's current surge is a microcosm of the broader geopolitical and economic forces shaping global markets. The interplay between geopolitical risk, supply concerns, and the strength of the US dollar creates a complex and dynamic environment. While the technical picture suggests further upside potential, traders must remain vigilant and adapt to the ever-changing landscape.
Frequently Asked Questions: WTI Analysis
What happens if WTI breaks above $97.42 resistance?
If WTI breaks above the $97.42 resistance, as indicated on the 4H chart, it could pave the way for a test of $98.63 and potentially $100.45. This scenario is contingent on continued tensions around the Strait of Hormuz and sustained bullish momentum.
Should I buy WTI at current levels of $95.53 given RSI at 79.89?
While the RSI at 79.89 on the daily chart indicates overbought conditions, suggesting a potential pullback, the strong uptrend as indicated by the ADX at 49.84 suggests that the bullish momentum could continue. A cautious approach would be to wait for a pullback before entering a long position.
How will the upcoming inflation data affect WTI this week?
Higher-than-expected inflation data could prompt the Federal Reserve to adopt a more hawkish stance, potentially strengthening the US dollar and exerting downward pressure on WTI. Conversely, weaker-than-expected inflation data could weaken the dollar and support higher oil prices.
Is the current WTI surge sustainable given the DXY at 99.54?
The DXY at 99.54 reflects a strong US dollar, which typically exerts downward pressure on commodity prices like WTI. However, the geopolitical risk premium and supply concerns surrounding the Strait of Hormuz are currently outweighing the negative impact of a strong dollar, potentially sustaining WTI's surge.
Having tracked WTI through numerous geopolitical events, this situation reminds me of the 2008 crisis, when prices spiked on supply fears. However, as the current situation unfolds, it will be critical to monitor not only the immediate tensions but also the broader global economic context.
Track markets in real-time
AI-powered analysis, technical indicators and real-time price data.
Join Our Telegram Channel
Breaking market news, AI analysis and trading signals instantly.
Join Channel