I'm watching gold closely this week. It's been flirting with the $5,200 level, but that dollar strength is proving to be a real headwind. Can the bulls overcome it?
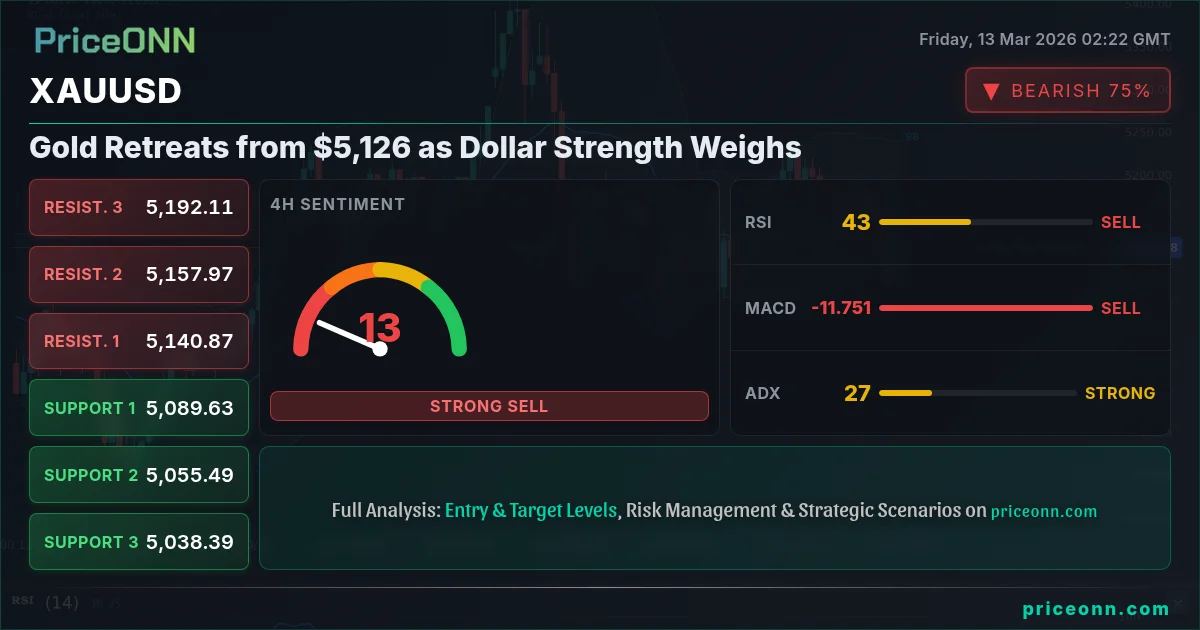
- RSI at 45.37 on the 1H chart suggests further downside potential in the near term.
- Key support level to watch is at $5,102.04, a break below could trigger further selling.
- MACD shows negative momentum on the 4H timeframe, indicating bearish pressure.
- The DXY's strength is currently the primary driver of XAUUSD's negative correlation.
Gold's recent pullback from the $5,126 level is no surprise given the broader market context. With the Dollar Index (DXY) currently trading at 99.46 and showing a strong upward trend on the 1H and 4H timeframes, gold is facing significant headwinds. As someone who has followed gold for decades, I've seen this inverse correlation play out time and again. The stronger the dollar, the weaker gold tends to be.
The key to understanding gold's price action lies in deciphering the interplay of several factors. The strength of the U.S. dollar, as indicated by the DXY, is a primary driver. The SP500 and Nasdaq indexes, serving as barometers of risk appetite, also play a crucial role. And, of course, geopolitical tensions remain a wildcard that can quickly shift market sentiment.
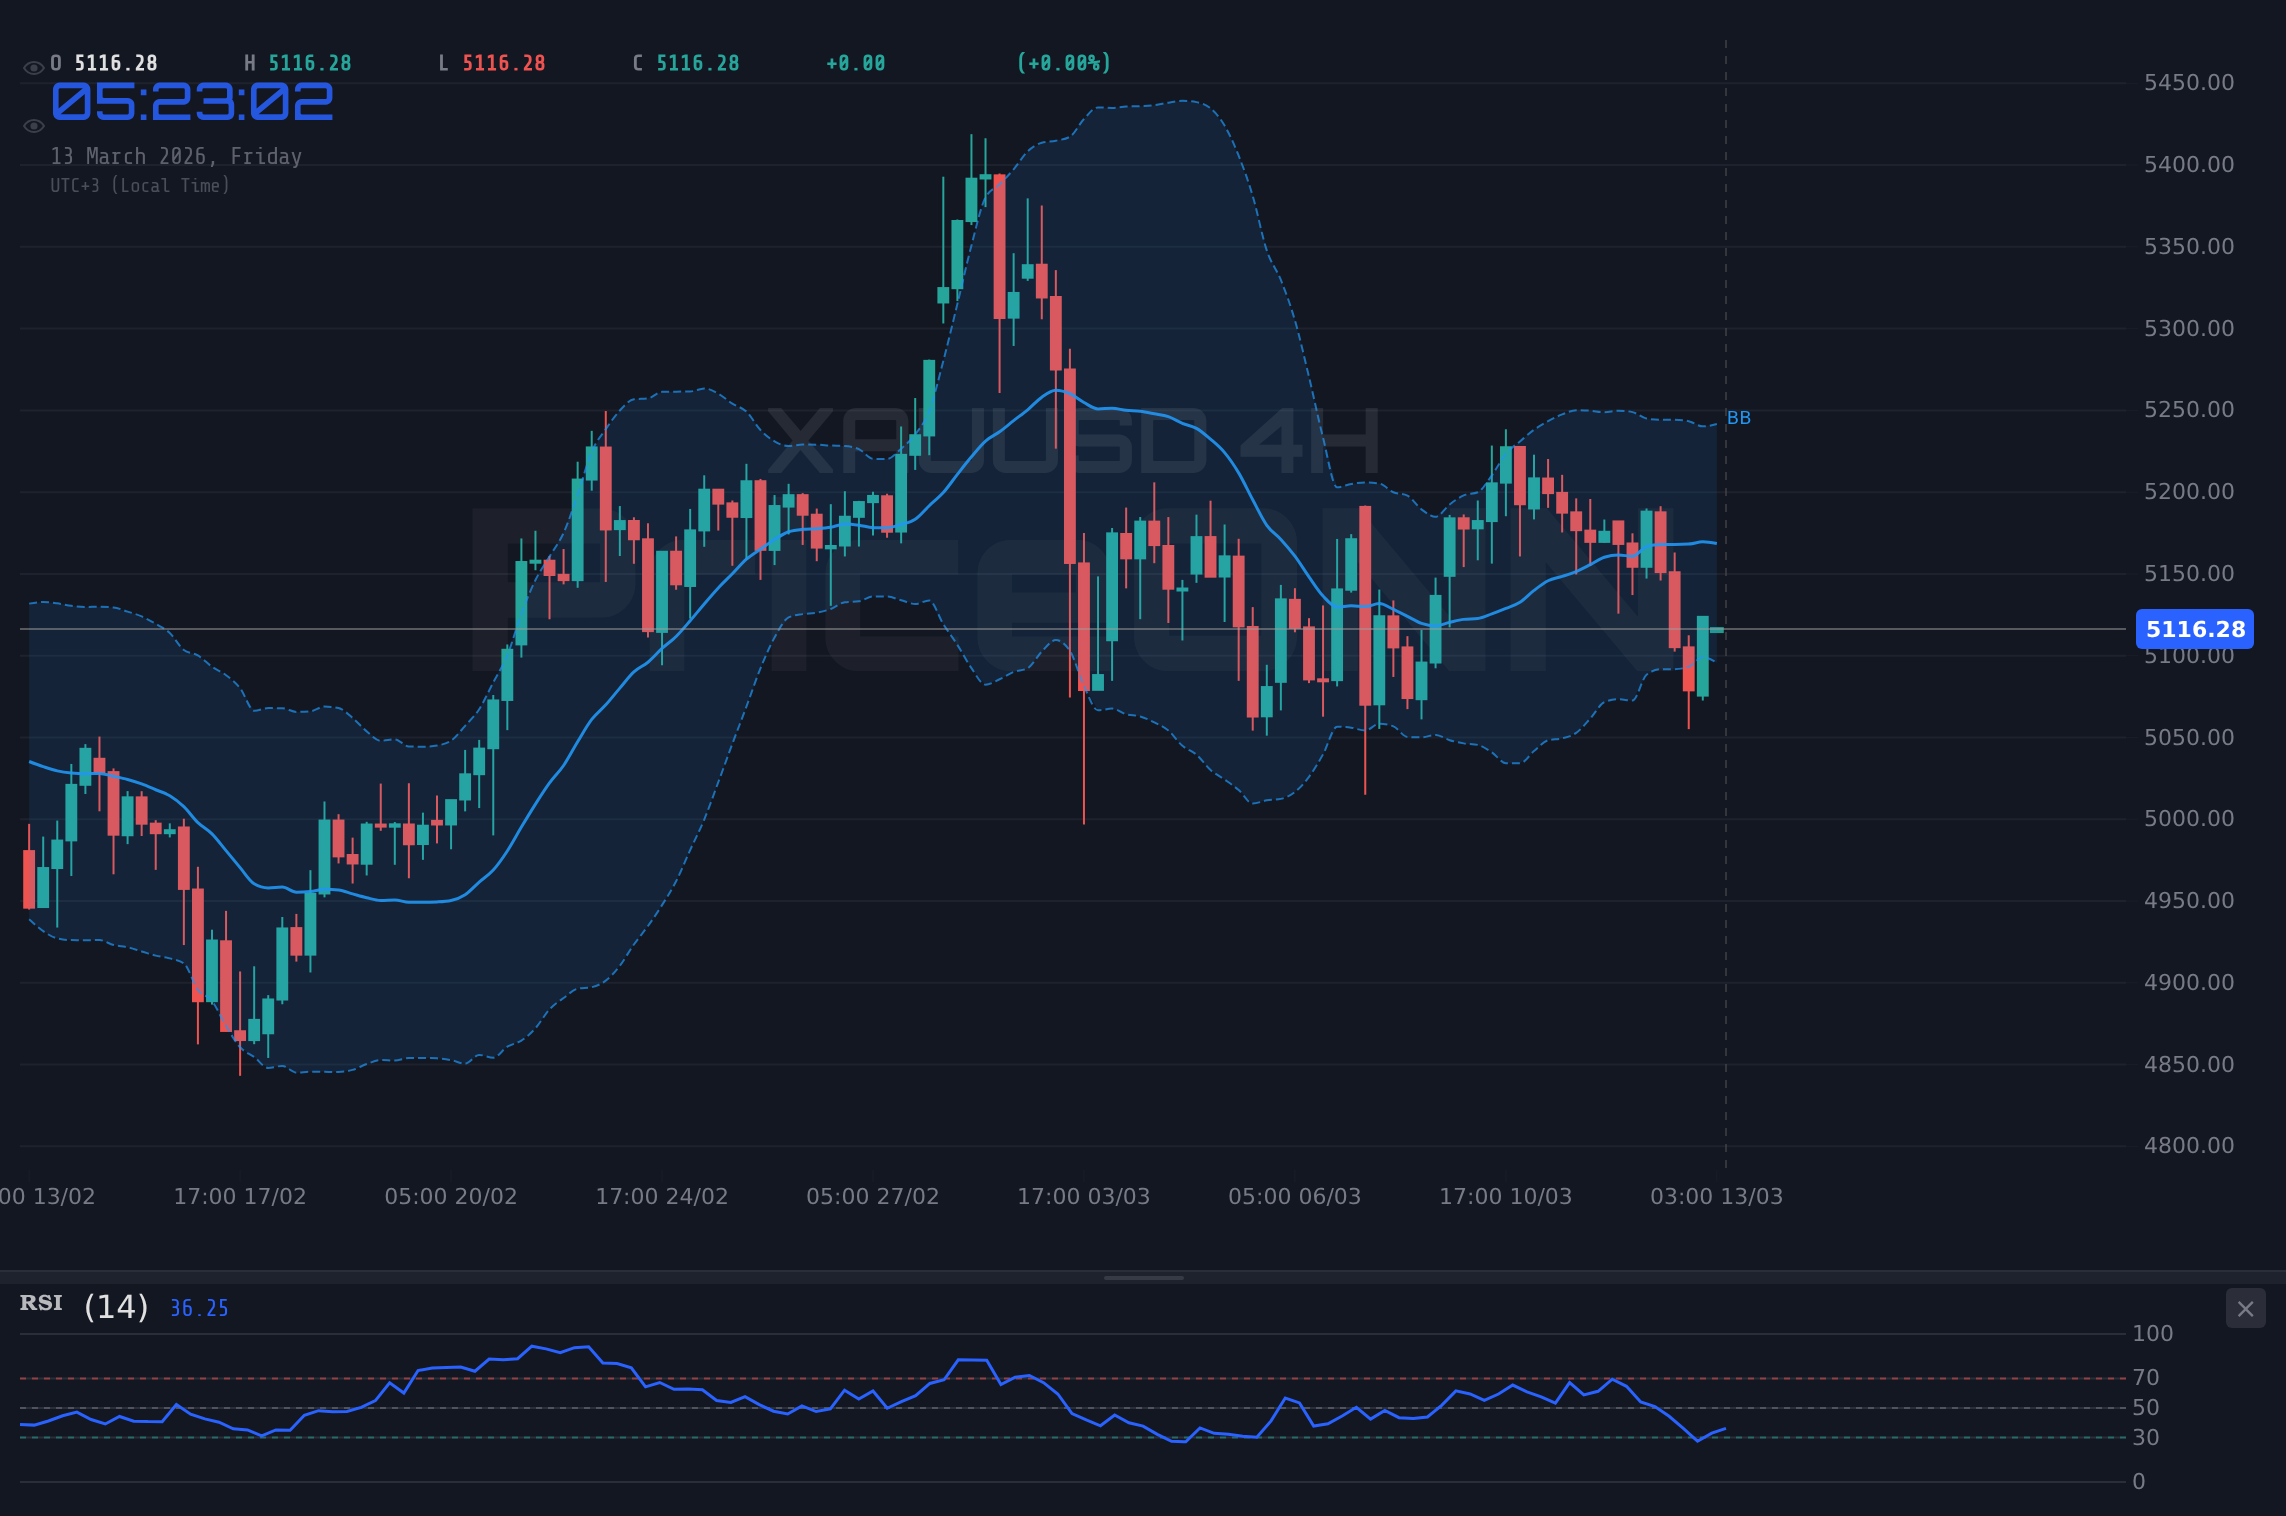
From a technical standpoint, the 1H chart for XAUUSD shows a neutral trend, but with an ADX of 40.44, we're seeing a strong bearish trend. The RSI at 45.37 is sitting in neutral territory, but trending down. This tells me that the bears are pressing, but the bulls aren't quite ready to throw in the towel. The Stochastic indicator, with K=62.07 and D=27.92, is flashing a bullish signal, suggesting a potential short-term bounce. Now this is where it gets interesting! The indicators are giving us conflicting signals, which means it's time to dig deeper.
Looking at the 4H timeframe, the picture becomes a bit clearer. The trend is still neutral, but the ADX remains strong at 26.43, confirming the bearish momentum. The RSI at 45.44 is also trending down, aligning with the MACD, which shows negative momentum below the signal line. This suggests that the bears have the upper hand for now. However, the Stochastic indicator is in oversold territory, with K=22.39 and D=30.64, indicating that a potential reversal could be on the horizon.
On the daily chart, the trend is also neutral, but the ADX is weak at 11.96. The RSI at 52.37 is in neutral territory, but trending up. The MACD is showing negative momentum below the signal line, while the Stochastic indicator is giving a bullish signal. What does all this mean? It means that gold is currently range-bound, with no clear directional bias. Patience looks like it will be rewarded here.
So, what should traders be watching for? First and foremost, keep a close eye on the DXY. If the dollar continues to strengthen, gold will likely face further downside pressure. Also, watch the SP500 and Nasdaq. If risk appetite declines, safe-haven demand for gold could increase. And, of course, stay informed about any geopolitical developments that could impact market sentiment.
From a technical perspective, the key level to watch is the support at $5,102.04 on the 1H chart. If price breaks below this level, we could see a move down to the next support at $5,090.73. On the upside, the resistance is at $5,119.86. A break above this level could signal a potential reversal. It is important to note that the 1D RSI sits at 52.37, while the Stochastic Oscillator shows 39.51/35.41, signaling a potential change in momentum.
The recent news cycle has been dominated by concerns over geopolitical tensions and their impact on energy markets. According to Reuters, the conflict in the Middle East is causing significant supply disruptions, which is driving up oil prices. This is creating a complex situation for gold, as rising oil prices can fuel inflation fears, which typically support gold. However, the stronger dollar is offsetting this effect, creating a tug-of-war between bullish and bearish forces.
Looking at the economic calendar, the upcoming GBP data on Friday will be closely watched. Any surprise could impact the broader market sentiment. The dollar index eyes 100 as geopolitical risk fuels safe-haven demand
The current market environment is one of heightened uncertainty and volatility. As a result, it's crucial to manage your risk carefully and wait for your setup. The market always gives a second chance.
If XAUUSD breaks above the resistance level of $5,119.86 and holds, we could see a move towards the next resistance at $5,126.37. A sustained break above that could target $5,137.68. This scenario is contingent on a weakening dollar and increased risk appetite.
If XAUUSD fails to hold the support level of $5,102.04, we could see a move down towards the next support at $5,090.73. A break below that could target $5,084.22. This scenario is contingent on a strengthening dollar and declining risk appetite.
Key Levels
Support Levels
Resistance Levels
Frequently Asked Questions: XAUUSD Analysis
What happens if XAUUSD breaks above $5,119.86 resistance?
A break above the $5,119.86 resistance level could signal a potential reversal, with the next target at $5,126.37. Sustained momentum above that level could open the door for a move towards $5,137.68.
Should I buy at current $5,122.43 levels given RSI at 45.37?
With the RSI at 45.37 on the 1H chart, it's not yet in oversold territory, suggesting further downside potential. A more prudent approach would be to wait for a confirmed reversal signal before entering a long position.
Is RSI at 45.37 a sell signal for XAUUSD?
An RSI of 45.37, in and of itself, is not a definitive sell signal. However, combined with the negative momentum on the MACD and the strong bearish trend indicated by the ADX, it suggests that the bears are currently in control.
How will the upcoming GBP data affect XAUUSD this week?
The upcoming GBP data could impact broader market sentiment, which could indirectly affect XAUUSD. A strong GBP could weaken the DXY, providing some support for gold. However, the primary drivers for XAUUSD remain the dollar's strength and risk appetite.
Track markets in real-time
AI-powered analysis, technical indicators and real-time price data.
Join Our Telegram Channel
Breaking market news, AI analysis and trading signals instantly.
Join Channel