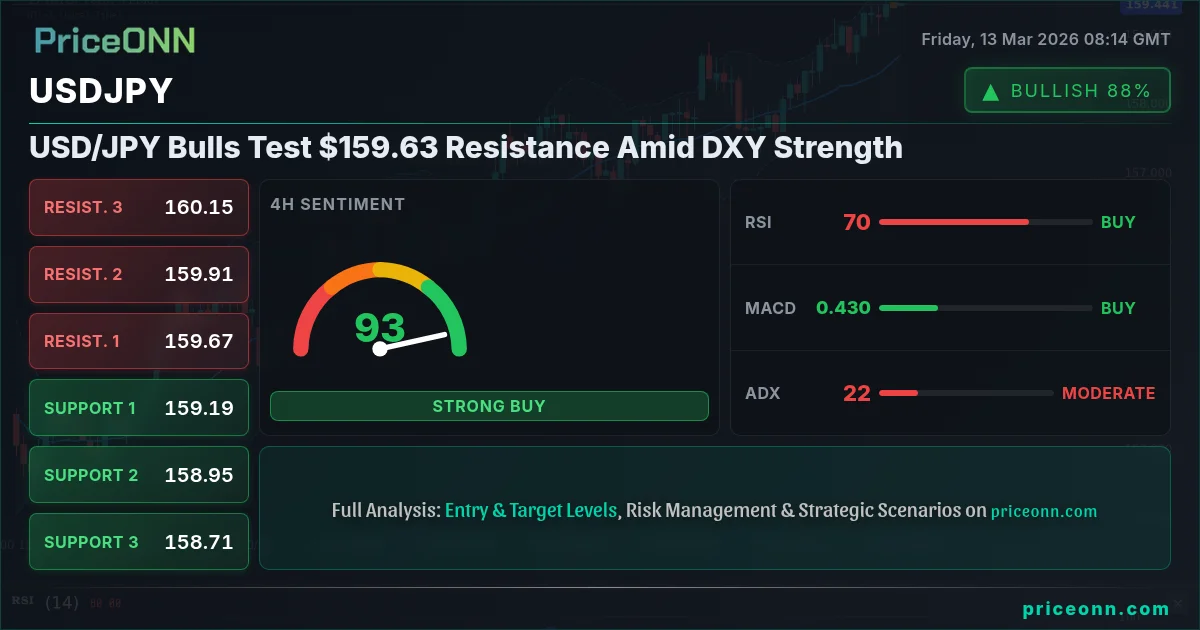
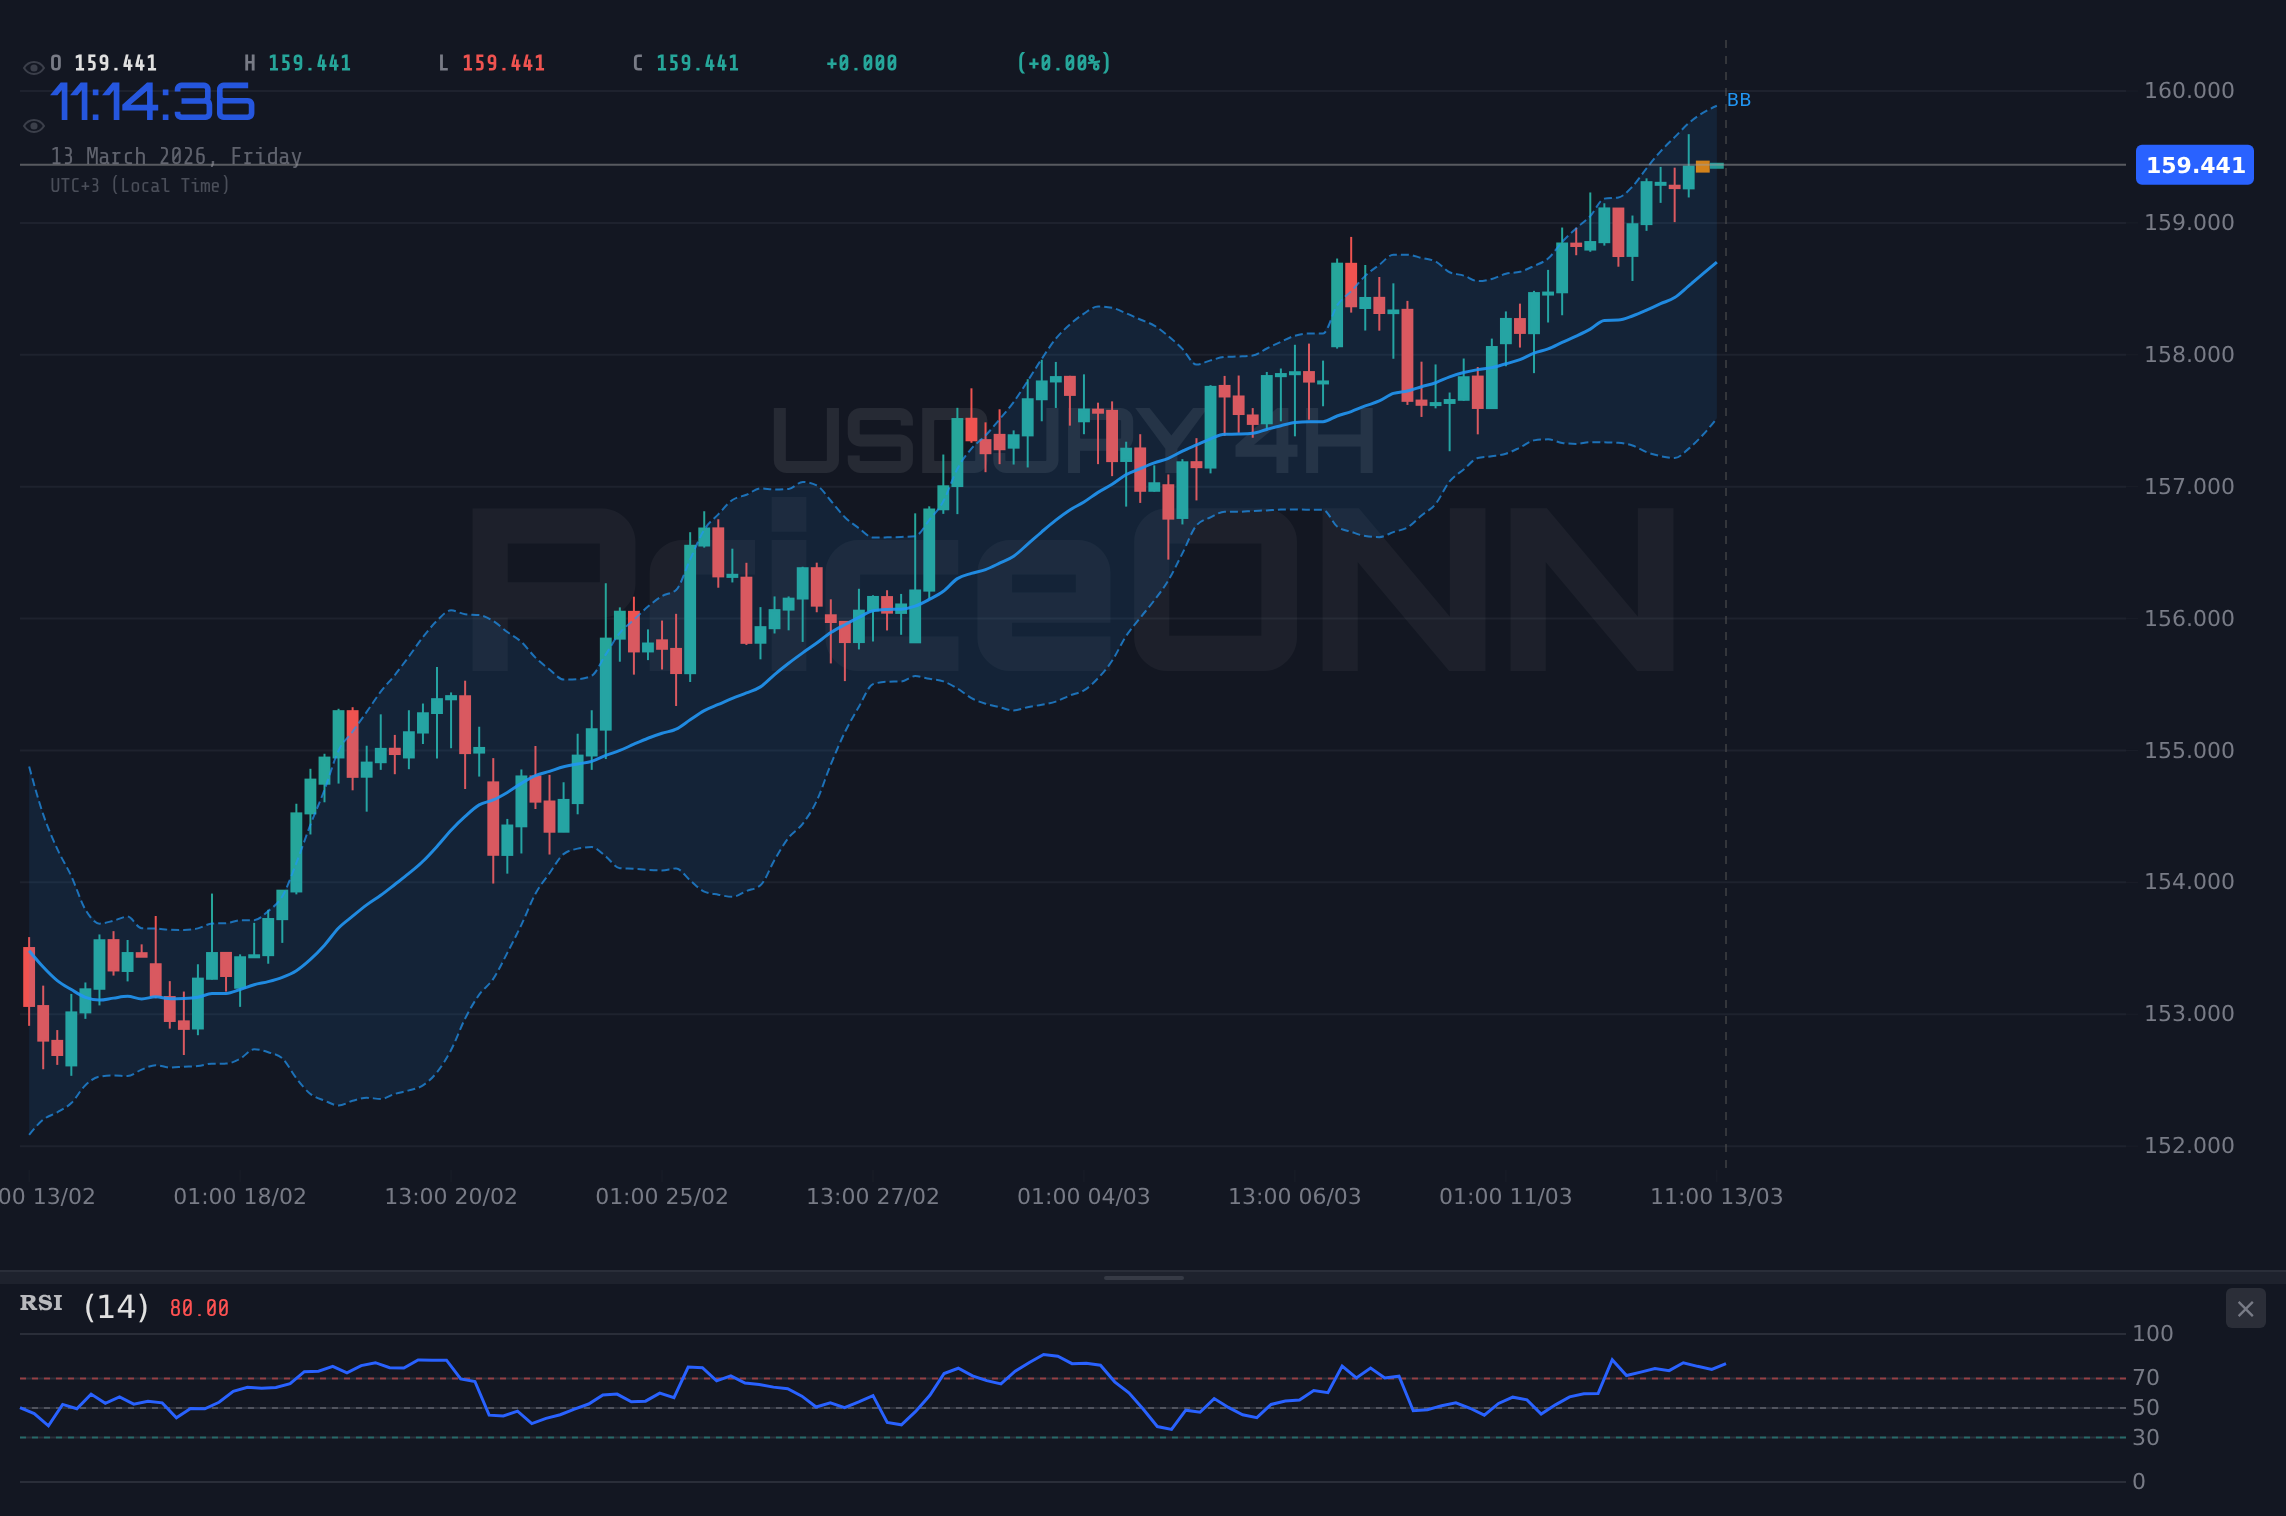
USD/JPY is currently navigating a critical juncture, trading at $159.38 while facing immediate resistance at $159.63. The strength of the U.S. Dollar Index (DXY), currently at 99.98 and showing a strong upward trend, is a significant factor influencing this pair. The escalating tensions in the Strait of Hormuz, as reported by recent energy sector news, are further contributing to market volatility, adding another layer of complexity to the technical picture.
The immediate question is: can the bulls overcome this resistance, or will the bears regain control, pushing the pair back down? To understand the potential scenarios, we need to analyze the technical indicators, the broader market context, and the upcoming economic events. The recent news of WTI crude oil soaring above $95 due to tensions in the Middle East further complicates the landscape, as it can influence risk sentiment and currency valuations.
The Bull's Roadmap: Targeting $160.50
For the bullish scenario to unfold, USD/JPY needs to convincingly break above the $159.63 resistance level. If this occurs, the next target would be $159.96, followed by a more ambitious target of $160.50. This scenario is supported by the 4H chart, where the RSI is at 68.57, indicating a potential for continued upward movement. The MACD histogram also shows positive momentum, further reinforcing the bullish outlook. However, the Stochastic oscillator is in overbought territory at K=83.05 and D=84.16, suggesting that a pullback might be imminent. Scalpers might look for opportunities to enter long positions on pullbacks towards the $159.33 support level, while swing traders may wait for a confirmed breakout above $159.63 before adding to their positions. Long-term investors might see this as an opportunity to accumulate USD/JPY at current levels, anticipating further appreciation due to the ongoing strength of the U.S. economy and the potential for further interest rate hikes by the Federal Reserve.
Historically, USD/JPY has shown a tendency to rally strongly when the DXY is strong and risk appetite is high. The current situation aligns with this historical pattern, as the DXY is trading near its recent highs and global equity markets have been relatively resilient. However, it's important to note that the Bank of Japan (BoJ) could intervene in the currency market to stem the rapid depreciation of the Yen, which could put a lid on the rally. The upcoming economic data releases, particularly the U.S. inflation data, will be crucial in determining the direction of USD/JPY. If the inflation data comes in stronger than expected, it could further boost the DXY and propel USD/JPY higher. Conversely, if the inflation data is weaker than expected, it could trigger a pullback in the DXY and a corresponding decline in USD/JPY.
Where Bears Take Control: Below $159.19
The bearish scenario would come into play if USD/JPY fails to break above $159.63 and instead breaks below the immediate support level at $159.33. A sustained move below this level could trigger a deeper correction towards the next support level at $159.19. If this support also fails to hold, the bears could target the $158.76 level as the next significant downside target. On the 1H chart, the ADX is relatively weak at 18.67, suggesting that the current uptrend is not particularly strong and could be vulnerable to a reversal. The Stochastic oscillator also supports this view, as it is signaling a potential for a pullback. Scalpers might look for opportunities to enter short positions on rallies towards the $159.48 resistance level, while swing traders may wait for a confirmed breakdown below $159.33 before initiating short positions. Long-term investors might see this as an opportunity to reduce their exposure to USD/JPY, anticipating a potential period of Yen strength due to a shift in BoJ policy or a decline in global risk appetite.
Historically, USD/JPY has been sensitive to changes in risk sentiment. During periods of heightened risk aversion, investors tend to flock to the safe-haven Yen, putting downward pressure on USD/JPY. The recent escalation of tensions in the Middle East could trigger a flight to safety, which would benefit the Yen and weigh on USD/JPY. However, it's important to note that the BoJ's ultra-loose monetary policy is a significant headwind for the Yen, which could limit the extent of any downside correction in USD/JPY. The upcoming economic data releases, particularly the U.S. employment data, will be crucial in determining the direction of USD/JPY. If the employment data comes in weaker than expected, it could trigger a flight to safety and a corresponding decline in USD/JPY. Conversely, if the employment data is stronger than expected, it could boost risk appetite and propel USD/JPY higher.
The Waiting Game: Stuck Between $159.19 and $159.63
A third scenario is a range-bound consolidation between the $159.19 support and the $159.63 resistance. This could occur if the market is waiting for a catalyst, such as a major economic data release or a significant geopolitical event, to provide a clear direction. In this scenario, USD/JPY could fluctuate within this range, with neither the bulls nor the bears able to gain a decisive advantage. The 1H chart shows a neutral trend, with the RSI hovering around 60.01, indicating a lack of strong momentum in either direction. The ADX is also weak, suggesting that the market is in a consolidation phase. Scalpers might look for opportunities to trade the range, buying near the support level and selling near the resistance level. Swing traders may remain on the sidelines, waiting for a confirmed breakout or breakdown before taking a position. Long-term investors might use this period of consolidation to reassess their outlook for USD/JPY, taking into account the evolving macroeconomic and geopolitical landscape.
The recent comments from Fed officials, as reported by Reuters, highlighting that inflation remains 'stubborn,' could reinforce the dollar's strength, keeping USD/JPY elevated. However, the potential for intervention by the Bank of Japan remains a wildcard. A surprise move from the BoJ could quickly invalidate the bullish thesis and trigger a sharp decline in USD/JPY.
The Most Likely Scenario and Why
Considering the current technical picture and the prevailing market sentiment, the most likely scenario is a bullish breakout above $159.63 (60% probability). The strength of the DXY, the positive momentum on the 4H chart, and the overall risk-on environment suggest that USD/JPY is likely to continue its upward trajectory. However, the overbought conditions on the Stochastic oscillator and the potential for BoJ intervention warrant caution. A close above $159.63 on the 4H chart would provide further confirmation of the bullish breakout. A break below $159.19 would invalidate the bullish thesis and increase the probability of a bearish correction.
This analysis takes into account a multi-timeframe approach, considering the 1H, 4H, and 1D charts. The 1H chart provides insights into the short-term price action, while the 4H and 1D charts offer a broader perspective on the overall trend. The analysis also incorporates various technical indicators, including the RSI, MACD, Stochastic oscillator, and ADX, to provide a comprehensive assessment of the market conditions. It also considers the broader market context, including the movements of the DXY, equity markets, and commodity prices, to identify potential correlations and influences. The recent news of AUD/USD defending key support levels adds another layer of complexity, as it suggests that the broader dollar strength may not be uniform across all currency pairs.
Key Triggers to Watch This Week
Several key triggers could influence the direction of USD/JPY this week. Firstly, the upcoming U.S. inflation data will be closely watched by the market. A stronger-than-expected inflation print could further boost the DXY and propel USD/JPY higher. Conversely, a weaker-than-expected inflation print could trigger a pullback in the DXY and a corresponding decline in USD/JPY. Secondly, any comments or actions from the BoJ regarding potential intervention in the currency market could have a significant impact on USD/JPY. A surprise move from the BoJ could quickly invalidate the bullish thesis and trigger a sharp decline in USD/JPY. Thirdly, the ongoing tensions in the Middle East could continue to influence risk sentiment and currency valuations. An escalation of the conflict could trigger a flight to safety, which would benefit the Yen and weigh on USD/JPY.
Technical Outlook Summary
| Indicator | Value | Signal |
|---|---|---|
| RSI (14) | 60.01 | Neutral |
| MACD Histogram | Negative | Bearish |
| Stochastic | 60.59 | Bearish |
| ADX | 18.67 | Weak Trend |
| Bollinger | Mid Band | Bullish |
Key Levels
Support Levels
Resistance Levels
IF USDJPY breaks above $159.63, THEN target $159.96 and $160.50. This scenario holds if the DXY continues its upward trend and risk appetite remains elevated. Time horizon: This week.
IF USDJPY closes below $159.33, THEN target $159.19 and $158.76. This scenario unfolds if risk aversion increases due to geopolitical tensions or weaker-than-expected U.S. economic data. Time horizon: This week.
Frequently Asked Questions: USDJPY Analysis
What happens if USDJPY breaks above $159.63 resistance?
If USDJPY decisively breaks above the $159.63 resistance level, we can expect further upside towards $159.96 and potentially $160.50. This breakout would likely be fueled by continued dollar strength, as indicated by the rising DXY at 99.98.
Should I buy USDJPY at current levels of $159.38 given the RSI at 60.01?
While the RSI at 60.01 on the 1H chart suggests potential for further upside, it's prudent to wait for a confirmed breakout above $159.63 before initiating a long position. A stop-loss order should be placed below $159.33 to manage the risk.
Is a Stochastic reading of 60.59 a sell signal for USDJPY right now?
The Stochastic oscillator at 60.59 does not necessarily indicate a sell signal on its own. It suggests that the pair is not yet overbought. However, it warrants caution and close monitoring of price action near the $159.63 resistance level.
How will the upcoming U.S. inflation data affect USDJPY this week?
Stronger-than-expected U.S. inflation data would likely boost the DXY and propel USDJPY higher, potentially targeting $159.96. Conversely, weaker-than-expected inflation data could trigger a pullback in the DXY and a corresponding decline in USDJPY towards $159.19.
Track markets in real-time
AI-powered analysis, technical indicators and real-time price data.
Join Our Telegram Channel
Breaking market news, AI analysis and trading signals instantly.
Join Channel