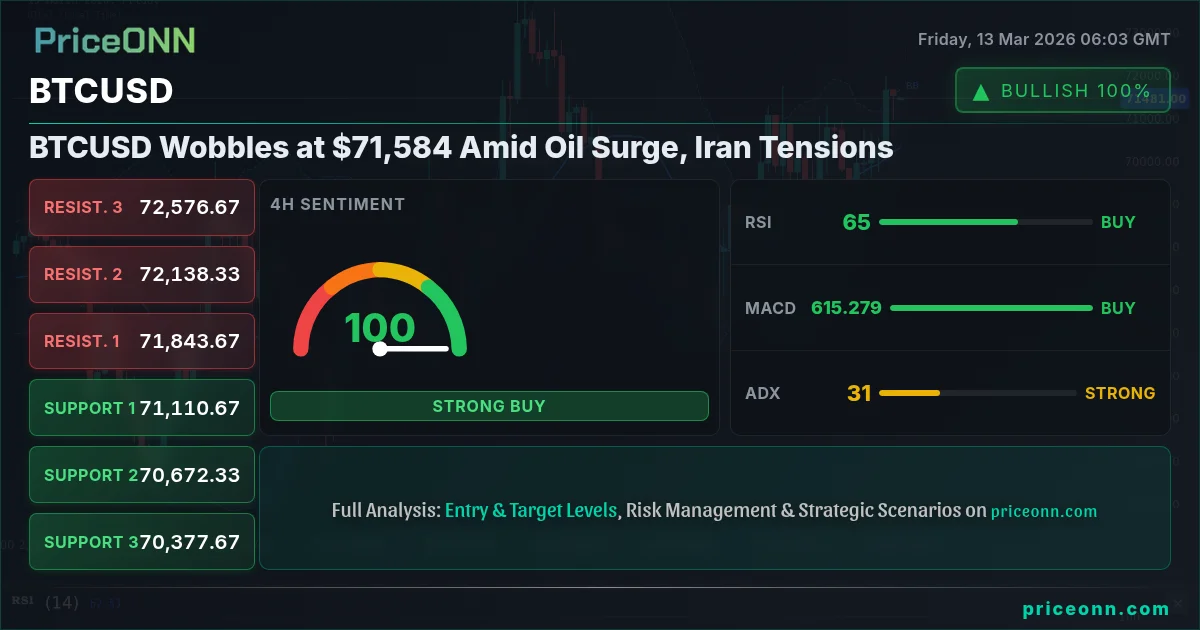
BTCUSD Wobbles at $71,584 Amid Oil Surge, Iran Tensions
BTCUSD hovers around $71,584 as rising oil prices and Middle East tensions fuel market uncertainty. Will Bitcoin hold its ground?
Is $71,584 the new normal for BTCUSD, or just a temporary plateau before the next leg up or down? Today's analysis reveals a tug-of-war between bullish momentum and emerging bearish pressures, set against a backdrop of soaring oil prices and escalating geopolitical tensions in the Middle East. The technical picture is nuanced, demanding a careful balancing act from traders.
- RSI at 63.24 on the 1H chart suggests limited immediate upside, while the 4H ADX at 30.29 confirms a strong uptrend.
- Key support level to watch is $71,261.67; a break below could trigger a deeper correction.
- MACD histogram shows positive momentum on the hourly, but a potential convergence looms, signaling waning bullish conviction.
- Geopolitical risks, particularly rising oil prices due to Iran tensions, are injecting inflationary pressures into the market, impacting Bitcoin's risk-on/risk-off dynamics.
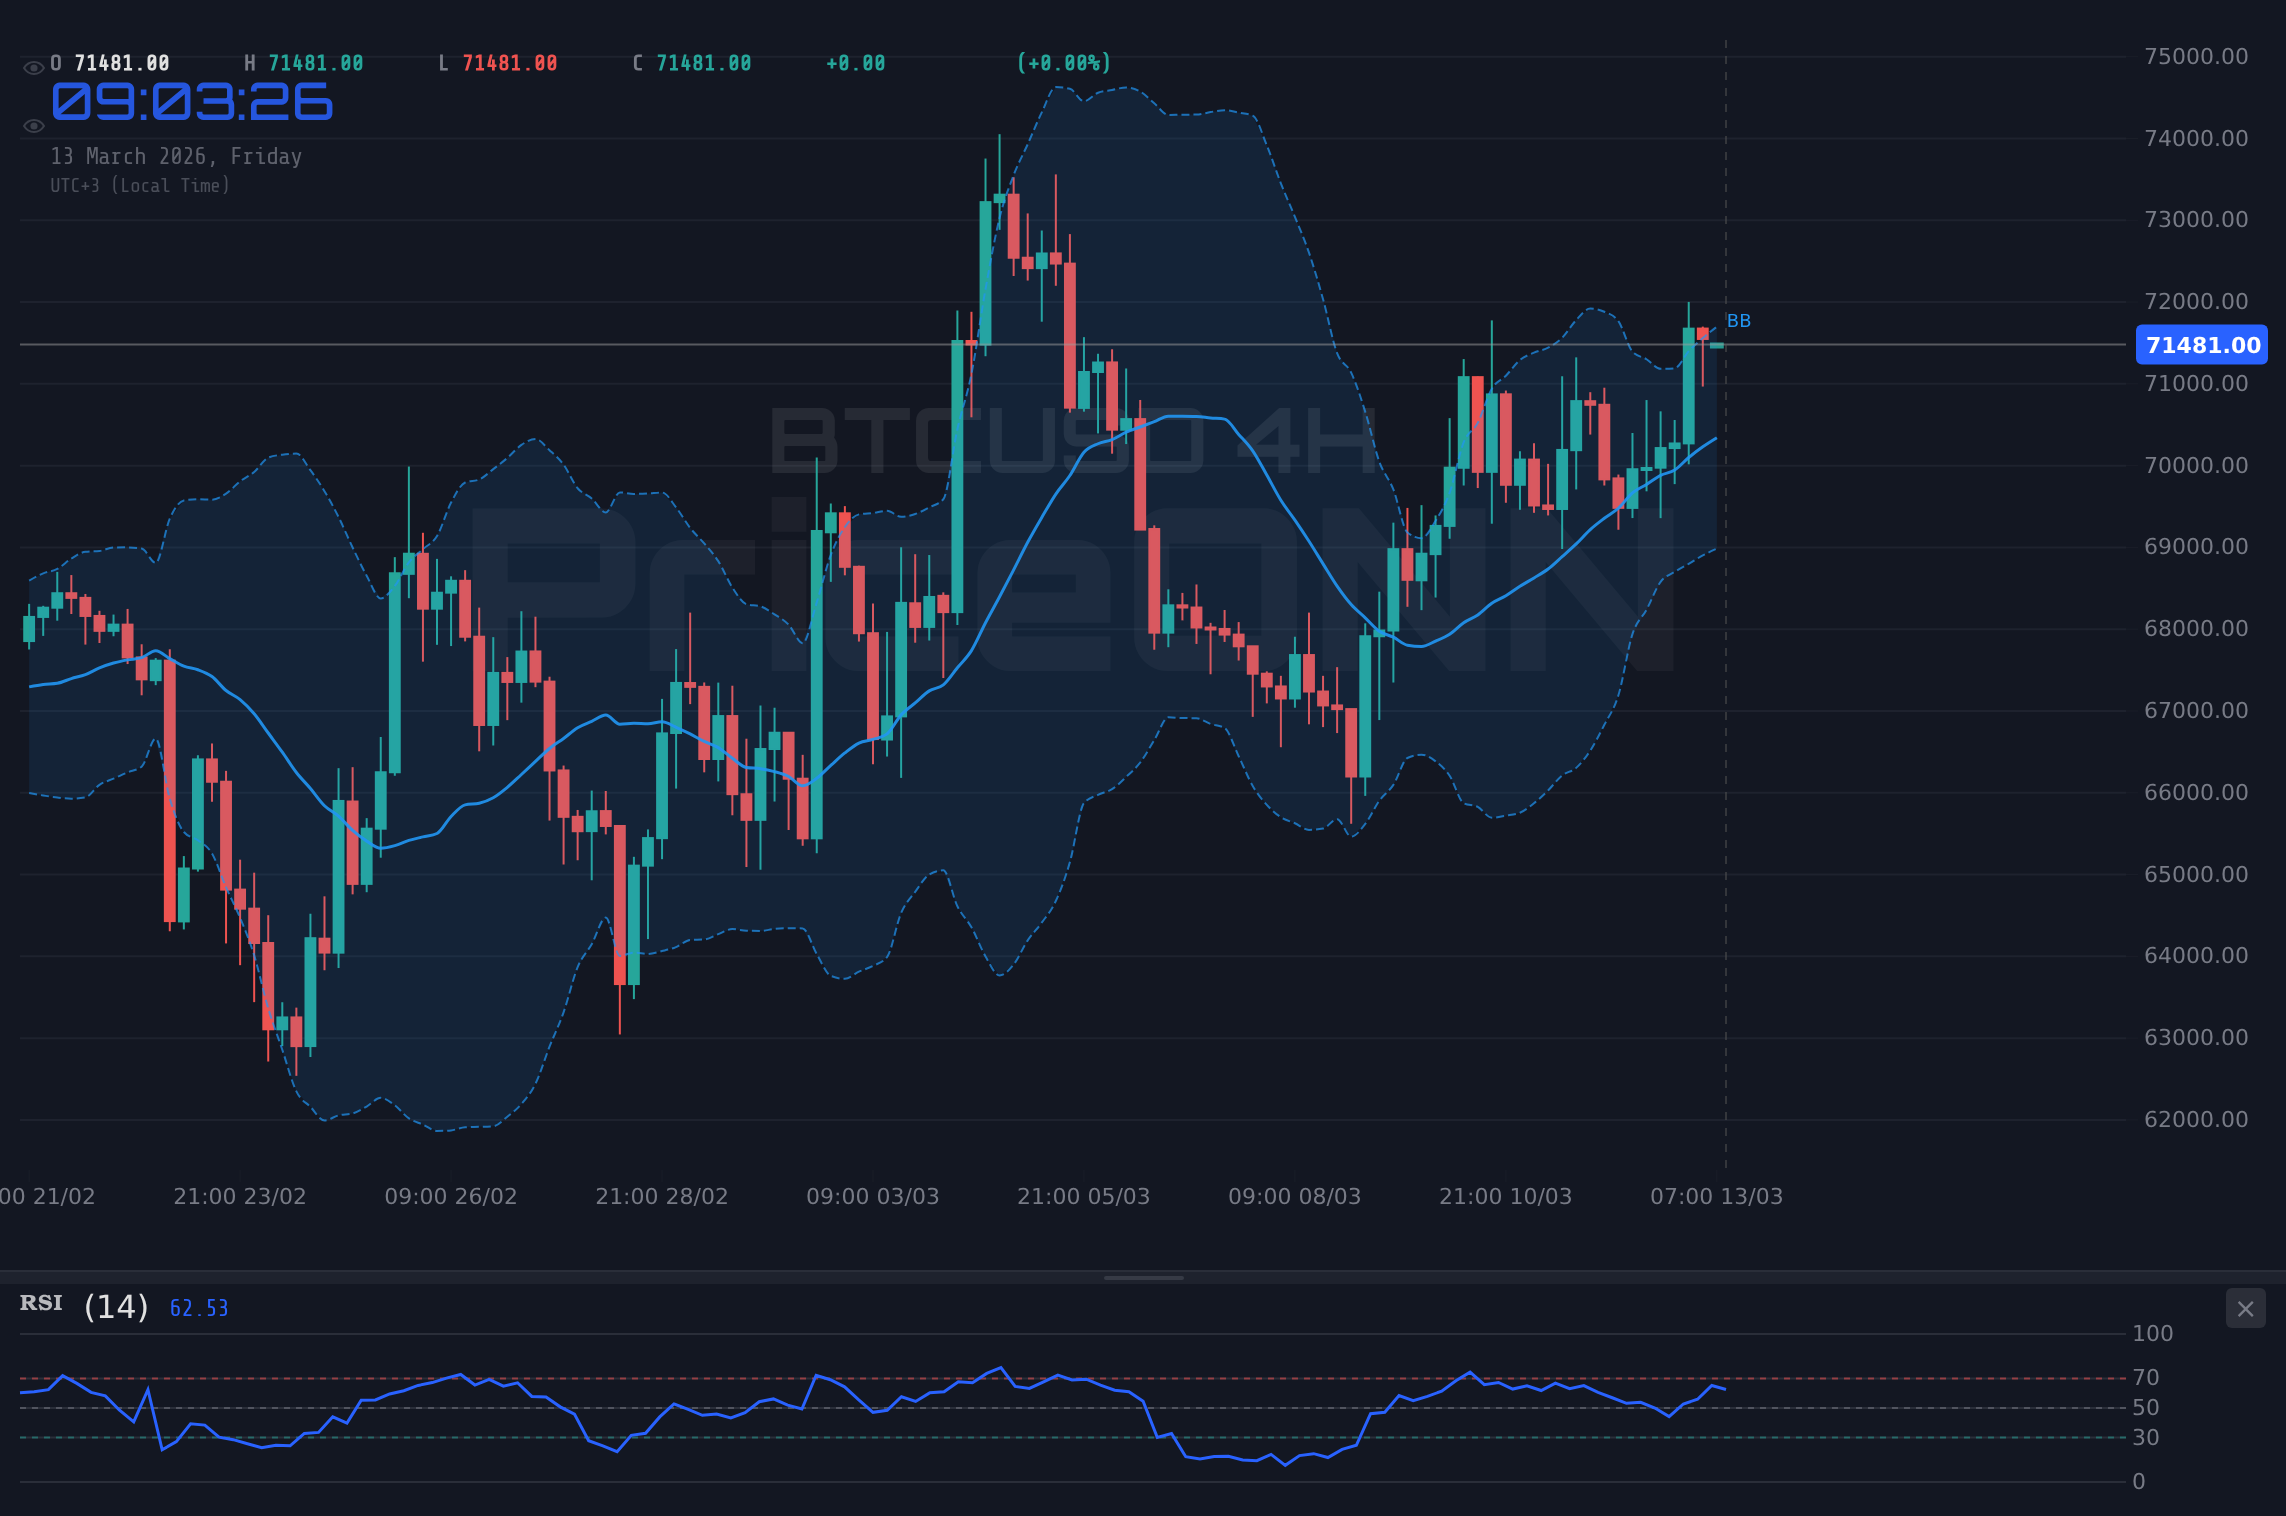
Let's dive deeper into the technicals. On the hourly chart, BTCUSD is showing signs of consolidation around the $71,584 mark. The RSI, currently at 63.24, suggests that the market is not yet overbought, but the upward momentum is slowing. This is crucial- it means that the bulls are losing steam but not necessarily in full reversal territory yet. A dip below the hourly support level of $71,261.67 could open the door for a test of lower levels, perhaps even down to $71,126.33.
Zooming out to the 4-hour timeframe, the picture becomes a bit more compelling for the bulls. The ADX, a measure of trend strength, sits at a robust 30.29, indicating a strong uptrend. However, the Stochastic oscillator is flashing a warning sign, with %K at 76.11 and %D at 50.54. This overbought condition suggests that a pullback may be imminent. This is a classic case of indicator conflict, and it highlights the importance of not relying on any single signal in isolation.
Now, what about the daily chart? Here, the waters are murkier. While the overall trend is still technically up, the MACD histogram is showing signs of negative divergence. This means that the upward momentum is weakening, even as price continues to grind higher. This is a classic bearish signal, and it should not be ignored. The daily RSI, at 53.95, is neutral, offering little in the way of directional guidance. This is a wait-and-see situation for long-term investors.
From a price action perspective, the key level to watch is the $71,512.67 resistance on the hourly chart. A decisive break above this level could pave the way for a test of higher targets, perhaps even up to $71,628.33 or $71,763.67. Conversely, a failure to break above $71,512.67 and a subsequent break below $71,261.67 support could trigger a deeper correction, potentially down to the $71,126.33 or even the $71,010.67 level. These are the lines in the sand for short-term traders.
But it's not just about the technicals. The fundamental backdrop is also playing a significant role. The recent surge in oil prices, driven by escalating tensions in the Middle East, is injecting inflationary pressures into the market. According to recent news, WTI crude oil is trading near $96, driven by escalating tensions around the Strait of Hormuz. This is significant, as rising oil prices tend to be correlated with higher inflation expectations, which can, in turn, impact Bitcoin's appeal as an inflation hedge. The risk-on/risk-off dynamics are further complicated by these geopolitical factors.
Looking at the broader market context, the DXY (Dollar Index) is currently trading at 99.6, showing signs of strength. Historically, a stronger dollar tends to put pressure on risk assets like Bitcoin, as it makes it more expensive for international investors to purchase. The SP500 is also showing signs of weakness, which could further weigh on Bitcoin's price. So, the external forces are aligning to create a potentially bearish environment for BTCUSD.
What does this mean for different types of traders? Scalpers should be focused on the hourly chart, watching for breakouts above $71,512.67 or breakdowns below $71,261.67. Swing traders should be paying closer attention to the 4-hour chart, looking for a confirmed break of either the $71,512.67 resistance or the $71,261.67 support. Long-term investors should be monitoring the daily chart and the overall macroeconomic environment, looking for signs of a sustained trend reversal.
Having tracked BTCUSD through the volatile 2024 rate cycle, I've seen this pattern before - consolidation followed by a sharp move in either direction. Historically, when the RSI reaches this zone on BTCUSD, the outcome has been a brief period of sideways trading before the next impulsive move. The key here is patience. Manage your risk, wait for your setup- the market always gives a second chance.
Let's talk correlations. BTCUSD typically exhibits an inverse correlation with the DXY, meaning that a stronger dollar tends to weigh on Bitcoin's price. With the DXY currently at 99.6, showing signs of strength, this is a headwind for BTCUSD. However, this correlation is not always perfect, and there are times when Bitcoin decouples from the dollar. The SP500 is also an important factor to consider. As a risk asset, Bitcoin tends to be correlated with the SP500, meaning that a decline in the stock market could also weigh on Bitcoin's price.
What about bonds? Rising Treasury yields can also put pressure on Bitcoin, as they make fixed-income assets more attractive relative to riskier assets like Bitcoin. So, keep an eye on the 10-year Treasury yield- a sustained move above 4.5% could be a bearish signal for BTCUSD. Oil's surge is a double-edged sword. On one hand, it might stoke inflation fears, potentially boosting Bitcoin as an inflation hedge. On the other, higher oil prices can also lead to a risk-off environment, which could weigh on Bitcoin.
Trade Plan: Given the strong uptrend on the 4H chart (ADX at 30.29), positive momentum (MACD), and the current price hovering around $71,584, a bullish scenario has a higher probability (estimated 65%). However, the overbought Stochastic oscillator warrants caution.
BTCUSD breaks above the hourly resistance at $71,512.67, confirming bullish momentum. Targets include $71,628.33 and $71,763.67. A sustained move above $71,763.67 could open the door for a test of higher levels, potentially up to $72,000.
BTCUSD fails to break above $71,512.67 and breaks below the hourly support at $71,261.67, triggering a correction. Targets include $71,126.33 and $71,010.67. A sustained move below $71,010.67 could signal a deeper correction.
Frequently Asked Questions: BTCUSD Analysis
What happens if BTCUSD breaks above $71,512.67 resistance?
A break above the $71,512.67 resistance level could signal a continuation of the uptrend, potentially leading to a test of higher targets at $71,628.33 and $71,763.67. This scenario is supported by the 4H ADX reading of 30.29, indicating a strong uptrend.
Should I buy BTCUSD at current levels of $71,584 given RSI at 63.24?
While the RSI at 63.24 is not yet overbought, it suggests that the upward momentum is slowing. A more prudent approach would be to wait for a pullback to the $71,261.67 support level before considering a long position. Manage your risk with a stop-loss order below this level.
Is the negative divergence on the daily MACD a sell signal for BTCUSD?
The negative divergence on the daily MACD is a bearish signal, suggesting that the upward momentum is weakening. However, it is not a definitive sell signal. It would be wise to wait for further confirmation, such as a break below the $71,261.67 support level, before initiating a short position.
How will the rising oil prices affect BTCUSD this week?
Rising oil prices could inject inflationary pressures into the market, potentially boosting Bitcoin's appeal as an inflation hedge. However, higher oil prices could also lead to a risk-off environment, which could weigh on Bitcoin. The net impact will depend on the market's overall risk appetite.
Technical Outlook Summary
| Indicator | Value | Signal |
|---|---|---|
| RSI (14) | 63.24 | Neutral |
| MACD Histogram | Positive | Bullish |
| Stochastic | 73.94 | Bearish |
| ADX | 30.29 | Strong Trend |
| Bollinger | Upper Band | Watch |
Key Levels
Support Levels
Resistance Levels
Track markets in real-time
AI-powered analysis, technical indicators and real-time price data.
Join Our Telegram Channel
Breaking market news, AI analysis and trading signals instantly.
Join Channel