Brent Crude Eyes $100.40 Amid Hormuz Strait Tensions
Brent crude oil is trading around $100.40 as escalating tensions in the Strait of Hormuz raise supply disruption fears, impacting global energy markets.
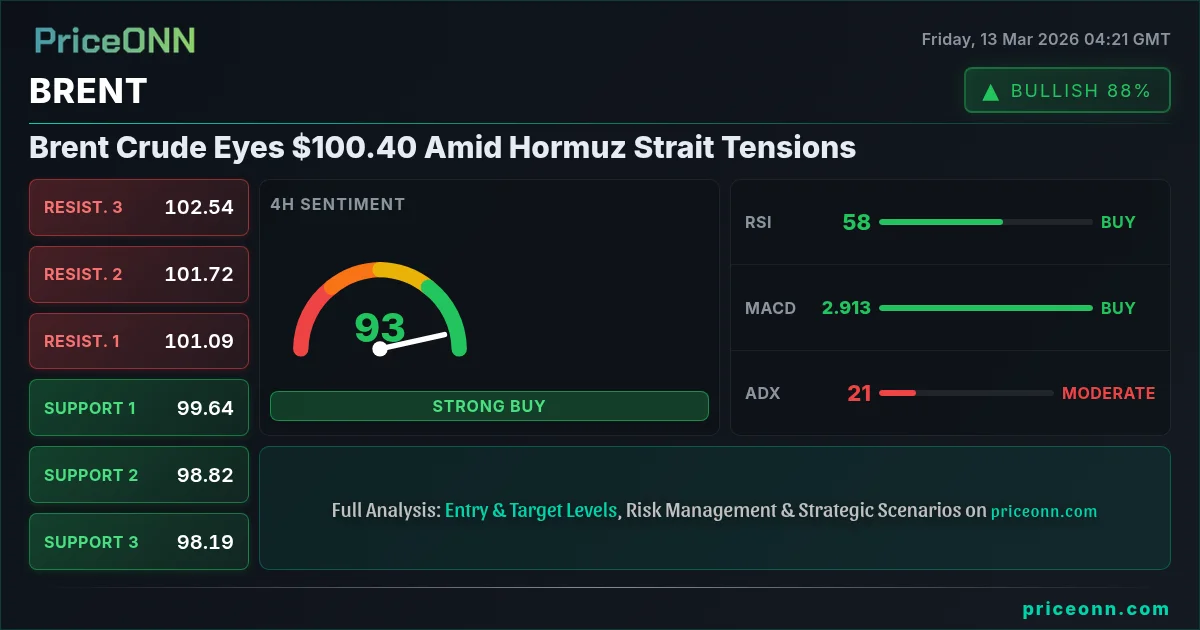
The Strait of Hormuz, a vital artery for global oil supply, is once again a focal point as geopolitical tensions escalate. News outlets report Iran threatening to disrupt shipping lanes, sending a ripple effect through energy markets. This renewed uncertainty has pushed Brent crude oil to approximately $100.40, a level that traders are closely watching as a potential breakout point. The question now is whether this rally is sustainable or a short-term reaction to fear.
- Brent crude oil price hovers around $100.40 amid rising geopolitical risk in the Middle East.
- Strong resistance at $103.90 needs to be broken for further upside.
- ADX at 55.84 on the daily chart indicates a very strong uptrend.
- DXY strength could put downward pressure on Brent, creating a complex trading environment.
The surge in Brent prices is not solely attributable to Middle East tensions. Broader market dynamics play a significant role. The dollar index (DXY) currently stands at 99.56 and is showing signs of strength. Historically, a rising DXY puts downward pressure on commodities priced in dollars, including crude oil. However, the geopolitical risk premium appears to be overriding this inverse correlation, at least for now. Traders should monitor the DXY closely; a sustained rally above 99.58 could limit Brent's upside potential. Furthermore, the SP500 and Nasdaq are showing signs of weakness, typically leading to risk-off sentiment which could bolster safe-haven demand, potentially impacting oil dynamics as well.
From a technical perspective, the daily chart for Brent crude reveals a strong uptrend, with the ADX indicator registering a value of 55.84, signaling a very strong trend. This suggests that the current rally has significant momentum behind it. However, the RSI (14) is in overbought territory at 83.09, indicating that the market may be due for a pullback or consolidation. The Stochastic oscillator, while showing a bearish crossover (K=52.55, D=60.43), needs confirmation from other indicators to validate a potential reversal. Scalpers might look for short-term opportunities near resistance levels, while swing traders should exercise caution given the overbought conditions.

Looking at multi-timeframe analysis, the 4-hour chart shows a similar bullish bias. The RSI (14) stands at 58.66, still providing room for further upside before reaching overbought levels. The MACD histogram is positive, indicating bullish momentum. Key resistance levels to watch are $102.77, $103.87, and $105.97. A breakout above $103.90 would likely fuel further gains. On the downside, immediate support lies at $100.38 on the 1-hour chart, followed by $99.70. A break below $99.70 could signal a deeper correction towards the $97.31 level on the daily chart.
The current environment presents a complex picture for different types of traders. Scalpers might seek to exploit short-term volatility, targeting quick profits near resistance levels. Swing traders should be cautious given the overbought conditions and consider waiting for a pullback to support before initiating long positions. Long-term investors need to assess whether the current geopolitical risk premium is sustainable or a temporary phenomenon. They should also monitor global economic growth prospects, as slowing growth could dampen oil demand and weigh on prices. Remember the emerging query from the keyword analysis: 'brent prognose' - highlighting the market's intense search for future price direction.
Adding a historical perspective, similar geopolitical events in the past have often led to short-term spikes in oil prices, followed by corrections once the initial fear subsides. For instance, the 2019 drone attacks on Saudi Arabian oil facilities caused a temporary surge in prices, but the market quickly stabilized once production resumed. This historical pattern suggests that the current rally could also be followed by a period of consolidation or correction. Therefore, traders should avoid chasing the rally and focus on identifying key levels for potential entries and exits.
Recent news underscores the urgency of the situation. Reports indicate that Iran is threatening to block the Strait of Hormuz, a critical chokepoint for global oil shipments. This threat has exacerbated supply concerns and contributed to the recent price surge. While the actual implementation of such a blockade remains uncertain, the mere possibility is enough to rattle markets. The USD/CAD is also climbing due to geopolitical risks which in turn puts pressure on the Canadian dollar. Investors should keep a close eye on further developments in the Middle East, as any escalation could trigger further price volatility.
From a fundamental standpoint, the oil market is also influenced by OPEC+ production decisions and global demand forecasts. While OPEC+ has maintained its current production targets, there is growing pressure to increase output to alleviate supply concerns. However, any significant increase in production could weigh on prices. Furthermore, global economic growth prospects remain uncertain, with some economists forecasting a slowdown in the second half of the year. Slower growth could dampen oil demand and put downward pressure on prices. The key is to balance these factors when assessing the long-term outlook for Brent crude.
The economic calendar also plays a crucial role. On March 13th (Friday), there are several high-impact USD releases scheduled, including those related to economic activity. The previous figures show 4.3, 0.4, 3, and -1.4. These data points, especially if deviating significantly from expectations, could trigger volatility in the dollar, subsequently influencing Brent prices. Traders should be prepared for potential market swings following these releases. The market is already pricing in a certain level of risk, but any surprise could amplify the impact. The GBP has an event scheduled for today as well, but the impact is expected to be minimal.
Analyzing correlations, the inverse relationship between Brent crude and the US dollar is a key factor to consider. With the DXY at 99.56 and showing strength, Brent crude faces potential headwinds. However, the geopolitical risk premium is currently overriding this correlation. Furthermore, the performance of equity markets, particularly the SP500 and Nasdaq, can provide insights into risk sentiment. A decline in these indices typically signals a risk-off environment, which could support safe-haven demand and potentially benefit oil prices due to supply concerns.
The current outlook for Brent crude is a blend of bullish and bearish factors. Geopolitical tensions and strong technical momentum support further upside, while a rising US dollar and overbought conditions suggest caution. Traders should focus on key levels, monitor economic data releases, and remain aware of the evolving geopolitical landscape. Patience and disciplined risk management will be crucial for navigating these choppy waters. The key level to watch remains $103.90; a sustained break above this level could open the door to further gains, while a failure to break could signal a period of consolidation or correction.
Sustained geopolitical tensions push Brent above $103.90 resistance, targeting $105.97 and potentially $110.49. This scenario requires continued supply disruption fears and a weaker US dollar.
Easing geopolitical tensions and a stronger US dollar lead to a correction, with Brent falling below $100.38 support, targeting $97.31 and potentially $92.95. This scenario requires a resolution of Middle East conflicts and a stronger DXY.
Frequently Asked Questions: BRENT Analysis
What happens if BRENT breaks above $103.90 resistance?
A sustained break above the $103.90 resistance level could trigger a significant rally, potentially targeting the $105.97 and $110.49 levels. This scenario would likely be driven by continued geopolitical tensions and supply disruption fears.
Should I buy BRENT at current levels of $100.40 given RSI at 83.09?
Given the overbought RSI of 83.09 on the daily chart, initiating new long positions at $100.40 is risky. It's prudent to wait for a pullback towards support levels or a consolidation phase before entering long positions. A break below $100.38 could signal a deeper correction.
Is ADX at 55.84 a reliable buy signal for BRENT?
An ADX of 55.84 indicates a very strong uptrend, suggesting that the current rally has significant momentum. However, traders should not rely solely on the ADX. Confirmation from other indicators and fundamental factors is essential before making a trading decision.
How will the upcoming USD releases on March 13th affect BRENT this week?
The high-impact USD releases scheduled for March 13th could trigger volatility in the dollar, subsequently influencing Brent prices. Stronger-than-expected data could strengthen the dollar and put downward pressure on Brent, while weaker-than-expected data could weaken the dollar and support Brent prices.
Technical Outlook Summary
| Indicator | Value | Signal |
|---|---|---|
| RSI (14) | 83.09 | Overbought |
| MACD Histogram | Positive | Bullish |
| Stochastic | 52.55 / 60.43 | Bearish |
| ADX | 55.84 | Strong Trend |
| Bollinger | Upper Band | Watch |
Key Levels
Support Levels
Resistance Levels
Track markets in real-time
AI-powered analysis, technical indicators and real-time price data.
Join Our Telegram Channel
Breaking market news, AI analysis and trading signals instantly.
Join Channel