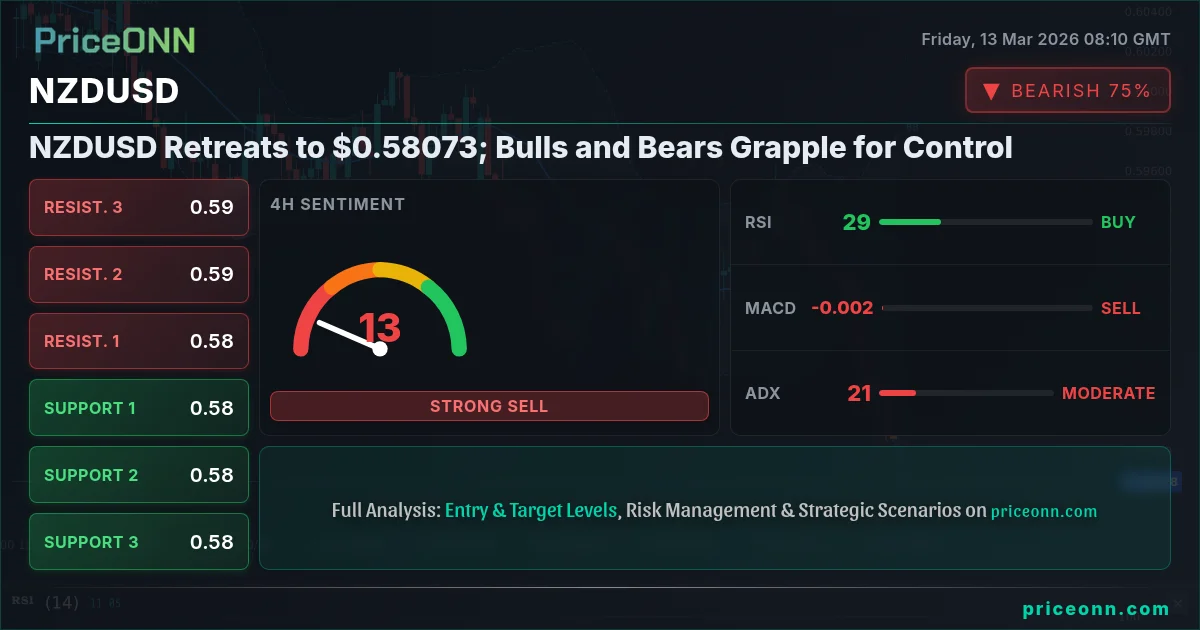
NZDUSD is currently trading near $0.58073, a level where bulls and bears are locked in a fierce battle. The pair has been pressured by a strengthening US Dollar, as indicated by the DXY index at 99.95, and broader risk-off sentiment reflected in the SP500's 0.5% decline. Will this support level hold, or is a further decline imminent? This article explores both bullish and bearish scenarios for NZDUSD, incorporating technical indicators and fundamental drivers to provide a comprehensive market outlook.
- NZDUSD tests support at $0.58093 amid broad risk-off sentiment reflected in SP500's 0.5% decline.
- RSI at 13.43 on the 1H chart signals oversold conditions, but strong downtrend confirmed by ADX at 46.71.
- Break above the 0.5826 resistance level would signal a potential bullish reversal.
- Upcoming USD data releases will significantly impact NZDUSD correlation with DXY.
The Bullish Case for NZDUSD
Despite the current bearish pressure, several factors suggest a potential bullish reversal for NZDUSD. Firstly, the Relative Strength Index (RSI) on the 1-hour chart is deeply oversold at 13.43. Historically, such extreme oversold conditions have often preceded a bounce, as buyers step in to take advantage of discounted prices. Furthermore, the Stochastic oscillator is also in oversold territory, with %K at 7.4 and %D at 12.7, reinforcing the potential for a short-term rally. A break above the immediate resistance at 0.5826 would confirm this bullish scenario. Moreover, the recent news of WTI Crude Oil soaring above $95 a barrel due to escalating tensions in the Strait of Hormuz could provide some support for commodity currencies like the New Zealand Dollar, given New Zealand's reliance on commodity exports.
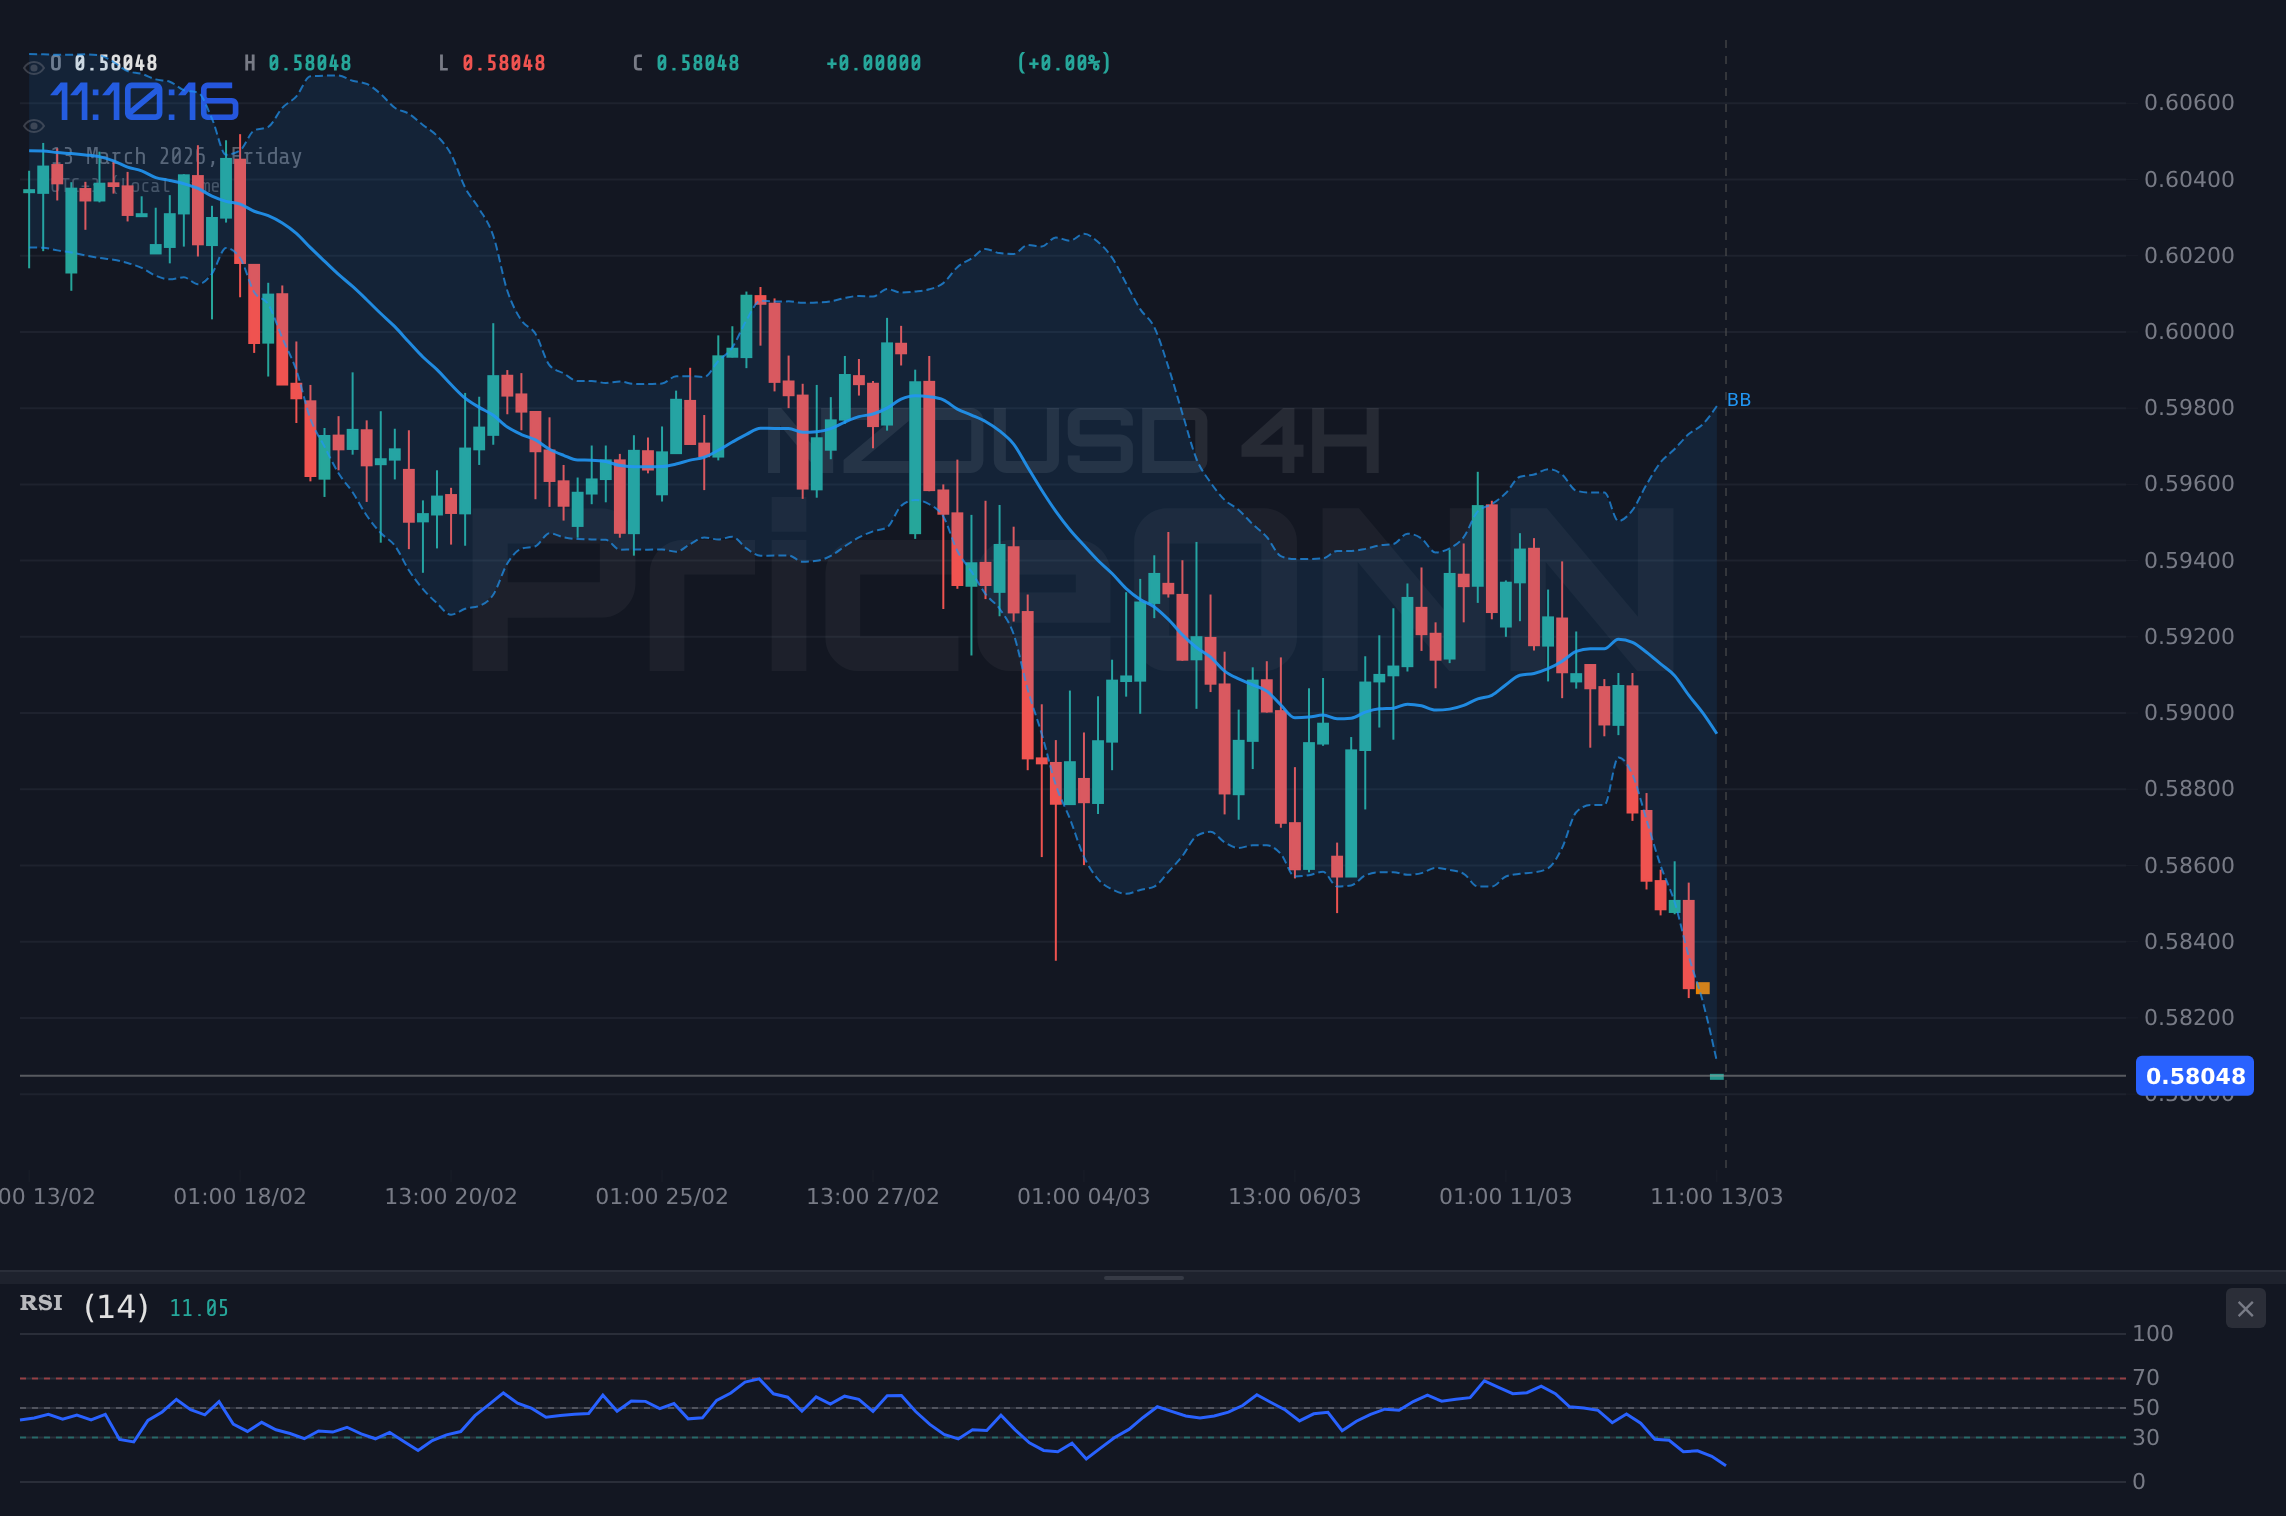
The 4-hour chart shows a slightly less oversold picture, with the RSI at 31.1, but the Stochastic oscillator is also signaling oversold conditions with %K at 2.84 and %D at 8.83. If NZDUSD can overcome the 0.58588 resistance level on this timeframe, it could pave the way for a more sustained recovery. A longer-term bullish argument could be built on a potential weakening of the US Dollar. The Dollar Index (DXY) is currently trading at 99.95, and the RSI on the daily chart is in overbought territory at 73.19, suggesting that the dollar's recent strength may be unsustainable. According to Reuters, Fed officials have emphasized that inflation remains 'stubborn'. If the market begins to price in a less aggressive rate hike path from the Federal Reserve, it could lead to a pullback in the dollar and provide a boost to NZDUSD.
The Bearish Case for NZDUSD
Despite the oversold conditions, the bearish case for NZDUSD remains compelling. The pair is currently trending downwards, with the 1-hour chart indicating a strong downtrend (100% strength). The Average Directional Index (ADX) on the 1-hour chart is at a robust 46.71, confirming the strength of the current downtrend. Moreover, the Moving Average Convergence Divergence (MACD) histogram is negative, indicating bearish momentum. The 1H support levels are 0.58093, 0.58022, and 0.57926. A break below the immediate support at 0.58093 could trigger a fresh wave of selling pressure. The strengthening US Dollar, driven by safe-haven demand amid geopolitical tensions, is a significant headwind for NZDUSD. The SP500 is down 0.5% and the Nasdaq is also down 0.53% at 24414.51, showing strong risk-off sentiment.
On the 4-hour chart, the ADX is lower at 18.85, suggesting a weaker trend, but the MACD histogram remains negative, and the Stochastic oscillator is still in oversold territory. The key resistance to watch on this timeframe is 0.58588. A failure to break above this level would reinforce the bearish outlook. Furthermore, the daily chart also paints a bearish picture, with the pair trending downwards, and the MACD histogram negative. The ADX is at 23.22, indicating a moderately strong downtrend. The daily RSI is at 34.48, leaving room for further downside before reaching oversold territory. The daily support levels are 0.5826, 0.58035 and 0.57601.
Technicals as a Tiebreaker
The technical indicators present a mixed picture, with oversold conditions on the shorter timeframes counterbalanced by strong downtrends and negative momentum on the longer timeframes. The 1-hour chart suggests a potential short-term bounce, but the 4-hour and daily charts indicate that the overall trend remains bearish. Therefore, traders should exercise caution and wait for confirmation before initiating any long positions. For instance, a decisive break above the 0.5826 resistance level on the 1-hour chart, accompanied by a positive MACD crossover, could signal a shift in momentum. Conversely, a break below the 0.58093 support level could trigger a fresh wave of selling pressure.
The daily chart shows that the pair is trading below its 200-day moving average, which is a bearish sign. The MACD histogram is negative, and the ADX is at 23.22, indicating a moderately strong downtrend. The daily RSI is at 34.48, leaving room for further downside before reaching oversold territory. The Stochastic oscillator is also signaling oversold conditions, with %K at 17.88 and %D at 38.69.
Having tracked NZDUSD through the 2024 rate cycle, I’ve seen this tug-of-war play out before. Remember, the market often consolidates before a major move. The key here is patience. Watch the DXY and SP500 for clues. A sustained break above 100 on the DXY would put significant pressure on NZDUSD. Similarly, a deeper correction in the SP500 would reinforce the risk-off sentiment and weigh on the pair.
Economic Data and Market Sentiment
The upcoming economic data releases, particularly USD data, will play a crucial role in determining the short-term direction of NZDUSD. As of today, March 13th, there are several USD data releases scheduled, including previous readings of 4.3 and 3. These releases could provide further insights into the health of the US economy and influence the Federal Reserve's policy decisions. These potential data points could heavily impact the NZDUSD correlation with DXY. Any surprises in these data releases could trigger significant volatility in the currency markets. The EUR/CHF pair is also slipping below 0.97 as the Swiss National Bank stands pat amid geopolitical risks, creating a complex intermarket dynamic to be aware of.
Market sentiment is also a key factor to consider. The recent surge in oil prices, driven by tensions in the Middle East, has created a risk-off environment, with investors flocking to safe-haven assets like the US Dollar. This is evident in the DXY's recent strength. However, if tensions ease and oil prices stabilize, it could lead to a reversal in market sentiment and provide a boost to riskier assets like the New Zealand Dollar.
Verdict: Cautious Bearish Bias
Based on the current technical and fundamental outlook, a cautious bearish bias seems warranted for NZDUSD. The pair is trending downwards, the US Dollar is strong, and risk-off sentiment is prevalent. However, the oversold conditions on the shorter timeframes suggest that a short-term bounce is possible. Therefore, traders should exercise caution and wait for confirmation before initiating any positions. Until the USD data resolves this, caution is warranted.
Frequently Asked Questions: NZDUSD Analysis
What happens if NZDUSD breaks below $0.58093 support?
A break below the immediate support at $0.58093 on the 1-hour chart could trigger a fresh wave of selling pressure, potentially leading to a test of the next support level at $0.58022. This scenario would reinforce the bearish outlook for the pair.
Should I buy NZDUSD at current levels of $0.58073 given RSI at 13.43?
While the RSI at 13.43 on the 1-hour chart indicates oversold conditions, it's crucial to consider the broader trend. Given the strong downtrend confirmed by the ADX at 46.71, it's prudent to wait for a positive MACD crossover or a break above the $0.5826 resistance before initiating a long position.
Is the negative MACD histogram a strong sell signal for NZDUSD?
The negative MACD histogram on the 1-hour chart does indicate bearish momentum, but it's essential to consider the oversold conditions signaled by the RSI and Stochastic oscillator. A confirmed break below the $0.58093 support, accompanied by a continued negative MACD histogram, would strengthen the sell signal.
How will the upcoming USD data affect NZDUSD this week?
Upcoming USD data releases could significantly impact the NZDUSD correlation with DXY. Stronger-than-expected USD data could lead to a further strengthening of the US Dollar, putting downward pressure on NZDUSD. Conversely, weaker-than-expected data could trigger a pullback in the dollar and provide a boost to NZDUSD.
Technical Outlook Summary
| Indicator | Value | Signal |
|---|---|---|
| RSI (14) | 34.48 (1D) | Neutral |
| MACD Histogram | Negative | Bearish |
| Stochastic | 17.88/38.69 (1D) | Bearish |
| ADX | 23.22 (1D) | Weak Trend |
| Bollinger | Lower Band | Watch |
Track markets in real-time
AI-powered analysis, technical indicators and real-time price data.
Join Our Telegram Channel
Breaking market news, AI analysis and trading signals instantly.
Join Channel