Is the DowJones30 poised for a deeper correction? Trading at $46,889.50, the index is showing signs of weakness, and a break below key support could trigger a significant sell-off. While the market has been resilient, several factors suggest that the bulls' grip may be loosening.
- RSI at 51.86 on the 1H chart suggests potential for further downside momentum.
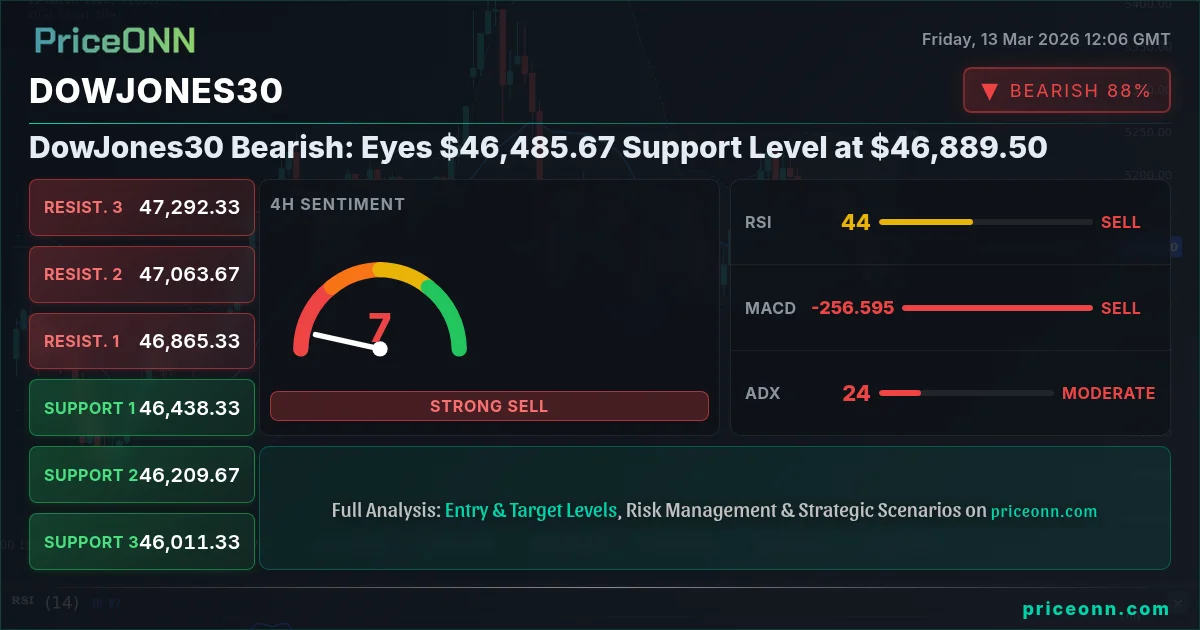
- Critical support lies at $46,485.67; a break below could accelerate losses.
- MACD on the 4H chart indicates negative momentum, signaling bearish pressure.
- Geopolitical tensions and rising dollar strength are weighing on risk sentiment and the DowJones30.
Why $46,485.67 is the Line in the Sand
The $46,485.67 level represents a critical juncture for the DowJones30. This support, derived from the daily timeframe, has held firm in recent trading sessions. However, the persistent downward pressure suggests that this level is increasingly vulnerable. DowJones30 today analysis reveals that a confirmed break below $46,485.67 could open the door for a test of lower support levels, potentially down to $46,243.33 and even $45,825.67.
Technical Indicators Paint a Bearish Picture
A multi-timeframe analysis reveals a confluence of bearish signals. On the 1-hour chart, the RSI sits at 51.86, indicating room for further downside momentum. The MACD on the 4-hour chart shows negative momentum, reinforcing the bearish sentiment. Furthermore, the stochastic oscillator on the daily chart is showing a bearish crossover with K=24.22 and D=29.25, signaling a potential shift in trend.
The ADX indicator, while showing a moderate trend strength of 23.86 on the 4H timeframe, further validates the bearish outlook. This ADX reading indicates that the trend is not yet exhausted, and the index may experience further downside movement. DowJones30 RSI, MACD signal are increasingly pointing towards the bearish side.
The DXY Connection: Dollar Strength Weighs
The U.S. dollar's recent surge to a four-month high, as reported by Forex News, is exerting significant pressure on the DowJones30. With the DXY currently at 99.8, a rising dollar typically correlates with weaker performance in risk assets like equities. This inverse relationship is playing out now, as dollar strength overshadows any potential positive catalysts for the DowJones30. DowJones30 correlation with DXY is key to watch.
Geopolitical Risks Add to the Downside
Escalating geopolitical tensions, particularly in the Middle East, are further contributing to the bearish outlook. The surge in oil prices, driven by concerns over supply disruptions, is fueling inflation fears and weighing on market sentiment. While the DowJones30 is not directly tied to oil prices, the broader risk-off environment created by these tensions is impacting investor confidence. DowJones30 news impact is largely shaped by these global events.
Risk-Off Sentiment: Safe Havens in Demand
The prevailing risk-off sentiment is driving investors towards safe-haven assets, further exacerbating the pressure on the DowJones30. As the aussie dollar retreats from multi-year highs amidst rising safe-haven demand, it becomes clear that investors are seeking shelter from the storm. This flight to safety is contributing to the bearish momentum in the DowJones30.
DowJones30 Breakout: What Happens if Support Fails?
If the DowJones30 fails to hold the $46,485.67 support level, a breakout to the downside could trigger a rapid sell-off. The next key support level lies at $46,243.33, followed by $45,825.67. A break below these levels could signal a more significant correction and potentially a shift in the overall market trend. DowJones30 breakout is a key event to monitor.
Bearish Trade Scenario
Given the bearish technical and fundamental outlook, a short trade may be warranted. However, it's crucial to manage risk and wait for confirmation before entering a position. Patience looks like it will be rewarded here.
Enter short if the DowJones30 breaks and closes below $46,485.67. Target 1: $46,243.33. Target 2: $45,825.67. This scenario is driven by negative momentum and risk-off sentiment.
The bearish thesis fails if the DowJones30 holds above $46,708. A break above $46,853 could signal a short-term rally. Target 1: $46,902. Target 2: $46,998. This scenario is less probable given the current market conditions.
Be aware that high-impact USD economic data is scheduled for release today. This could trigger significant volatility and potentially invalidate the above trade plan.
DowJones30 Weekly Outlook: What to Watch
Looking ahead, several factors could influence the DowJones30's performance. Key among them is the upcoming USD data releases, which could provide further clarity on the Fed's monetary policy path. Additionally, geopolitical developments and their impact on oil prices will continue to be a major driver of market sentiment. DowJones30 weekly outlook hinges on these factors.
Is This a Buying Opportunity?
While the current technical and fundamental outlook is bearish, contrarian investors may see this as a potential buying opportunity. The DowJones30 has historically demonstrated resilience, and a correction could present attractive entry points for long-term investors. However, it's crucial to exercise caution and manage risk, as further downside is possible. Manage your risk, wait for your setup-the market always gives a second chance.
Frequently Asked Questions: DowJones30 Analysis
What happens if DowJones30 breaks below $46,485.67 support?
A break below $46,485.67 could trigger a rapid sell-off, targeting the next support level at $46,243.33. Further downside could see a test of $45,825.67, signaling a more significant correction.
Should I short DowJones30 at current levels of $46,889.50 given the bearish signals?
Given the bearish technical and fundamental outlook, a short trade may be warranted, but it's crucial to wait for confirmation. A close below $46,485.67 would provide a stronger signal, increasing the probability of a successful short trade.
Is RSI at 51.86 a sell signal for DowJones30 right now?
While an RSI of 51.86 on the 1H chart is not yet in oversold territory, it suggests that there is room for further downside momentum. Combined with other bearish signals, it reinforces the potential for a short trade, but confirmation is needed.
How will the upcoming USD data releases affect DowJones30 this week?
Upcoming USD data releases could significantly impact the DowJones30. Stronger-than-expected data could further strengthen the dollar and exacerbate the bearish pressure on the index. Weaker data could provide a temporary reprieve, but the overall trend remains bearish.
Track markets in real-time
AI-powered analysis, technical indicators and real-time price data.
Join Our Telegram Channel
Breaking market news, AI analysis and trading signals instantly.
Join Channel